
Japan’s real GDP growth missed expectations in Q2 2025, printing at 0.3% quarter-on-quarter. Markets noticed. What they paid less attention to was the number sitting underneath: the GDP deflator accelerated to approximately 4.0% annualised, up from 3.3% in Q1. For a central bank still deciding when to deliver its next rate hike, the deflator overshoot is the figure that matters more than the growth shortfall.
The Q2 data, published around 17 August 2025, set the analytical conditions for the Bank of Japan’s September decision and for the yen’s medium-term trajectory. The BoJ held its policy rate at 0.50% that month, but it simultaneously announced sales of its ETF and J-REIT holdings, meaning tightening continued through the balance sheet even without a formal rate move. Commerzbank analyst Volkmar Baur, whose framework (reported by FXStreet) structures much of the analysis here, argues the data confirms a medium-term bullish case for the yen that most headline readers are missing.
Here is the framework for reading Japanese macro data the way institutional analysts do: separating the noise of the real GDP print from the signals that actually drive BoJ timing and yen direction.
Why the GDP deflator matters more than the headline growth miss
The real growth figure and the nominal growth figure told two different stories in Q2. Q2 real GDP came in at 0.3% quarter-on-quarter, equivalent to roughly 1.1% annualised, falling short of analyst forecasts. On the nominal side, the economy expanded 1.2% quarter-on-quarter, in line with expectations, and on a seasonally adjusted annualised basis reached approximately 5.1%, up from 3.9% in Q1.
The gap between those two numbers is the GDP deflator doing its work. The deflator, which captures the broadest measure of price changes across the entire economy, accelerated to approximately 4.0% annualised in Q2 from roughly 3.3% in Q1. That acceleration points to an inflation overshoot that ran well ahead of what the market had priced in.
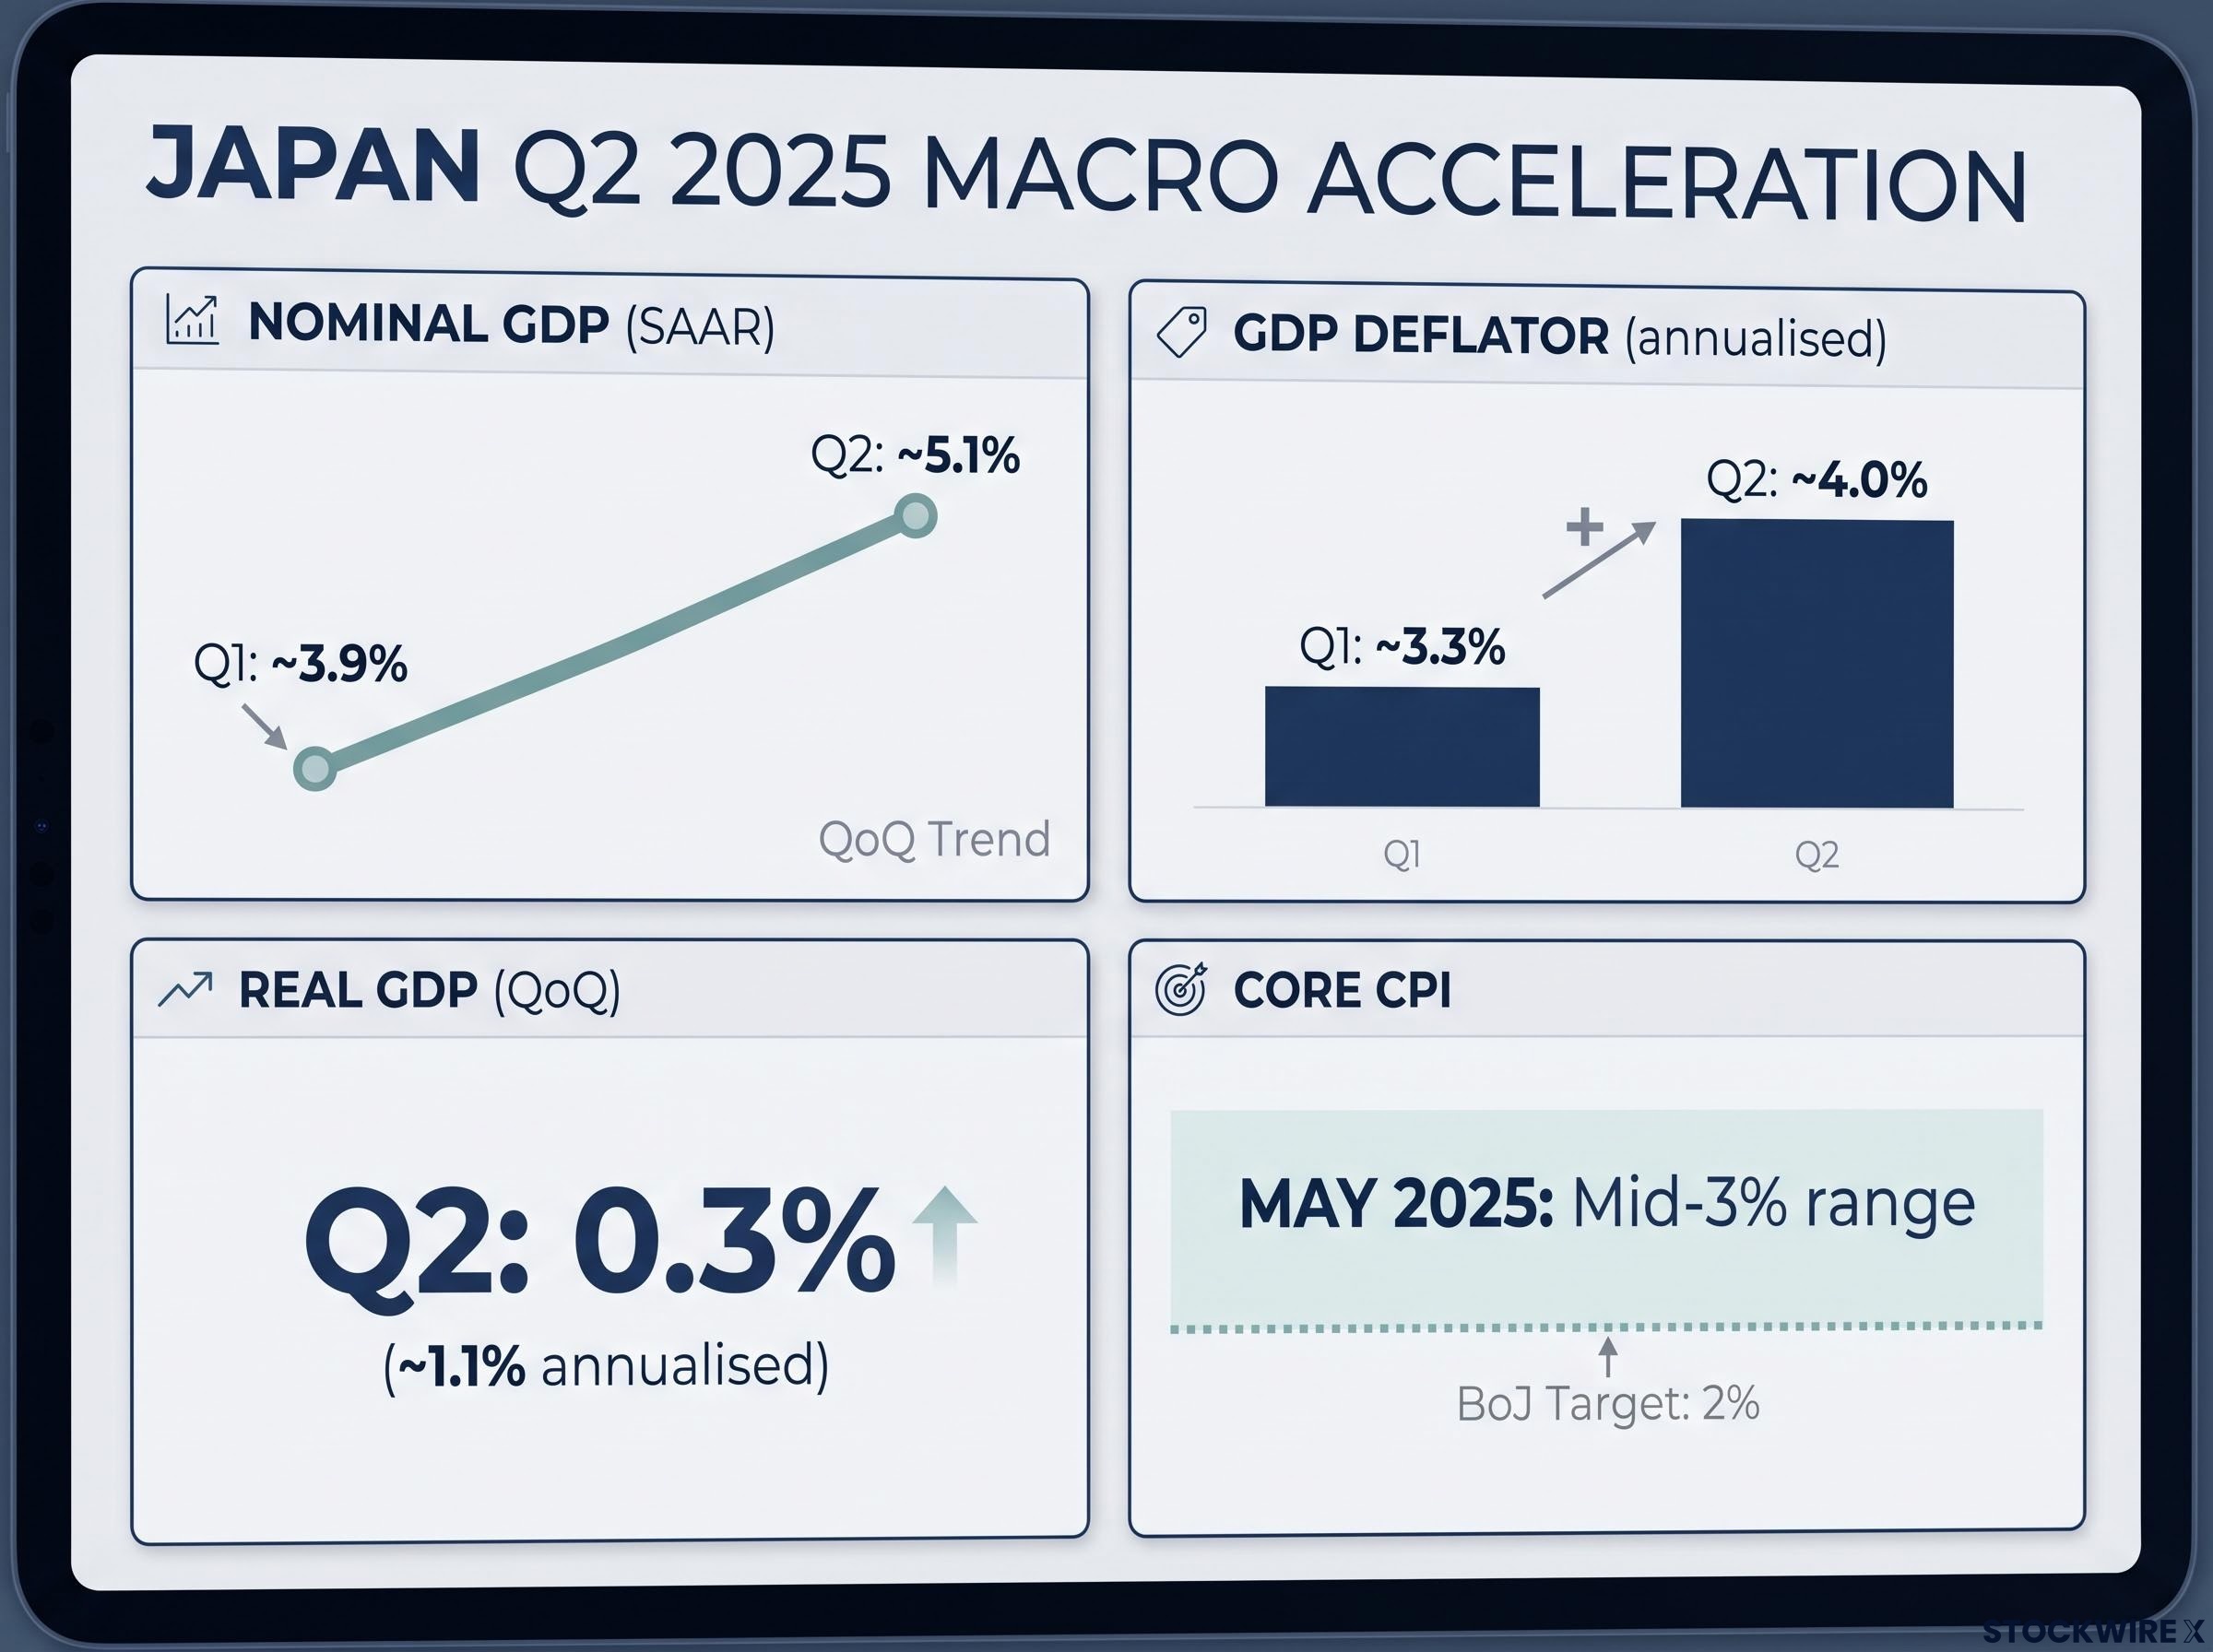
| Metric | Q1 2025 | Q2 2025 | vs. Expectations |
|---|---|---|---|
| Real GDP (QoQ) | — | 0.3% (~1.1% annualised) | Below consensus |
| Nominal GDP (SAAR) | ~3.9% | ~5.1% | Met consensus |
| GDP Deflator (annualised) | ~3.3% | ~4.0% | Above consensus |
| Core CPI (May 2025) | — | Mid-3% range | Above BoJ 2% target |
For a central bank whose entire policy framework centres on confirming that Japan has durably exited deflation, the deflator’s acceleration to 4.0% annualised carries more policy weight than a real growth miss. The BoJ prices in the inflation signal before the growth shortfall when forming its next rate decision, and the Q2 data made that hierarchy explicit.
The broader inflation backdrop reinforcing the deflator signal
The deflator is not an outlier. Core CPI was holding in the mid-3% range as of May 2025, comfortably above the BoJ’s 2% target. The 2025 shunto wage negotiations delivered outcomes that reinforced expectations of sustained price pressure, because rising wages feed directly into services inflation and consumer spending.
Together, these readings confirm a consistent inflationary pattern, not a one-off spike. That consistency is what gives the BoJ confidence to continue normalising, even when individual growth prints disappoint.
When big ASX news breaks, our subscribers know first
What the BoJ actually did in September, and why it matters
The September 2025 decision looked, at first glance, like a pause. The board voted 7-2 to hold the policy rate at 0.50%, the highest level since 2008. With the deflator overshooting and core CPI well above target, the decision not to hike appeared to contradict the data.
The September vote was 7-2 to hold at 0.50%, with two dissenting members advocating for a hike. The split signals an active hawkish minority on the board, not a uniformly cautious committee.
Then came the balance sheet announcement. At the same meeting, the BoJ outlined plans to begin selling holdings accumulated during years of emergency stimulus:
The BoJ September 2025 policy statement confirms the 7-2 vote to hold at 0.50% and the unanimous decision to begin ETF and J-REIT sales, establishing that the board treated balance sheet reduction as a distinct tightening channel separate from the overnight rate.
- ETF sales: approximately ¥330 billion annually at book value
- J-REIT sales: approximately ¥5 billion annually
The choice to tighten via the balance sheet rather than the policy rate was a deliberate sequencing decision. Minutes and reporting around the meeting show the board actively debated further rate increases, reflecting what amounted to a live discussion rather than a firmly dovish stance. Global uncertainty, including U.S. policy shifts, likely tipped the balance toward the less volatile tightening tool.
What this tells you about future meetings is important: a “hold” decision from the BoJ is not necessarily a pause in normalisation. The September meeting confirmed the BoJ has multiple tightening channels, and it is willing to use them simultaneously. The policy normalisation story remains intact even without a formal Bank of Japan rate hike at any single meeting.
The Bank of Japan rate hike to 1.0% in June 2026, delivered in a 7-1 board vote alongside a structured JGB tapering schedule, confirmed that the normalisation path signalled by the September 2025 balance sheet announcement had continued through subsequent meetings.
Understanding Japan’s inflation exit and what it means for yen carry trades
For decades, Japan’s near-zero or negative policy rates made the yen the world’s preferred funding currency for carry trades. Borrowing in yen to invest in higher-yielding currencies, such as the Australian or U.S. dollar, was nearly costless. Three conditions maintained this arrangement:
- Near-zero or negative interest rates, which made yen borrowing costs negligible
- Absent inflation, which gave the BoJ no reason to raise those rates
- Deflationary expectations, which anchored market consensus around the idea that Japanese rates would stay low indefinitely
Each of those conditions is now under pressure. The policy rate sits at 0.50%, the GDP deflator is running at 4.0% annualised, core CPI is in the mid-3% range, and the 2025 shunto wage outcomes have cemented expectations that price pressure is structural rather than transient. The carry trade does not collapse overnight at 0.50%, but every inflation confirmation incrementally increases the cost of holding a short-yen position.
Why the direction of travel matters more than the current rate level
Markets price in expected future rate differentials, not just current ones. A credible signal that the BoJ will hike again, supported by inflation data that validates the tightening path, can move the yen before any actual rate increase arrives. Forward-looking traders adjust positions based on where they expect the differential to be in six or twelve months, which means the trajectory of BoJ policy carries as much weight as the current 0.50% rate.
That is why the September balance sheet announcement matters beyond its immediate scale. It reinforced the direction of travel, and direction is what reprices carry trades.
Carry trade unwind risk is real but routinely overstated in financial media: the 2024 episode saw 40-60% of speculative positioning cleared within weeks with no cascading structural breakdown, a reference case that frames how to separate genuine systemic stress from headline noise.
Japan’s fiscal picture is not the crisis the narrative suggests
Japan’s gross government debt sits at approximately 200% of GDP. Rising JGB yields in the weeks before the August 2025 data release generated market unease, with some commentary framing Japan’s debt burden as a structural headwind for the yen. The number looks alarming. Commerzbank’s Baur argues it is incomplete.
Japan’s net debt, once sizeable government financial assets are deducted, is closer to just under 70% of GDP, a fundamentally different picture than the gross headline implies.
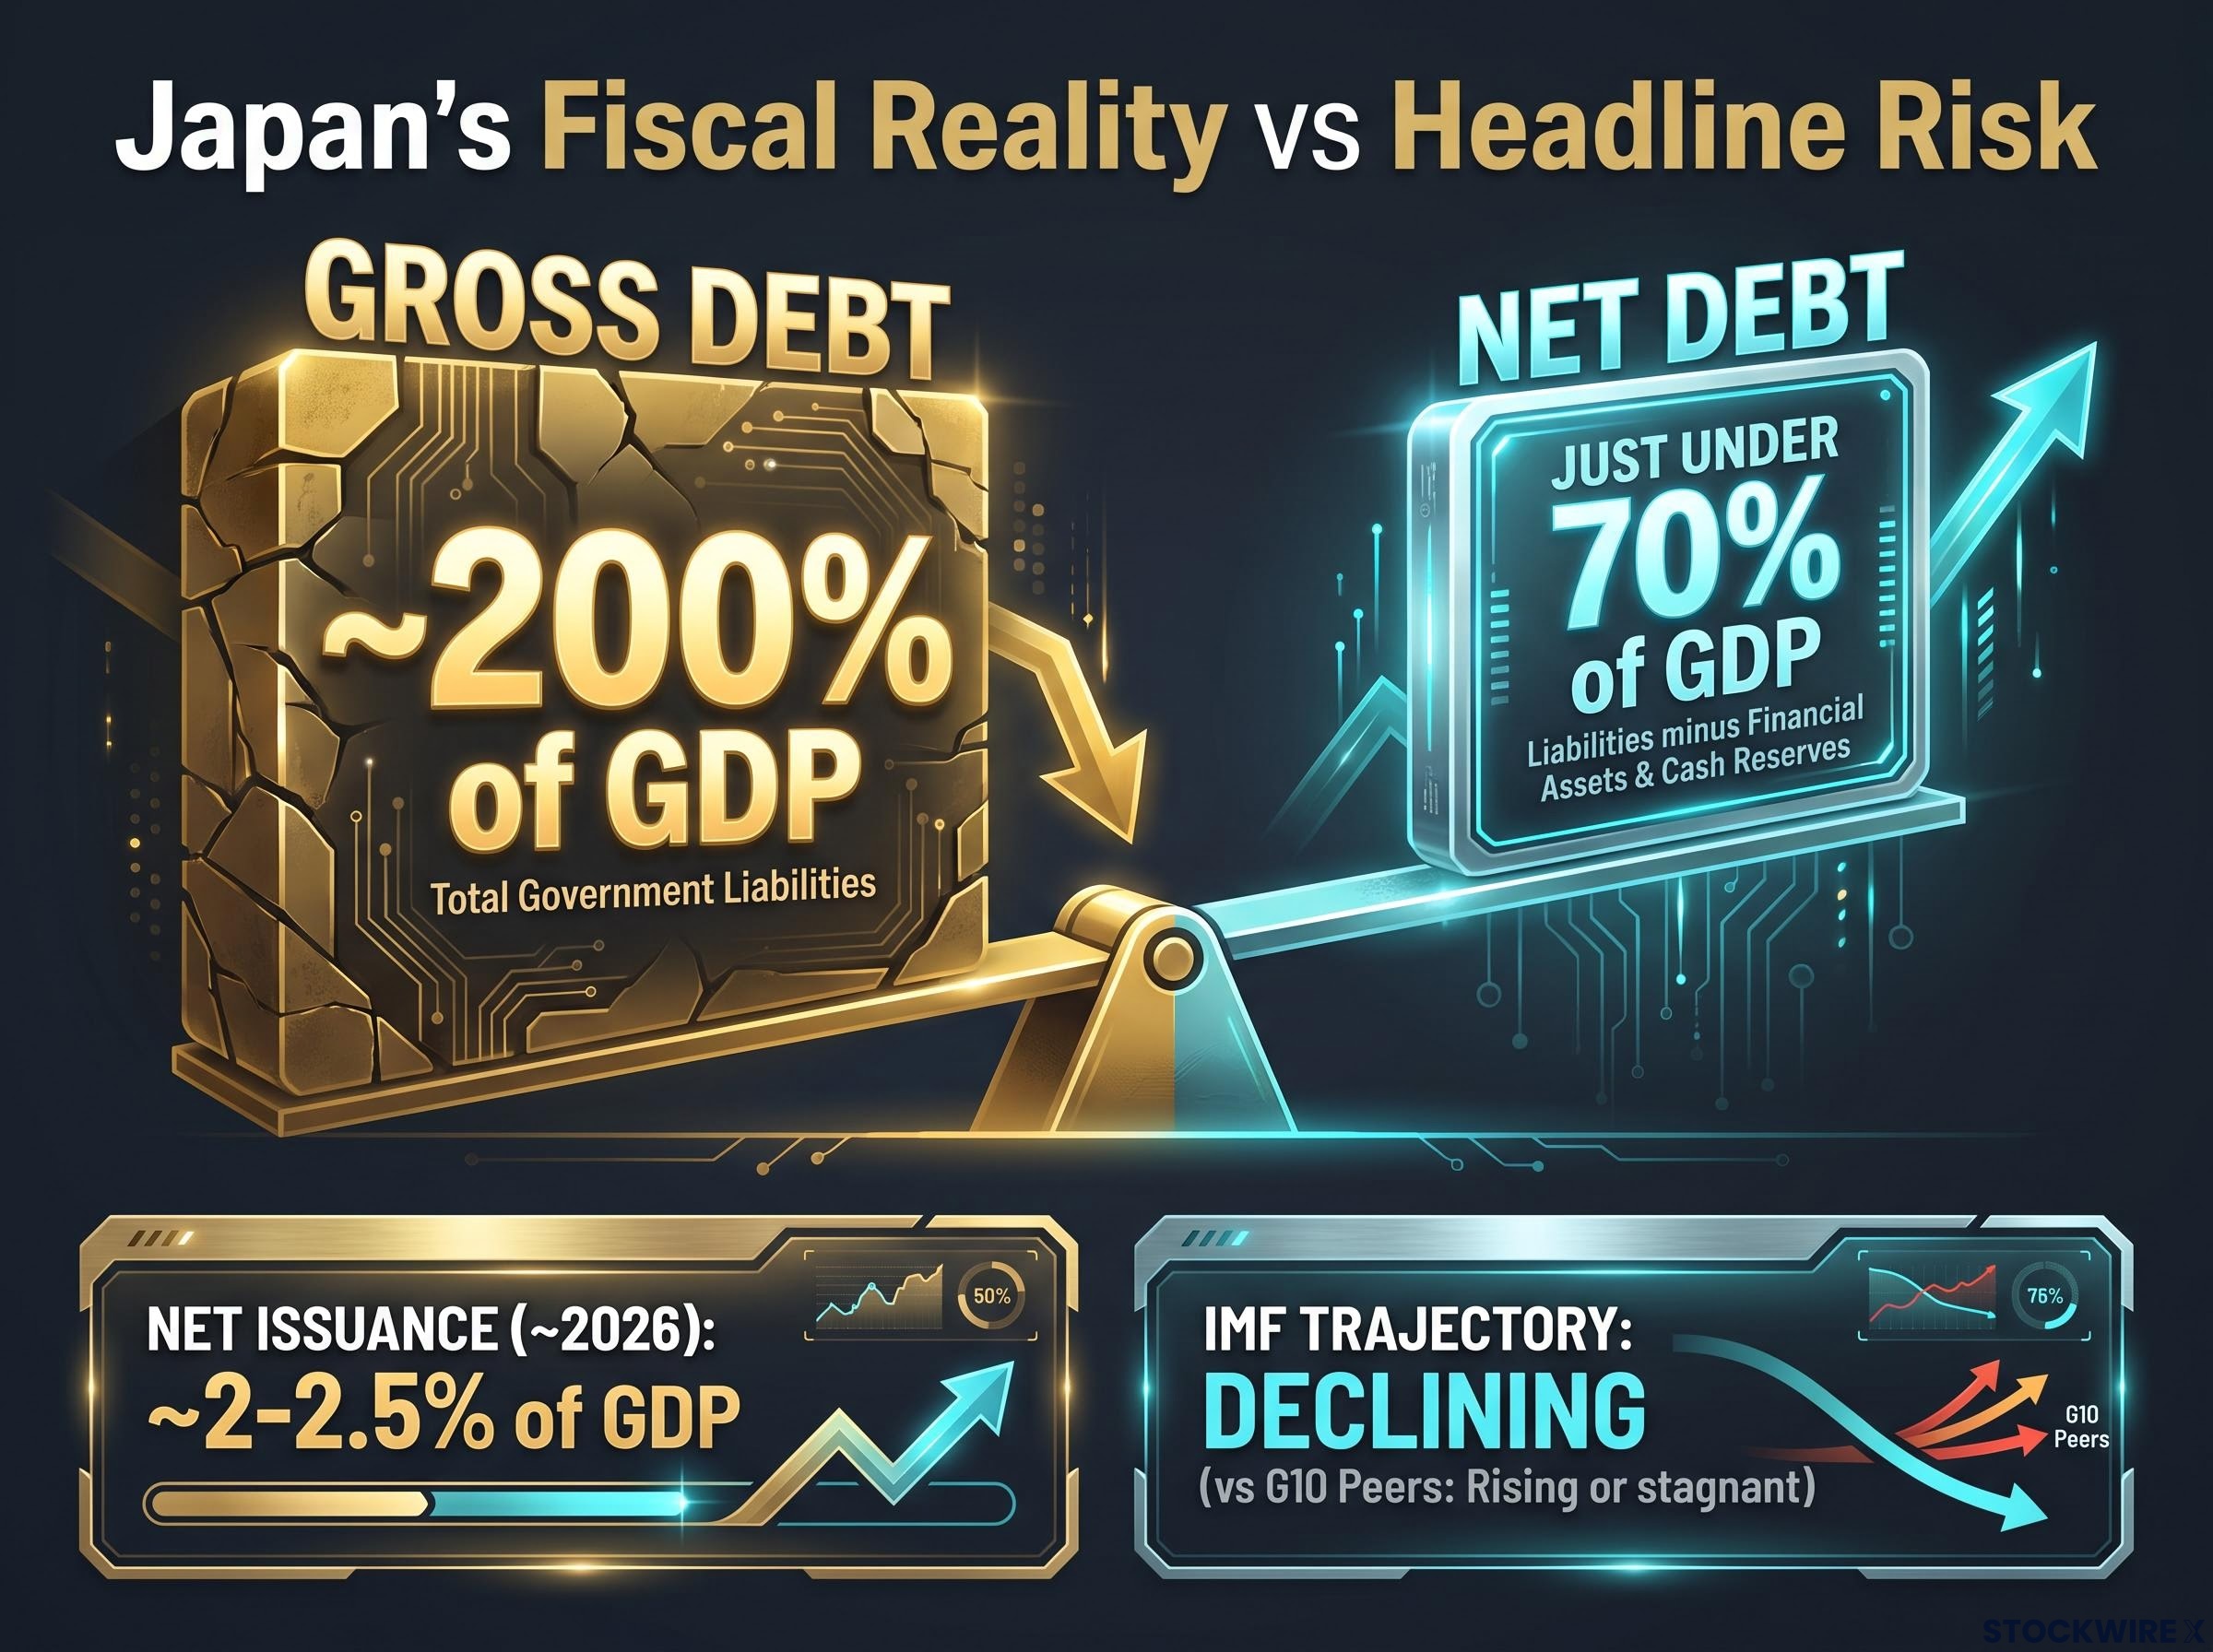
The distinction between gross and net debt is where the reframing begins. Japan’s government holds substantial financial assets, including foreign reserves, pension fund assets, and other investments that partially offset the accumulated debt stock. Once those are deducted, the fiscal position looks materially less stressed.
The annual flow data reinforces this. Japan’s expected net new debt issuance around 2026 is approximately 2-2.5% of GDP, which compares favourably with most G10 peers. IMF projections show both gross and net debt on a declining trajectory, while U.S. and European peer debt is projected to rise or remain stagnant.
| Metric | Japan | G10 Peers (Direction) |
|---|---|---|
| Gross Debt (% of GDP) | ~200% | Varies; rising or stagnant |
| Net Debt (% of GDP) | Just under 70% | Generally higher than Japan’s net figure |
| Annual Net Issuance (% of GDP) | ~2-2.5% | Generally higher |
| IMF Debt Trajectory | Declining | Rising or stagnant |
For readers who have been avoiding yen-positive positions because of Japan’s debt headlines, the net debt and trajectory data suggest the fiscal risk is less acute than gross figures imply. Rising JGB yields, in this context, are better read as normalisation accompanying healthier nominal growth, not as a sovereign risk premium expanding.
The JGB yield trajectory from 0.2% in early 2022 to approximately 2.7% by July 2026 has simultaneously expanded megabank net interest margins and introduced duration risk for regional lenders with concentrated long-duration holdings, creating a sector-level divergence that the aggregate fiscal narrative obscures.
What strong nominal growth does for Japan’s fiscal and monetary outlook simultaneously
Nominal GDP growth at approximately 5.1% SAAR in Q2, up from 3.9% in Q1, is the single figure that ties the fiscal and monetary stories together. It does not just support the BoJ’s case for continued normalisation; it simultaneously improves Japan’s fiscal sustainability. The connection runs through three channels:
- Tax base expansion: A wider nominal income base generates greater tax receipts automatically, without requiring any adjustment to tax rates, which strengthens the government’s overall fiscal position
- Debt-to-GDP denominator effect: When nominal GDP grows faster than the debt stock, the debt-to-GDP ratio falls mechanically, which is precisely what IMF projections anticipate for Japan
- Fiscal deficit containment: Higher revenues reduce the need for large deficit financing, reinforcing Commerzbank’s argument that annual borrowing is relatively contained despite the large accumulated stock
The GDP deflator at 4.0% annualised is the inflation component underpinning this nominal expansion. Together, these dynamics create a feedback loop: inflation sustains nominal growth, nominal growth improves fiscal metrics, and improved fiscal metrics give the BoJ more room to normalise without triggering fears that rate hikes will cause a fiscal crunch.
For readers assessing whether the BoJ can sustain its tightening path, the Q2 nominal growth acceleration is the most important reassurance in the data. It shows the growth and fiscal narratives are reinforcing rather than in tension, which is why Commerzbank’s yen bullish thesis holds even with a September hold decision.
Five signals that will determine whether the yen appreciation thesis holds
The analytical framework above gives you the processing layer. These five signals are the inputs that will confirm or challenge the thesis with each new data release:
- BoJ forward guidance and meeting minutes. A confirming read: explicit signals of the next rate hike timeline, or acceleration of ETF and J-REIT sales. A deteriorating read: dovish pivot language, extended guidance suggesting an indefinite pause, or delays to balance sheet reduction.
- Core CPI and wage settlement data. Confirming: core CPI holds well above 2% and wage settlements remain robust, validating the deflator’s inflation signal. Deteriorating: CPI declines toward 2% or below, or wage growth moderates significantly, undermining the durable inflation thesis.
- JGB yield behaviour. Confirming: gradual, orderly yield increases alongside healthy nominal growth, consistent with normalisation. Deteriorating: disorderly spikes that signal market stress rather than orderly adjustment, which would challenge the benign fiscal view.
Rising JGB yields are the most counterintuitive signal in this framework. Gradual increases are a sign of normalisation, not distress. Only disorderly spikes would challenge the thesis, and the distinction between the two determines whether the fiscal narrative holds.
- Takaichi administration fiscal decisions. Confirming: disciplined relief spending and VAT policy that maintains the relatively small deficit position. Deteriorating: large supplementary budgets or tax cuts that materially expand the deficit and undermine the “debt fears overstated” narrative.
- U.S. Federal Reserve rate cut pace. Confirming: faster Fed cuts narrow the rate differential that sustains yen carry trades, accelerating yen support. Deteriorating: the Fed holds or slows cuts, preserving a wide differential that keeps short-yen positions attractive.
Reading the BoJ’s next move before the market does
The Q2 data confirmed durable inflation through the deflator overshoot. The September meeting confirmed balance sheet tightening is already underway. The net debt picture, according to Commerzbank’s Baur, is materially better than gross headlines suggest. And nominal growth is accelerating in a way that supports both the fiscal and monetary narratives simultaneously. Taken together, these layers point to a medium-term environment where yen-negative carry trade assumptions need active reassessment.
That does not mean a straight line. Global risk sentiment shifts, the pace of U.S. rate cuts, fiscal decisions under the Takaichi administration, and the lingering effect of prior intervention activity that has made markets cautious about aggressive yen longs all complicate the path. The five signals from the preceding section are the inputs to monitor. The analytical architecture from this piece is the processing layer. Together, they give you a framework for reading BoJ timing and yen direction that updates with each data release, rather than one that needs rebuilding from scratch.
For investors tracking how the BoJ’s forward guidance evolved after the September 2025 framework, the BoJ July 2026 hold decision covers how energy subsidy-driven CPI suppression, a named dissenter pushing for an immediate hike to 1.25%, and a U.S. Treasury rate check each reshaped the policy calculus.
This article is for informational purposes only and should not be considered financial advice. Investors should conduct their own research and consult with financial professionals before making investment decisions. Forward-looking statements regarding BoJ policy, yen direction, and fiscal trajectories are speculative and subject to change based on market developments and policy decisions.