Why AI Infrastructure, Not Chips, Is Where Durable Value Sits
25 mins ago

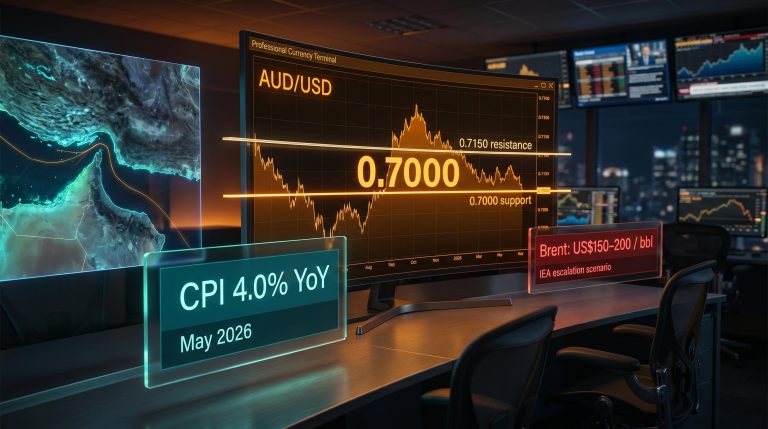
Two basis points. That is the entire margin separating the 30-year US Treasury yield from the level Bank of America’s chief strategist calls the “Maginot Line” for global markets.
The May 1, 2026 edition of BofA’s weekly Flow Show, authored by Michael Hartnett, landed alongside one of the most data-dense weeks in recent memory: $23 billion into equities, $29.5 billion out of cash, and the largest single-week exodus from China equities since January 2026 occurring in the same seven days as Japan’s biggest equity inflow since 2013. This is a market in active repositioning, not passive drift. What follows is a breakdown of every major flow figure from the report, Hartnett’s “boom loop” macro thesis, and what these institutional moves signal about risk appetite, geographic conviction, and the danger zones forming beneath the surface.
$29.5 billion left cash in a single week, the clearest signal that institutional capital is no longer waiting on the sidelines.
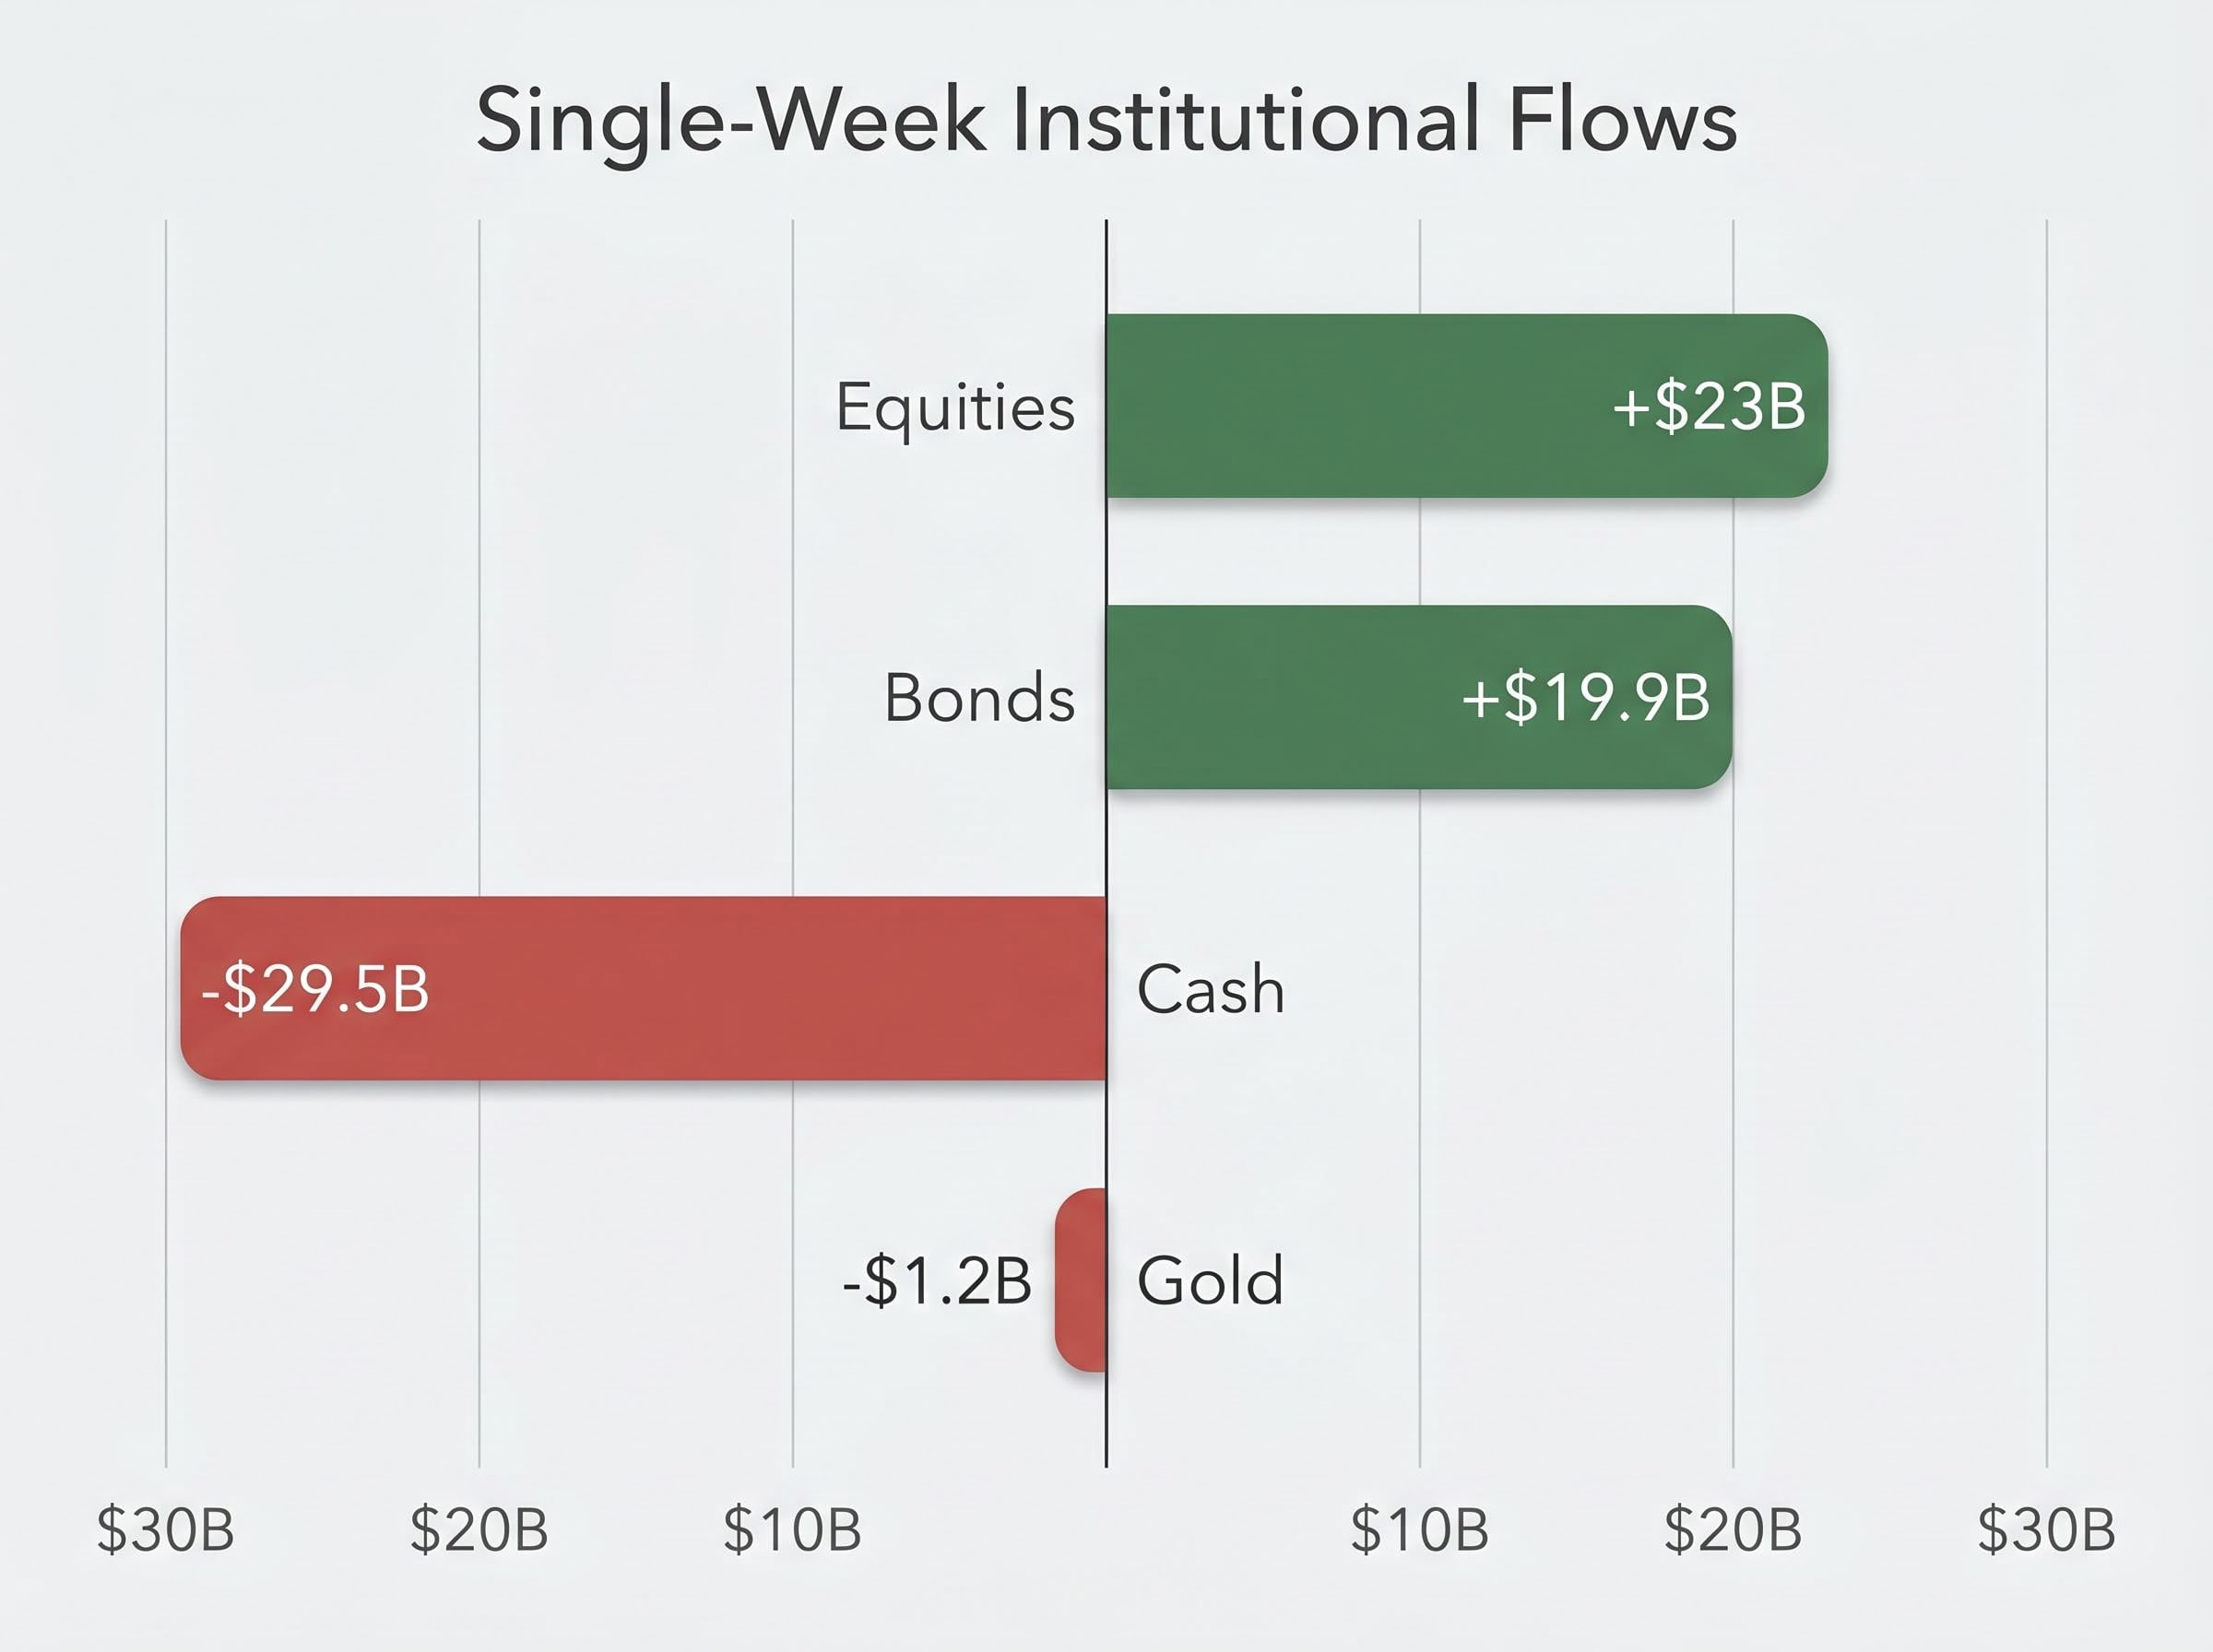
The cash outflow and the $23 billion equity inflow are two sides of the same trade. Capital did not trickle out of money markets; it moved with conviction, and it moved broadly. US equities absorbed $19.3 billion of the total, with inflows concentrated in large-cap names for a fifth consecutive week.
The destination was not limited to stocks. Bonds drew $19.9 billion in the same period, extending an inflow streak to 53 consecutive weeks. Investment-grade credit alone attracted $8.8 billion, the largest weekly haul in eight weeks. Gold, by contrast, recorded $1.2 billion in outflows, the first redemption in six weeks.
The simultaneous move into both equities and fixed income complicates any simple “risk-on” reading. This was broad-based capital deployment, not a one-directional bet.
Fixed income alternatives remain constrained for income-seeking capital: international developed markets currently trade at approximately 15x price-to-earnings versus 20x and above for US equities, which partly explains why bond inflows have sustained for 53 consecutive weeks even as the yield curve steepens and long-duration risk builds.
| Asset Class | Direction | Amount | Notable Context |
|---|---|---|---|
| Equities | Inflow | $23B | US large caps led; fifth consecutive week |
| Bonds | Inflow | $19.9B | 53rd consecutive week; IG credit $8.8B |
| Cash | Outflow | $29.5B | Largest single driver of the week’s rotation |
| Gold | Outflow | $1.2B | First outflow in six weeks |
| EM Debt | Inflow | $3.6B | Third consecutive week of inflows |
The Flow Show is a weekly publication from BofA Global Research, authored by Michael Hartnett, that aggregates fund flow data across asset classes and geographies. It tracks where money is actually moving, not where analysts predict it will move. That distinction matters: the report is a behavioural tool, capturing institutional action rather than forecasting intent.
Institutional traders read it every week because the data reveals positioning shifts before they show up in price. When $29.5 billion exits cash in a single week, the Flow Show captures that movement in near-real time.
BofA’s proprietary Bull and Bear Indicator is a composite sentiment gauge that synthesises credit spreads, sector-level flows, and positioning in volatility instruments into a single reading. This week, the indicator rose to 6.6, up from 6.3. Three factors drove the increase:
A reading above 8 would trigger a contrarian sell signal. A reading below 2 would trigger a contrarian buy signal. At 6.6, the indicator sits in neutral territory, suggesting neither complacency nor panic, consistent with a market absorbing large but orderly capital movements.
Japan drew $6.7 billion into equities in a single week, the largest inflow for that market since May 2013. That is not a routine allocation shift. It is the kind of historically notable institutional commitment that signals a structural conviction forming around Japanese assets.
Japan’s $6.7 billion equity inflow was the largest since May 2013, marking the most significant institutional commitment to Japanese equities in over a decade.
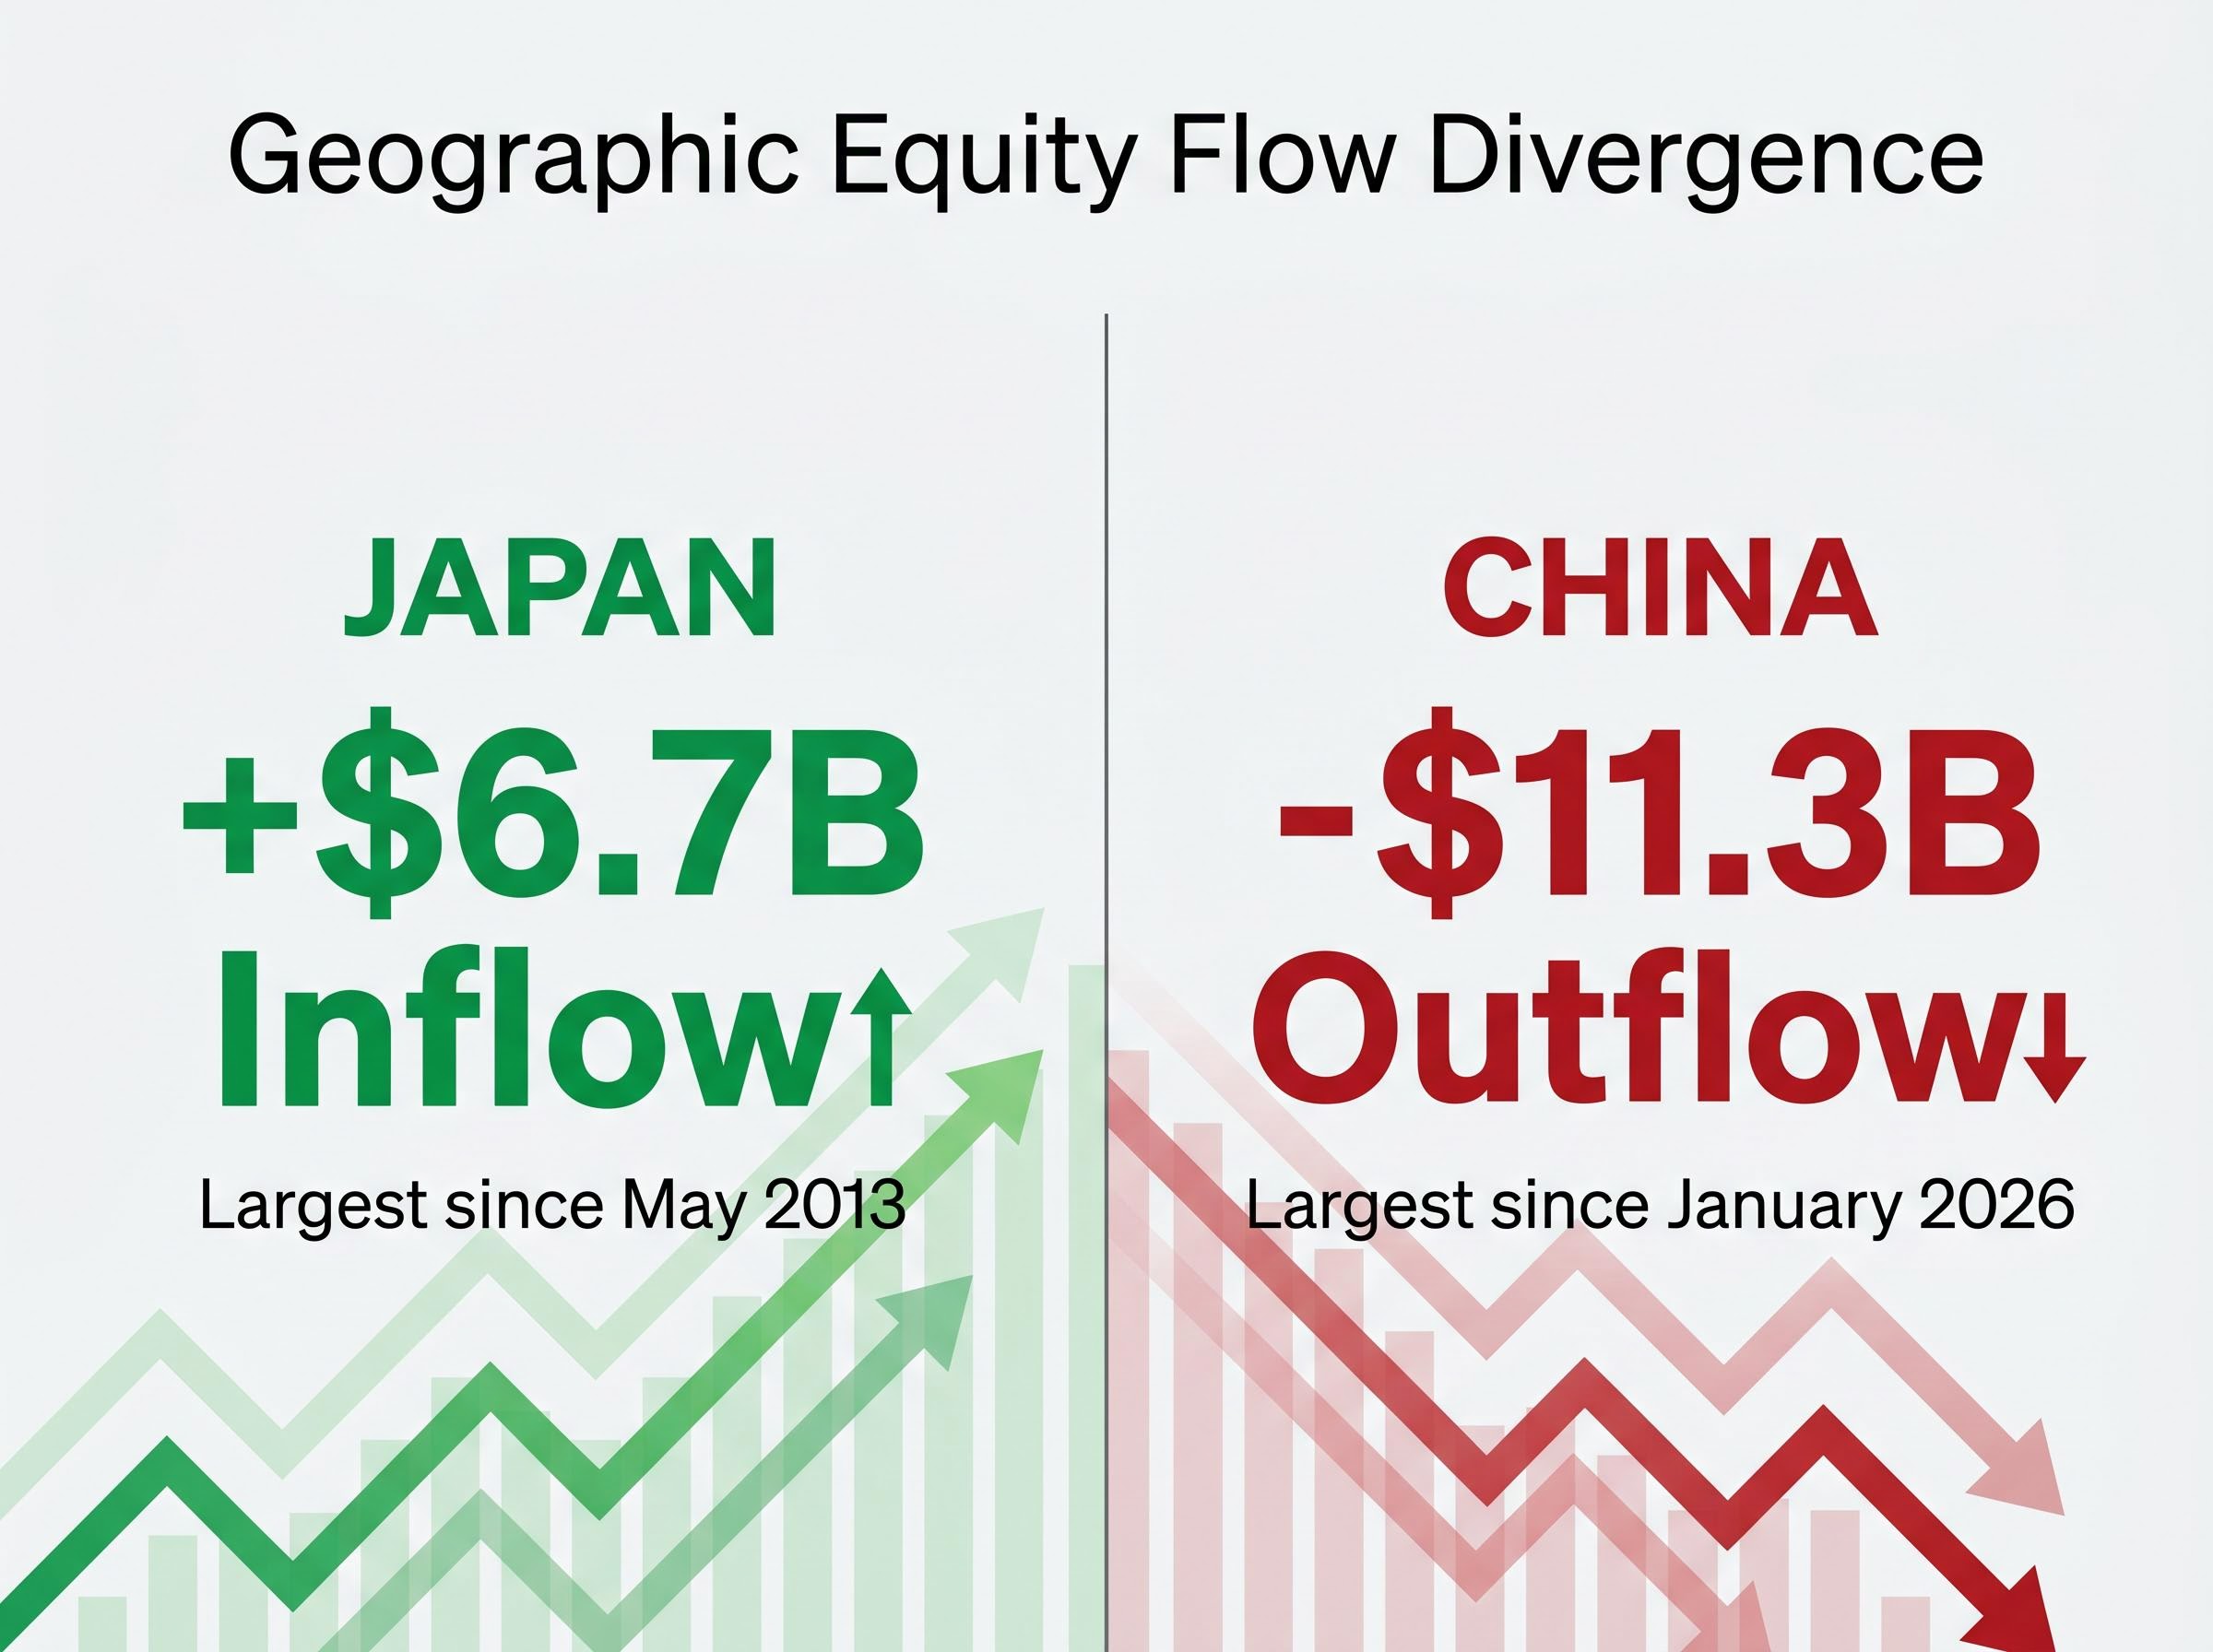
Then the other side of the ledger: China equities recorded $11.3 billion in outflows, the largest exodus since January 2026. The contrast is stark. In the same week that capital flooded into Tokyo, it left Beijing at pace.
The tension sharpens further when set against Hartnett’s own positioning. He lists China among his preferred trades (the “Cs”), suggesting the outflow may represent short-term capital flight rather than a long-term institutional rejection of the market. Emerging market debt inflows of $3.6 billion for a third consecutive week reinforce this nuance; developing markets are not uniformly unwanted.
| Region | Flow Direction | Amount | Historical Context |
|---|---|---|---|
| Japan | Inflow | $6.7B | Largest since May 2013 |
| China | Outflow | $11.3B | Largest since January 2026 |
| US Equities | Inflow | $19.3B | Fifth consecutive week; large-cap led |
The boom loop is not a buzzword. It is a specific causal chain. Maximum government spending drives nominal GDP growth, which inflates corporate earnings and commodity prices while pressuring bonds through a steepening yield curve and weakening the dollar.
The spending data grounds the thesis. US government expenditure has risen approximately 60% since 2020 and is projected to grow an additional 15% in the FY2027 budget. The GDP trajectory follows: nominal GDP has grown an estimated 75% over seven years, from roughly $20 trillion at the 2020 pandemic trough toward a projected $35 trillion by 2027.
“Stocks and commodities love nominal booms; bonds (steeper curve) and U.S. dollar not so much.” Michael Hartnett, BofA Global Research
This framework explains why both stocks and bonds attracted capital simultaneously this week. Equities benefit from inflated earnings. Bonds, despite long-term pressure from curve steepening, still draw inflows at current yields because income-seeking capital has few alternatives at 53 weeks of consecutive demand.
The boom loop’s winners and losers, according to Hartnett:
The 30-year US Treasury yield closed at approximately 4.986% on the session prior to the report, opened at 4.977%, and sits at roughly 4.98% as of May 1, 2026. Hartnett’s named threshold is 5.0%.
The margin is approximately two basis points.
The FRED 30-year Treasury yield series maintained by the Federal Reserve Bank of St. Louis provides the historical constant maturity data that contextualises how rarely the 30-year has held this close to 5% for this long, making the current proximity to Hartnett’s threshold all the more striking.
Michael Hartnett identifies the 5% level on the 30-year Treasury as the “Maginot Line,” warning that a breach could “open the door to doom for markets.”
The label carries weight because of where it sits in historical precedent. Late-cycle yield surges have marked the end of major asset booms before, and the pattern is consistent across geographies and decades.
| Era | Country | Yield Surge (bps) | Event Marked |
|---|---|---|---|
| 1989 | Japan | 230 | End of the Japanese asset bubble |
| 1999 | United States | 260 | End of the dot-com boom |
| 2007 | China | 150 | End of the pre-crisis growth cycle |
Each of those surges preceded a period of severe asset repricing. The 30-year yield has not breached 5%, but the proximity is the point. Two basis points is not a buffer; it is a rounding error.
Hartnett’s forward positioning distils into what he calls the “Cs”:
The China recommendation creates a deliberate tension with this week’s data. Institutions pulled capital at the sharpest rate since January 2026, yet BofA’s chief strategist holds the market as a preferred allocation. That gap between short-term flows and longer-term positioning is itself a signal worth monitoring.
At 6.6, the Bull and Bear Indicator places institutional sentiment in neutral territory. The three drivers of the recent rise from 6.3, tighter credit spreads, tech inflows, and bullish gold and VIX positioning, reflect constructive but not euphoric conditions.
If the indicator continues climbing toward 8 without a pullback, contrarian caution would apply. At current levels, the reading suggests the market retains institutional headroom for further positioning before a crowding signal triggers.
Investors who want the fuller picture on how these institutional flows intersect with macro vulnerabilities will find our full explainer on underpriced stock market risk examines how the S&P 500 hitting its 2026 year-end target in April, combined with rising retail optimism and Strait of Hormuz oil disruption, has created a structural mismatch between equity valuations and the geopolitical risks embedded in forward earnings estimates.
This article is for informational purposes only and should not be considered financial advice. Investors should conduct their own research and consult with financial professionals before making investment decisions. These statements are speculative and subject to change based on market developments and company performance.
Capital is flowing. Sentiment is constructive. The boom loop framework explains the structural forces behind both. But the 30-year yield at 4.98% sits at the edge of the threshold that Hartnett’s own model identifies as the boom’s breaking point.
The Flow Show is a behavioural data source. It shows where money has moved, not where it will go. The reader’s task from here is straightforward: monitor the 30-year Treasury yield weekly alongside subsequent Flow Show releases. If the boom loop holds, the fiscal engine keeps running. If 5% breaks, Hartnett’s own framework suggests the rules change for every asset class on the board.
—
The BofA Flow Show is a weekly publication from BofA Global Research, authored by Michael Hartnett, that aggregates real fund flow data across asset classes and geographies. Investors follow it because it captures where institutional money is actually moving, often before those shifts appear in market prices.
Michael Hartnett uses the term Maginot Line to describe the 5% level on the 30-year US Treasury yield, warning that a breach above that threshold could open the door to a severe repricing across asset classes. As of the May 1, 2026 Flow Show, the 30-year yield sat at approximately 4.98%, just two basis points below that level.
A Bull and Bear Indicator reading of 6.6 places institutional sentiment in neutral territory, well below the contrarian sell signal that triggers above 8 and well above the contrarian buy signal that triggers below 2. At this level, the market is considered constructive but not euphoric, suggesting institutional headroom remains before crowding becomes a concern.
Japan attracted $6.7 billion in equity inflows during the week covered by the May 1, 2026 Flow Show, the largest single-week inflow for that market since May 2013. The scale of the move suggests institutional investors are forming a structural conviction around Japanese equities rather than making a routine allocation shift.
The boom loop thesis holds that maximum government fiscal spending drives nominal GDP growth, which inflates corporate earnings and commodity prices while pressuring bonds through a steepening yield curve and a weaker dollar. According to Hartnett, the primary beneficiaries are stocks, commodities, and semiconductors, while bonds and the US dollar face the greatest headwinds.