Why Social Media Stocks Are Mispricing Youth Litigation Risk
2 hrs ago

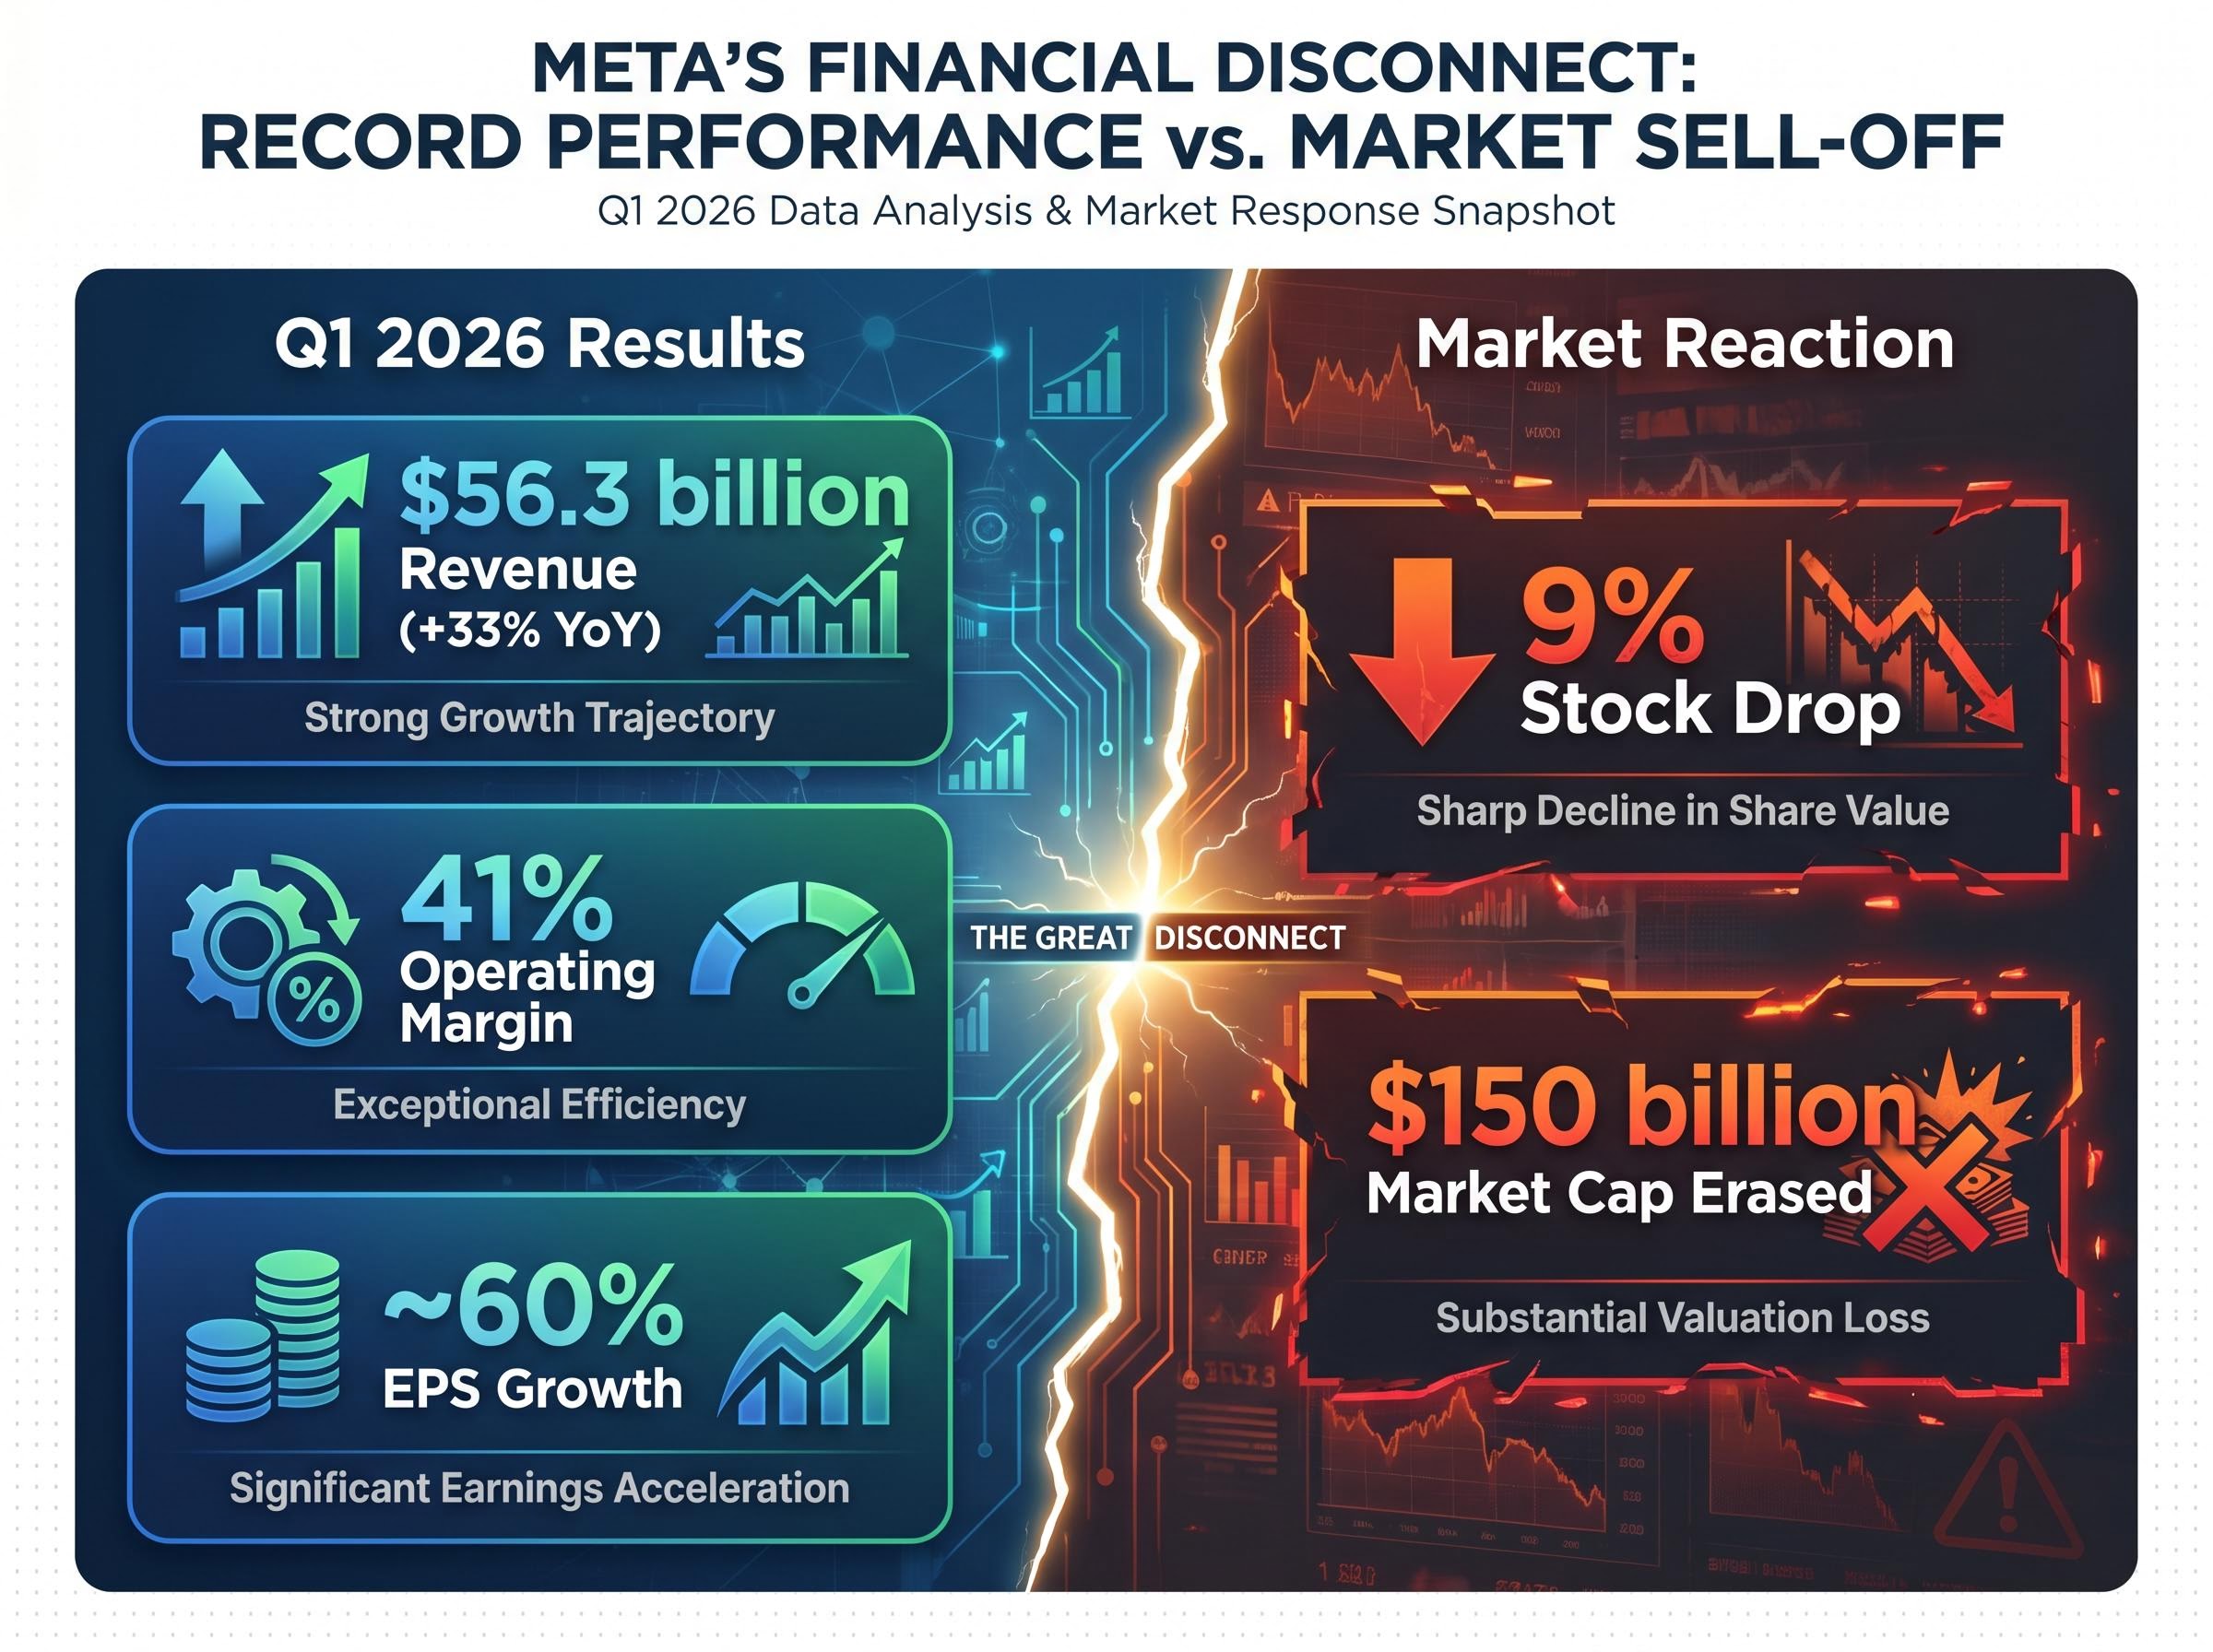
On 29 April 2026, Meta Platforms reported $56.3 billion in quarterly revenue, a 41% operating margin, and earnings per share growth of approximately 60% year over year. The stock fell roughly 9% in extended trading, erasing approximately $150 billion in market capitalisation overnight.
The reaction was not irrational. But understanding why it happened requires separating what Meta reported from what Meta committed to spending. What follows is a structured walk through both sides of that equation: the operating results that justified optimism, the capital expenditure revision that overwhelmed them, and the framework for reading an earnings reaction that appears to contradict the numbers underneath it. By the end, the picture includes competitive context, litigation risk that most post-earnings commentary has underweighted, and the valuation math from two distinct vantage points.
By any conventional measure, Meta’s Q1 2026 was an exceptional quarter. The headline metrics alone made the case:
User engagement hit all-time highs across both Instagram and Facebook daily and monthly active users. U.S. and Canada Facebook video watch time rose 9%.
Meta’s Q1 2026 investor relations filing confirms revenue of $56.311 billion alongside the revised capital expenditure range of $125-145 billion, providing the primary source documentation for the core financial data points examined throughout this analysis.
The simultaneous acceleration in both ad impression volume and average pricing is the analytically notable detail inside the revenue growth figure. When a platform expands supply (more impressions) and still sees pricing rise, it signals that advertiser demand is outpacing the supply increase, a combination that rarely persists for more than a few quarters.
Meta’s value optimisation ad product reached an annualised run rate of approximately $20 billion. The commerce-oriented partnership segment hit roughly $10 billion annualised, more than doubling year over year. The 41% operating margin is made more striking by the fact that it absorbed ongoing Reality Labs losses, meaning the core advertising business is running materially above that headline figure.
These are the results the market should have rewarded. It did not.
The selloff was not a response to what Meta earned. It was a response to what Meta committed to spend. The company raised its 2026 capital expenditure guidance to $125-$145 billion, up from a prior range of $115-$135 billion.
The trajectory of that spending tells the story more clearly than the point-in-time number.
| Period | Annual Capex | Approximate Change |
|---|---|---|
| Prior baseline | ~$40 billion | Baseline |
| Intermediate period | ~$72 billion | +80% |
| 2026 (midpoint) | ~$130 billion | +81% |
In Q1 2026 alone, contractual infrastructure commitments increased by approximately $17 billion. Total new contractual commitments over the following one to two years reached roughly $107 billion. Meta added approximately $50 billion in debt to its balance sheet. Share buybacks were paused during the quarter.
Meta’s CFO acknowledged on the earnings call that compute demand is scaling faster than anticipated. That qualitative admission, separate from the dollar figure itself, signalled to the market that even management’s own internal projections had underestimated AI infrastructure requirements.
The post-earnings decline of approximately 7-9% in extended trading erased roughly $150 billion in market capitalisation. The market was not punishing the quarter. It was repricing the forward commitment.
The disconnect between Meta’s Q1 results and the stock’s response follows a pattern that recurs regularly across high-growth equities. The mechanism has a name: guidance-driven repricing.
The logic moves in three steps:
This is not a fundamental re-rating, where the market concludes the business is worth less than previously estimated because the underlying economics have deteriorated. The Q1 results showed the opposite. It is a sentiment-driven adjustment: the risk profile shifted without the earnings quality changing.
The principle that forward guidance can override strong earnings beats played out across multiple stocks on the same day Meta reported, with Spotify falling 12-14% and Corning dropping approximately 9% despite both beating current-quarter estimates, confirming the framework was not a Meta-specific phenomenon.
The buyback pause and $50 billion debt addition function as interpretable signals about capital allocation priorities. Management chose to redirect free cash flow toward AI infrastructure rather than returning it to shareholders. Whether the capex itself is justified is a separate question from what the reallocation tells the market about near-term cash flow expectations.
The proportionality of the reaction is debatable. A $150 billion market cap decline on a quarter that beat expectations arguably prices in a worst-case capex scenario rather than the midpoint. The framework, however, explains why the direction of the move was down rather than up.
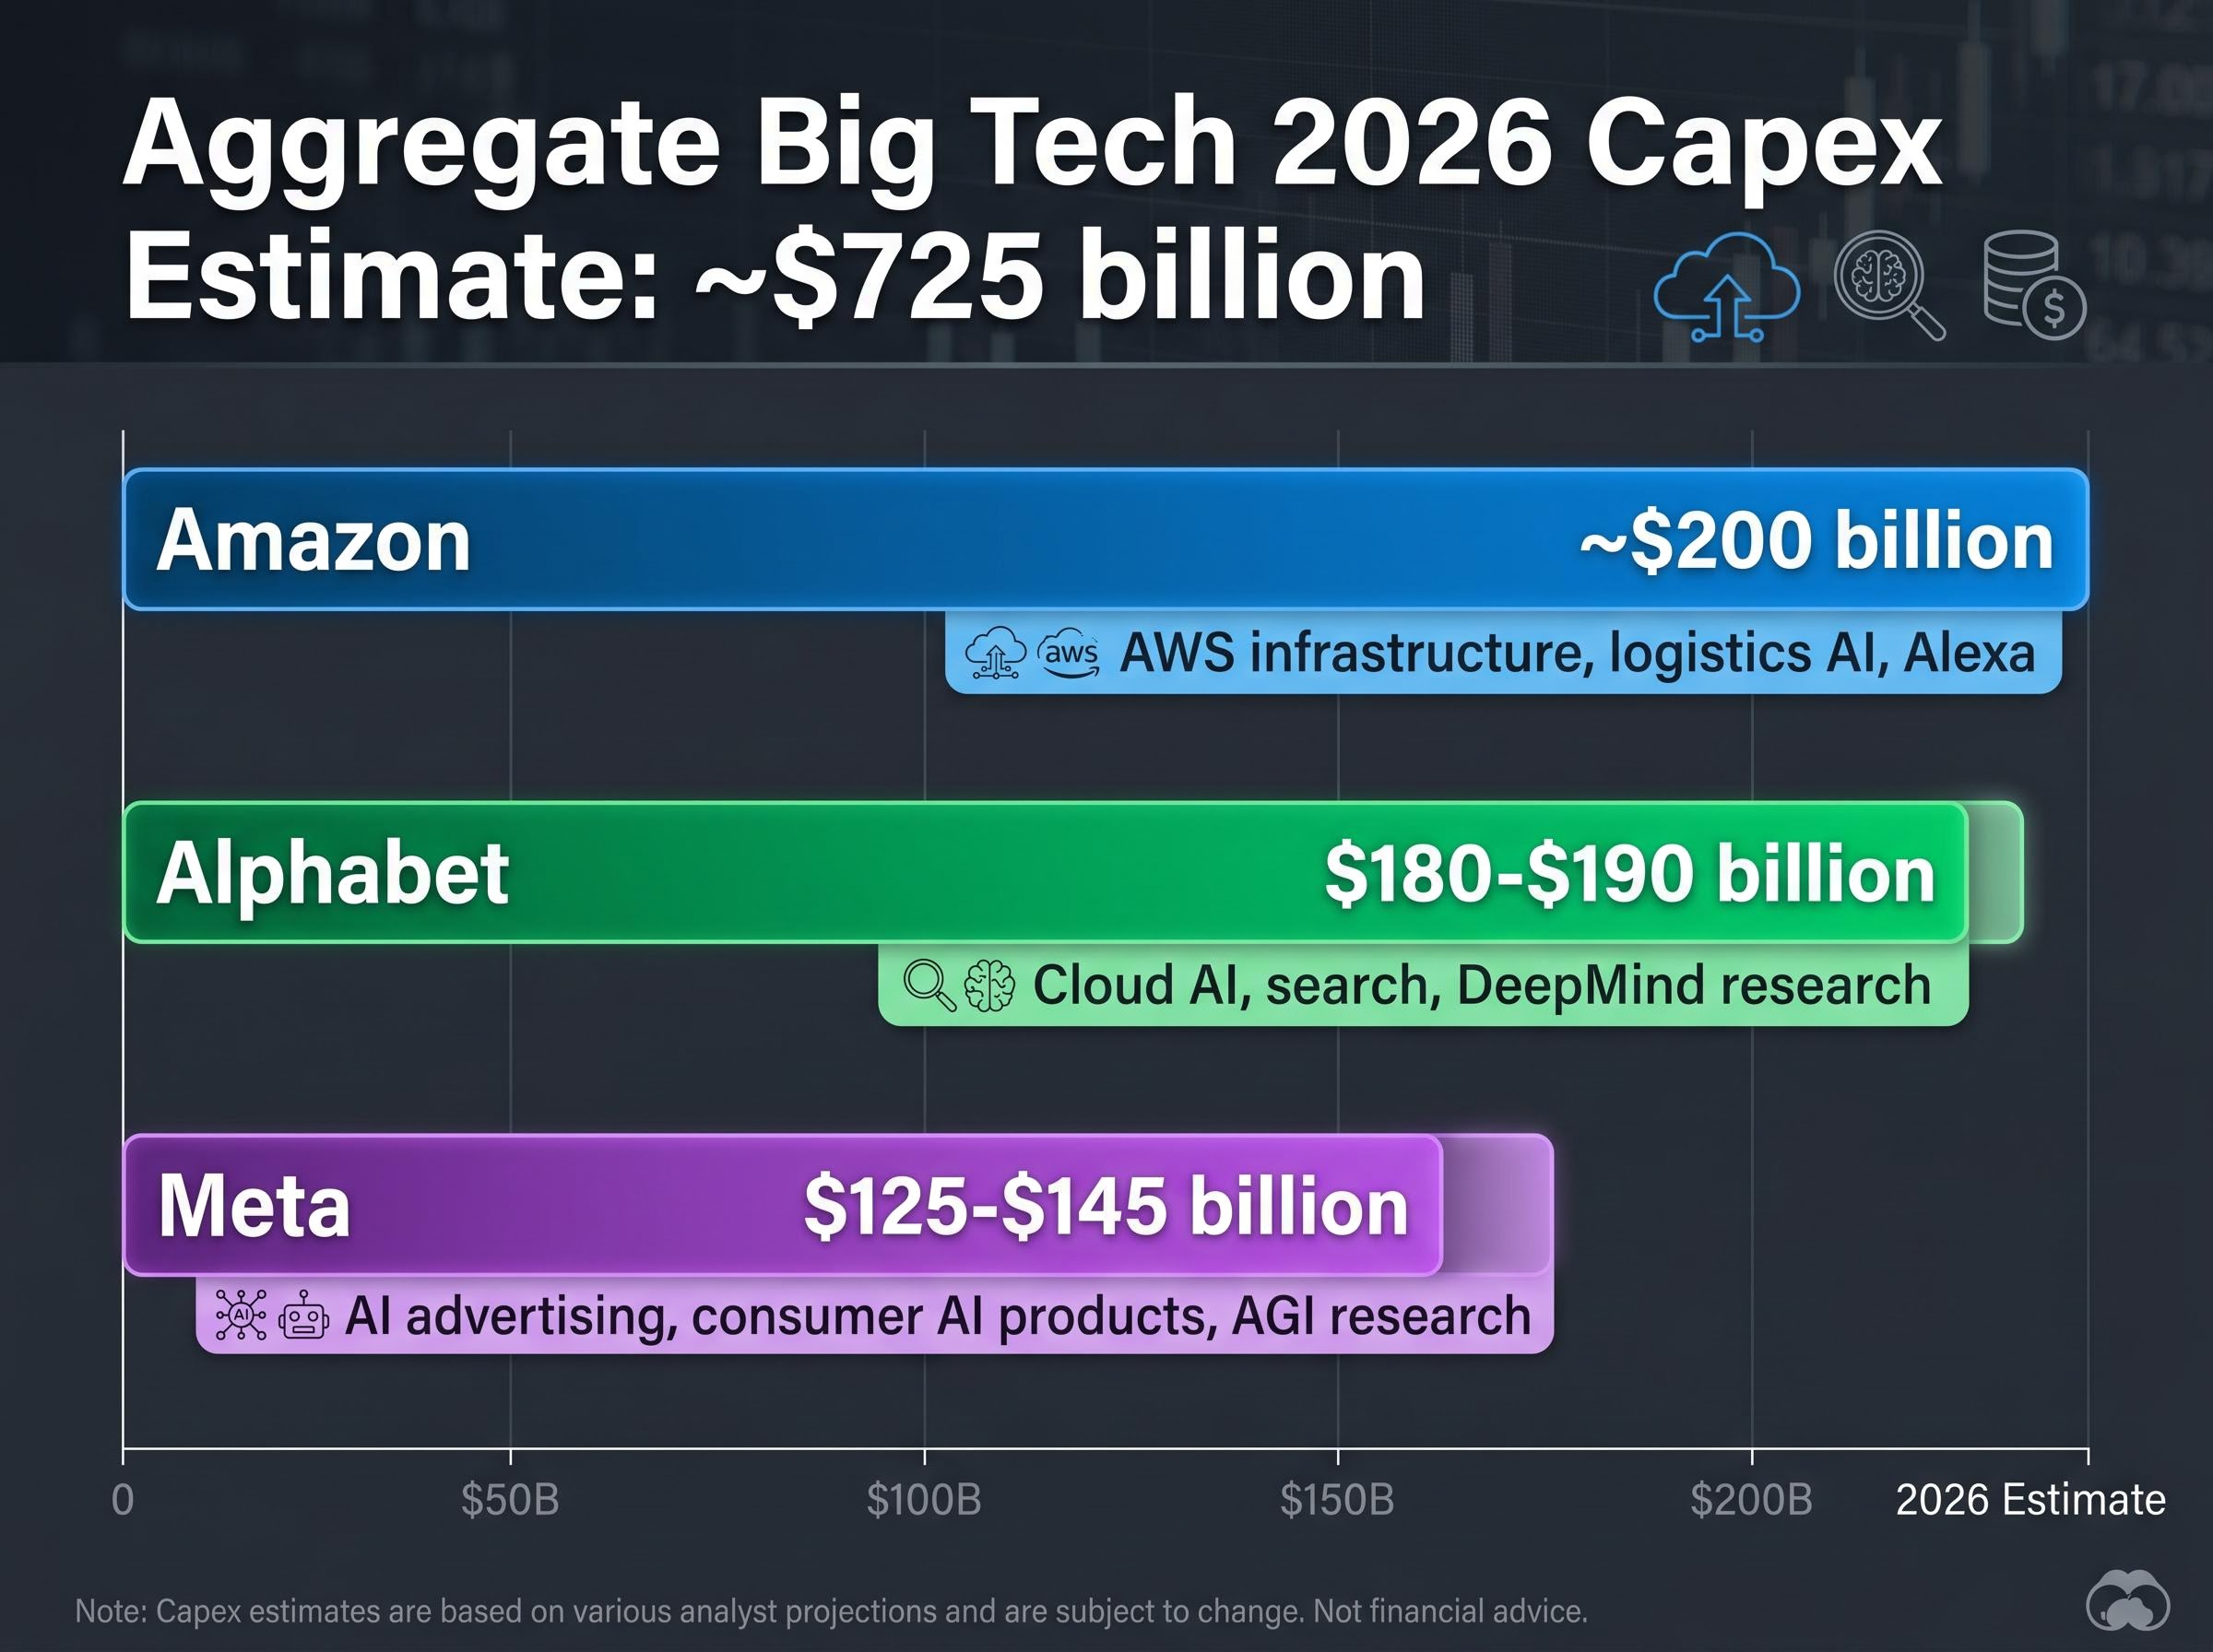
Meta’s capex figure, in isolation, appears aggressive. In context, it sits below its two closest peers.
| Company | 2026 Capex Estimate | Primary AI Investment Focus |
|---|---|---|
| Meta | $125-$145 billion | AI advertising, consumer AI products, AGI research |
| Alphabet | $180-$190 billion | Cloud AI, search, DeepMind research |
| Amazon | ~$200 billion | AWS infrastructure, logistics AI, Alexa |
Aggregate Big Tech capex for 2026 is estimated at approximately $725 billion. Meta’s share of that figure is proportional to its revenue base.
What Meta is specifically building toward already shows traction in operating metrics:
Meta’s structural differentiator is distribution. With more than 3 billion users across its family of apps, the AI investment is not a pure research bet. The delivery infrastructure already exists. Compare that positioning to OpenAI, which carries a private valuation of approximately $800-$900 billion without a comparable owned-distribution layer. Meta’s market capitalisation of approximately $1.5 trillion prices in a business that already monetises AI at scale.
Alphabet’s divergent reaction on the same day, a 7% surge to an all-time high on the back of 81% net income growth and 63% Google Cloud revenue growth, illustrates precisely why the market is no longer treating AI infrastructure spending as a single unified trade but is instead pricing each hyperscaler’s capex-to-revenue conversion speed individually.
The capex debate has dominated post-earnings commentary, but it may not represent the least understood risk on Meta’s balance sheet. Three distinct risk categories deserve separate treatment:
The litigation front is expanding rather than resolving. A $375 million verdict was issued against Meta in New Mexico for child safety failures. A Massachusetts lawsuit against Instagram for public nuisance related to youth harm is advancing. Reuters reported on approximately 10 April 2026 that Meta pulled ads recruiting plaintiffs for social media addiction lawsuits, drawing attention to the breadth of pending claims.
Power grid constraints represent one of the most concrete physical limits on how quickly any hyperscaler can deploy approved capex budgets, with data centres projected to consume 9% of US domestic electricity by 2030, up from 4% in 2023, a structural bottleneck that affects the timeline between capital commitment and productive capacity.
Bloomberg Law reporting on the Massachusetts ruling confirmed the state Supreme Judicial Court’s decision that the case could proceed, a significant procedural threshold that moves the litigation from speculative exposure to an active liability with discoverable financial dimensions.
On the Q1 2026 earnings call, Meta acknowledged that youth litigation could have a material impact on its financial statements. Management disclosure of this kind elevates the risk from analyst speculation to a formally recognised contingency.
Speculative settlement ranges cited in analysis span $5-$50 billion, though no official figure has been confirmed. The capex risk is large and visible. The litigation risk is harder to quantify, which is precisely why it may be harder to price accurately.
At approximately $610 per share following the earnings reaction, the valuation case for Meta depends heavily on which assumptions an investor selects.
Analysts estimate that the family of apps segment trades at approximately 16 times earnings at the post-earnings price, assigning zero value to Reality Labs. Two scenarios illustrate the range of outcomes.
| Scenario | Revenue Growth | Earnings Multiple | ~5-Year Return |
|---|---|---|---|
| Conservative | ~8% annually | 15x | ~7% annually |
| Base-to-optimistic | Low-to-mid teens | 20-25x | ~100-300% cumulative |
The conservative scenario assumes revenue growth decelerates sharply from the 33% reported in Q1 to roughly 8% over five years, applies a compressed 15x multiple, and discounts free cash flow by approximately 50% for capex absorption. Even under those assumptions, the projected annual return is roughly 7%.
The base-to-optimistic path assumes low-to-mid teens revenue growth, a 20-25x multiple reflecting successful AI monetisation, and a more moderate free cash flow discount. Projected cumulative returns under this scenario range from approximately 100% to 300% over five years.
Pershing Square founder Bill Ackman has reportedly allocated approximately 10% of his fund to Meta shares, characterising the stock as attractively valued at post-earnings levels. This perspective is notable as a data point for investor sentiment rather than a recommendation.
Analyst consensus remains “Moderate Buy” with average price targets in the $839-$844 range, implying meaningful upside from $610. Conservative full-year 2026 revenue growth estimates of 20-30% sit below the Q1 run rate of 33%, suggesting the consensus already embeds some deceleration.
This article is for informational purposes only and should not be considered financial advice. Investors should conduct their own research and consult with financial professionals before making investment decisions. Financial projections are subject to market conditions and various risk factors.
Two interpretations compete. The overreaction case rests on strong fundamentals, industry-consistent capex, a 16x family of apps earnings multiple, and a consensus price target roughly 38% above the post-earnings price. Seeking Alpha post-earnings commentary characterised the market reaction as irrational, a view broadly consistent with the analyst consensus.
The re-rating case rests on capex execution risk, the return-on-investment timeline for AI infrastructure, litigation exposure that management itself has flagged as potentially material, and compressed near-term free cash flow from the buyback pause and debt addition.
The weight of institutional evidence favours the overreaction interpretation, contingent on continued AI monetisation execution. The re-rating view gains credibility if Q2 revenue growth decelerates meaningfully from 33%, if the next earnings call revises capex guidance upward again, or if the Massachusetts or New Mexico litigation trajectories produce larger financial exposure than current estimates embed.
The forward data points worth monitoring:
The framework from earlier in this analysis applies directly. The market moved on forward commitments, not trailing results. Whether it moved too far depends on data that has not yet arrived.
For investors who hold Meta through passive index exposure rather than individual stock positions, our full explainer on index concentration risk examines how the Magnificent Seven’s 33.7% weighting in the S&P 500 by April 2026 creates asymmetric volatility in cap-weighted benchmarks and why a 9% decline in a single constituent can produce index-level effects that passive investors often underestimate until they appear in quarterly statements.
Meta's stock fell roughly 9% in extended trading not because of weak results, but because the company raised its 2026 capital expenditure guidance to $125-145 billion, compressing expected future free cash flow and triggering a forward-looking repricing by the market.
Guidance-driven repricing occurs when strong trailing earnings are overshadowed by forward spending commitments that reduce expected future cash flows; in Meta's case, $107 billion in new contractual obligations and a paused buyback programme shifted the market's cash flow outlook despite a 60% EPS growth print.
Meta's $125-145 billion 2026 capex estimate sits below both Alphabet (approximately $180-190 billion) and Amazon (approximately $200 billion), placing Meta's AI infrastructure spend at a proportional level relative to its revenue base within the hyperscaler peer group.
Beyond the capex debate, Meta faces platform liability lawsuits including a $375 million verdict in New Mexico and an advancing Massachusetts public nuisance case related to youth harm on Instagram, with management formally acknowledging on the Q1 2026 earnings call that this litigation could have a material financial impact.
Following the post-earnings decline to approximately $610 per share, analyst consensus remains a Moderate Buy with average price targets in the $839-$844 range, implying roughly 38% upside from the post-earnings price level.