
Why Imugene’s Fast Track Win in Marginal Zone Lymphoma Matters
47 mins ago

The S&P/ASX 200 Information Technology Index shed 48% of its value between late August 2025 and late March 2026, one of the sharpest sector-level selloffs in recent ASX history. Yet within that same window, one stock rose 242%. The gap between index performance and individual stock outcomes during this crash-and-recovery cycle reveals something important about how ASX tech stocks actually behave under stress: the sector fell together but did not recover together. That divergence carries real implications for how Australian investors should think about tech exposure. What follows profiles the ten largest ASX tech companies across both the downturn and recovery phases, identifies the structural characteristics separating the hardest-hit from the most resilient, and draws out investor-relevant patterns from the data.
The scale of the decline deserves a moment to settle. Between 29 August 2025 and 30 March 2026, the S&P/ASX 200 Information Technology Index (XIJ) fell 48%, a drawdown that placed technology as one of the worst-performing sectors on the ASX during the period.
The XIJ’s 48% decline over seven months marked one of the most severe sector-level drawdowns in recent Australian market history.
The broader ASX 200 told a different story. On a price basis, the S&P/ASX 200 returned +6.8% in 2025, while the XIJ declined 21.04% for the calendar year, making technology the second-worst of 11 ASX sectors. That gap widened further during the trough-to-recovery window: from 31 March onward, the XIJ rebounded 12%, compared with a 2.1% gain for the ASX 200 (XJO).
The macro drivers were layered. ASX tech stocks trade as long-duration assets, making them structurally sensitive to interest rate shifts. The RBA’s policy trajectory through this period, combined with intensifying fears of an AI valuation bubble in late 2024 and into 2025, created the conditions for a sector-wide rout.
ASX market cycle dynamics from 2022 to 2024 offer a directly comparable reference point: Information Technology surged 52% and Financials 34% in the 2024 recovery phase, while the same sector that led the recovery had been among the worst performers during the 2022 drawdown, a pattern that mirrors the divergence observed in the 2025-2026 cycle.
The selloff was sector-wide, but it was not uniform. What happened at the individual stock level tells a more instructive story.
Among the ten largest ASX tech names, the range of outcomes during the downturn was extraordinary. At one end, WiseTech Global lost 64% of its value. At the other, Elsight gained 242%.
The large-cap names clustered together in the damage. Xero fell 57%, Megaport fell 57%, and Life360 declined 61%, a pattern worth noting given these companies’ size and perceived quality. TechnologyOne dropped 34%, while NextDC lost 32%, both meaningful drawdowns but noticeably less severe than their larger peers.
Two stocks stood apart. Codan delivered a +3% return during the downturn period, defying the sector trend entirely. Macquarie Technology Group lost just 2%. And then there was Elsight: a 242% gain during a period when the sector index halved, driven by company-specific catalysts rather than sector dynamics.
Dicker Data declined only 8%, positioning it alongside Codan and Macquarie Technology as a relative safe haven within the group.
| Company | ASX Code | Downturn Return | Recovery Return |
|---|---|---|---|
| Elsight | ELS | +242% | N/A |
| Codan | CDA | +3% | +26% |
| Macquarie Technology | MAQ | -2% | +29% |
| Dicker Data | DDR | -8% | N/A |
| NextDC | NXT | -32% | +33% |
| TechnologyOne | TNE | -34% | N/A |
| Xero | XRO | -57% | +5% |
| Megaport | MP1 | -57% | +79% |
| Life360 | 360 | -61% | +1% |
| WiseTech Global | WTC | -64% | 0% |
Neither market capitalisation nor perceived quality protected investors equally. The data suggests that idiosyncratic factors, including company-specific news flow, short-interest dynamics, and earnings visibility, created vastly different outcomes even among the sector’s ten largest names.
The multiple compression across ASX growth stocks during this period was not driven by deteriorating earnings: WiseTech Global’s consensus FY27 EPS estimates rose approximately 28.9% during the same period its share price fell more than 50%, a divergence that points to sentiment and AI disruption fears rather than any fundamental business deterioration as the primary engine of the selloff.
The recovery phase, from 31 March 2026 onward, rewarded a specific type of company. The stocks that bounced fastest shared a common trait: demonstrated profitability and durable cash flow.
Megaport reported positive adjusted EBITDA for eight consecutive quarters and positive cash flow for four consecutive quarters through FY25, the clearest profitability signal the market rewarded during the recovery phase.
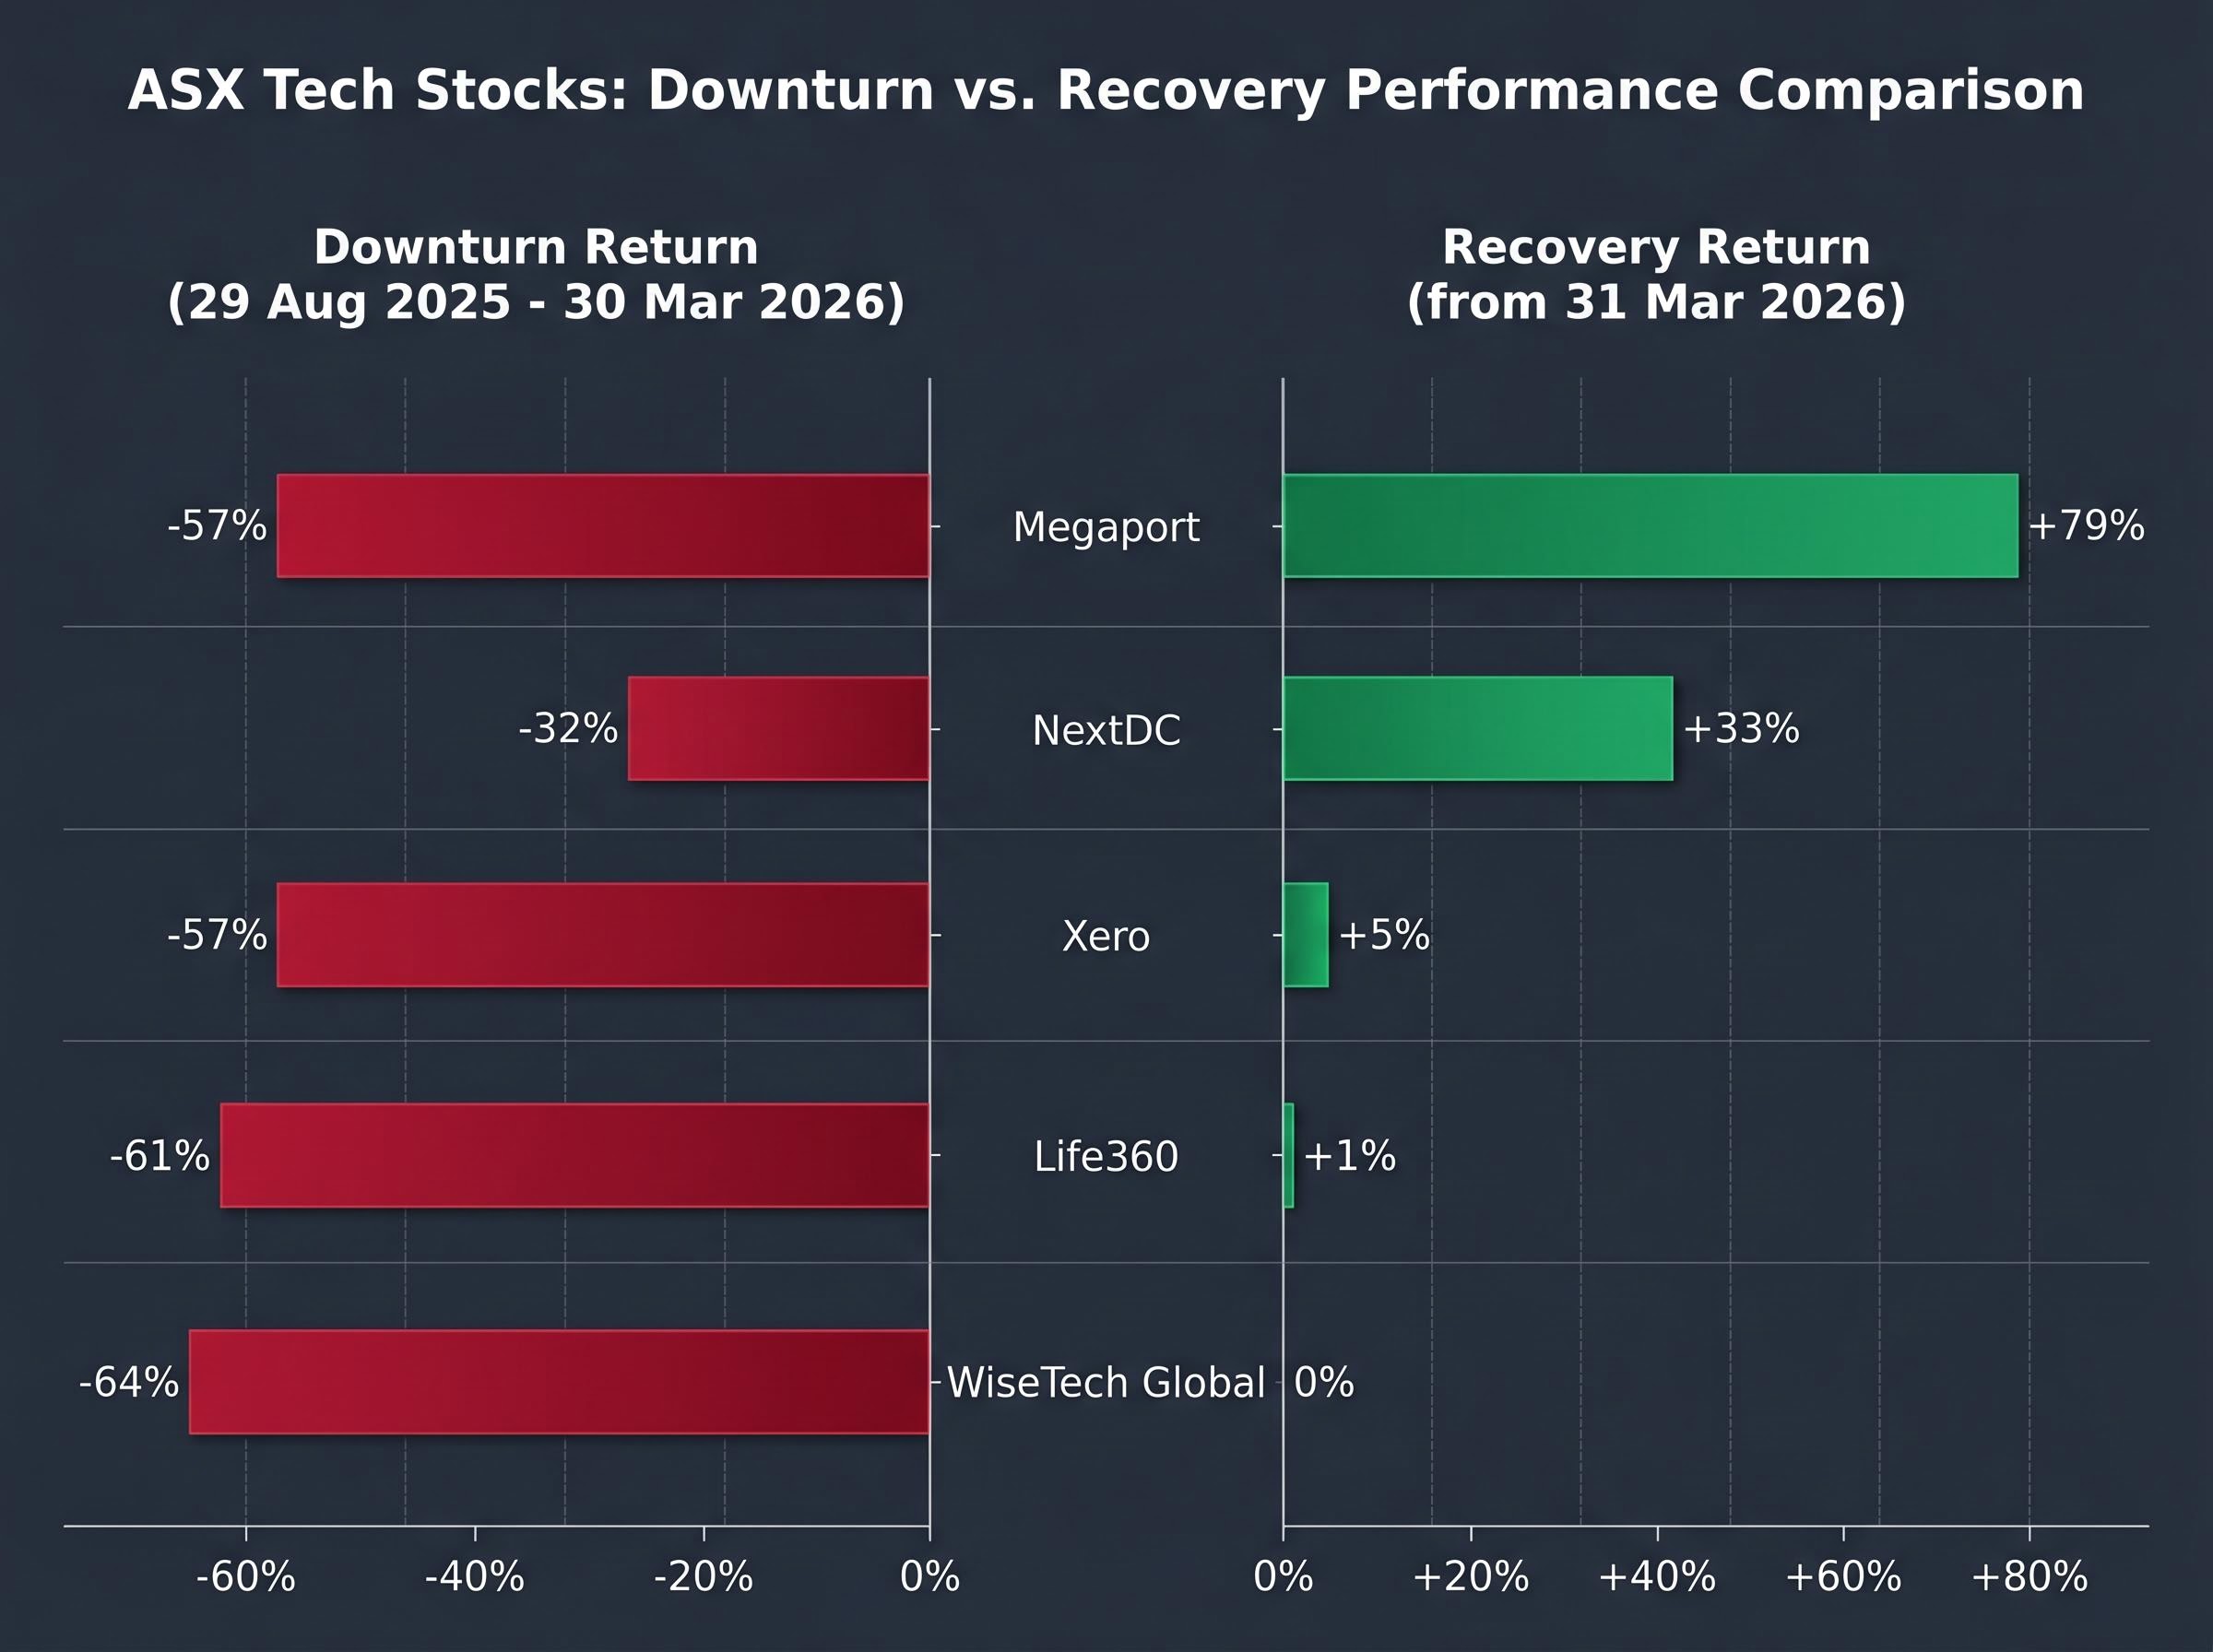
At the other end, WiseTech Global recorded 0% recovery. This outcome is notable given WiseTech’s strong long-term earnings profile, including a 27.1% three-year revenue compound annual growth rate (CAGR) and the completion of its e2open acquisition in August 2025. The flatline suggests that even high-quality earnings growth could not offset valuation re-rating pressure in a rising-rate environment.
Life360 recovered just 1%, despite reporting Q4 FY2024 revenue of $146 million (+26% year-on-year) and exceeding 60 million monthly active users. Strong operational metrics did not translate into price recovery when the stock still carried speculative risk characteristics.
The pattern is clear. Recovery performance in a sector rebound often reveals more than the decline itself: it shows what the market is willing to pay for again, and in what order.
ASX tech stocks are classified as long-duration assets. Their valuations depend heavily on the present value of future cash flows, meaning that when interest rates rise, the discount rate applied to those distant earnings increases, and share prices fall. This sensitivity to rate movements makes the technology sector structurally more volatile than most other ASX sectors during monetary policy shifts.
The RBA’s cash rate trajectory through this period illustrates the effect. The RBA paused rate hikes in early 2025, then cut the cash rate to 3.85% by May 2025, providing a brief tailwind for tech valuations. A subsequent hike back to 4.35% by May 2026 reversed that support. Each shift in rate expectations rippled through the sector, amplifying both the decline and the uneven recovery.
The RBA’s May 2026 cash rate decision confirmed an increase to 4.35%, with the accompanying Statement on Monetary Policy flagging a further assumed rise to 4.7% by year-end, a trajectory that continues to apply direct downward pressure on the present value of long-dated tech cash flows across the ASX.
The XIJ’s status as the second-worst performer among 11 ASX sectors in 2025 (price return of -21.04% versus the ASX 200’s +6.8%) confirms that rate sensitivity alone made tech the primary swing sector for risk-on, risk-off positioning within Australian equities.
Not all tech stocks carry the same rate sensitivity. The difference between speculative growth names and quality earnings businesses determined which stocks suffered most.
The question of whether premium valuation multiples reflect genuine earnings quality or a valuation trap had been building well before the August 2025 selloff: Pro Medicus, WiseTech, TechnologyOne, and Xero were trading at 56-68 times trailing earnings as of early May 2026, a premium of 3.3x to 4.3x over the ASX 200 forward multiple, and the gap between those multiples and the sector’s recovery speed is not coincidental.
Dicker Data and TechnologyOne anchored the lower-volatility end of the spectrum during the downturn. Life360, despite 26% year-on-year revenue growth and 60 million MAUs, declined 61%, a reminder that operational momentum alone does not insulate a stock from speculative risk characteristics if the market questions the path to durable free cash flow.
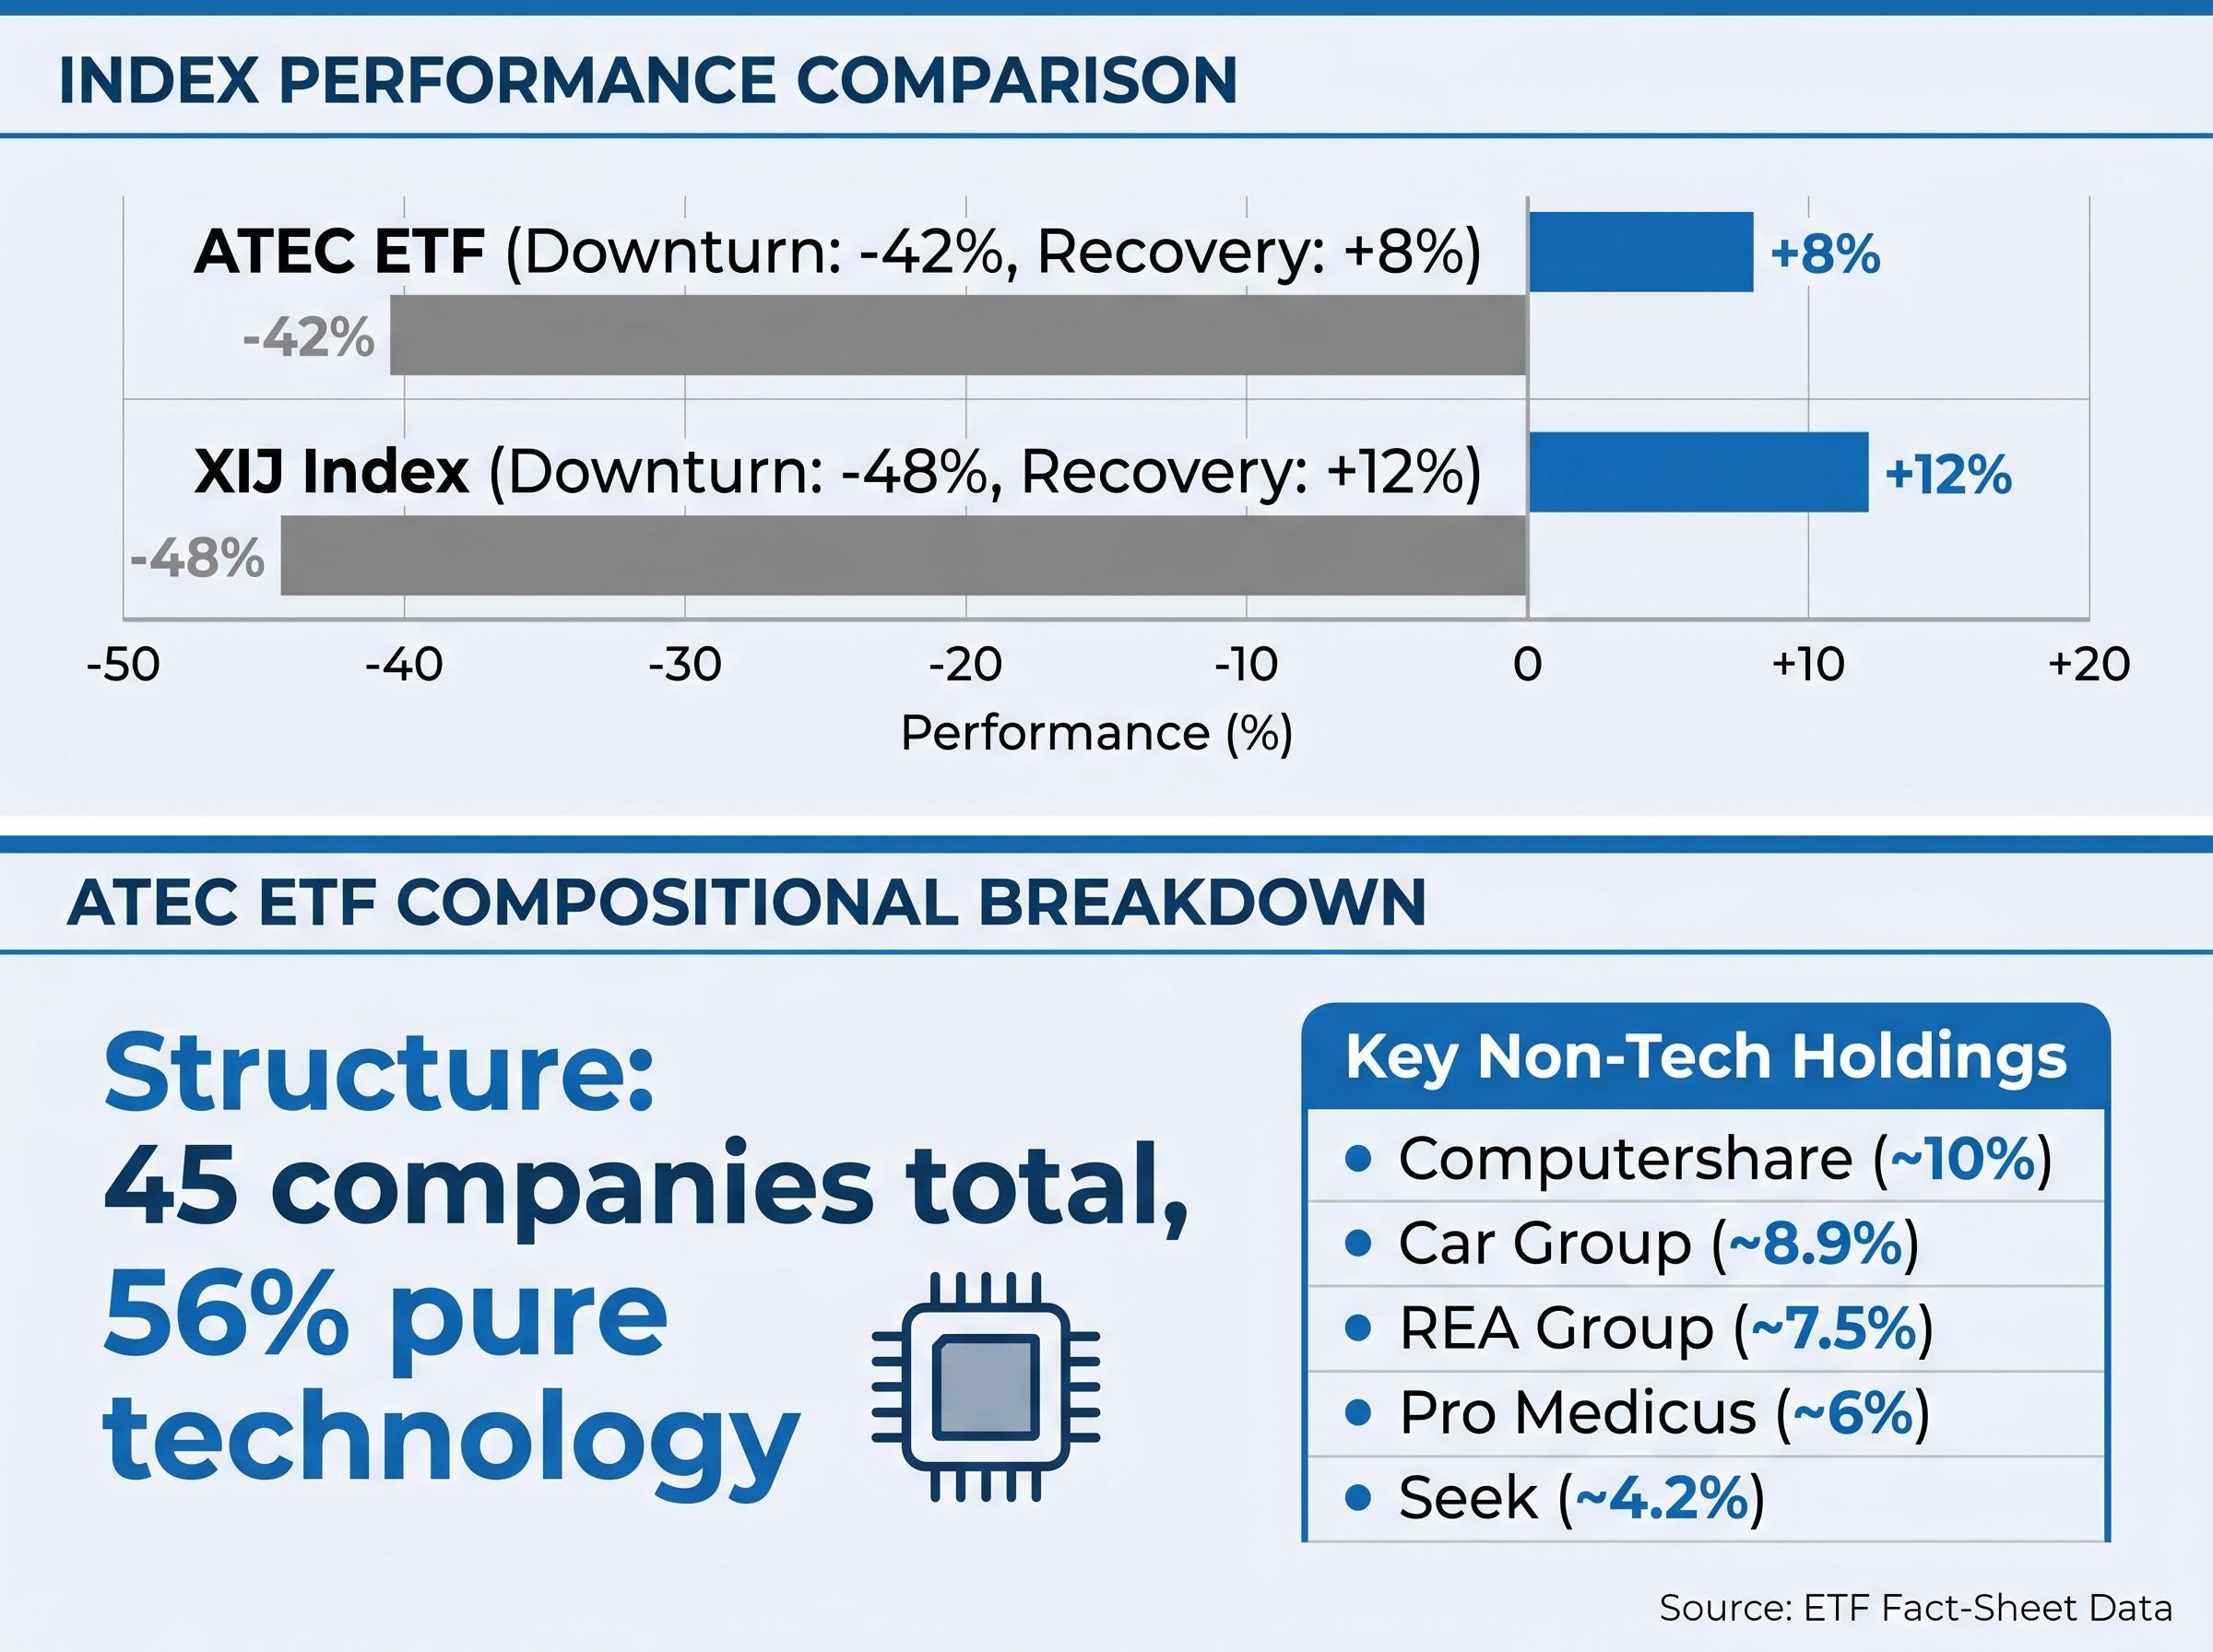
The BetaShares S&P/ASX Australian Technology ETF (ATEC), the sole ASX-listed ETF providing exclusive exposure to Australian technology-related companies, offered partial protection during the downturn but lagged during the recovery.
ATEC declined 42% over the downturn period, compared with the XIJ’s 48% fall. Post-31 March, ATEC recovered 8% versus the XIJ’s 12%.
| Metric | ATEC | XIJ |
|---|---|---|
| Downturn Return | -42% | -48% |
| Recovery Return | +8% | +12% |
| Structure | Cross-sector (45 companies) | Pure technology |
The performance gap reflects ATEC’s cross-sector construction. The S&P/ASX All Technology Index, which ATEC tracks, holds 45 companies, of which only 56% are classified within the technology sector. Key non-tech holdings provided partial ballast:
The trade-off is straightforward. ATEC’s cross-sector holdings softened the decline by six percentage points but also dampened the recovery by four. Investors choosing between pure XIJ exposure and ATEC should base the decision on their tolerance for drawdown severity versus their willingness to accept slower recoveries.
The crash-and-recovery data from this cycle produces several testable patterns for investors assessing ASX tech exposure.
Current conditions suggest the pressures that drove the downturn have not fully resolved. The RBA cash rate sits at 4.35% following the May 2026 hike. Xero is down approximately 25.6% year-to-date as of mid-May 2026, indicating continued valuation pressure on large-cap growth names. AI narrative volatility, which contributed to the late 2024 and 2025 rout, remains a factor in sector sentiment.
These conditions do not constitute a prediction of further declines. They do suggest that the same variables, rate sensitivity, earnings quality, and revenue durability, that determined outcomes in the recent cycle are likely to remain relevant for position sizing.
The 48% decline and uneven recovery are not simply historical events. They are evidence of a structural feature of ASX tech investing, where intra-sector dispersion routinely exceeds index-level returns in both directions.
The data does not point to a universal buy or sell signal. It points to a framework: earnings quality, rate sensitivity, and revenue durability are the variables that determined recovery speed in this cycle. Stocks with demonstrated EBITDA and positive cash flow recovered fastest. Stocks with high growth but unresolved profitability concerns remained flat or barely moved.
WiseTech recovered 0%. Megaport recovered 79%. Both are ASX tech companies. The distinction is the entire story.
Investors revisiting their ASX tech exposure in mid-2026 should assess individual holdings against these recovery-speed criteria rather than relying on the index as a proxy. Index-level tech investing and stock-level tech investing produced fundamentally different outcomes in this cycle, and the data suggests they are fundamentally different propositions.
For investors weighing whether to hold individual ASX tech names or shift to ETF exposure after a cycle like this one, our dedicated guide to AI stocks versus ETFs on the ASX draws the dot-com era parallel directly, examining how market-cap-weighted ETFs automatically reduced exposure to underperformers such as C3.ai (down 67% from its 2025 peak) while individual stock pickers faced binary outcomes similar to the WiseTech versus Megaport divergence documented in this cycle.
This article is for informational purposes only and should not be considered financial advice. Investors should conduct their own research and consult with financial professionals before making investment decisions. Past performance does not guarantee future results.
The decline was driven by a combination of interest rate sensitivity, as ASX tech stocks are long-duration assets whose valuations compress when discount rates rise, and intensifying fears of an AI valuation bubble that built through late 2024 and into 2025. The RBA's rate trajectory amplified both the selloff and the uneven recovery.
Codan gained 3% and Macquarie Technology Group lost just 2% during the downturn period, making them the most resilient of the ten largest ASX tech names. Dicker Data also held up relatively well, declining only 8% while the sector index fell 48%.
ATEC is the BetaShares S&P/ASX Australian Technology ETF, the only ASX-listed ETF providing exclusive exposure to Australian technology-related companies. It declined 42% during the downturn compared to the sector index fall of 48%, offering partial protection due to its cross-sector construction across 45 companies, but it also recovered more slowly, gaining 8% versus the index's 12% rebound.
Megaport recovered 79% from the March 2026 trough because it had transitioned from a speculative growth story to a demonstrated earnings narrative, reporting positive adjusted EBITDA for eight consecutive quarters and positive cash flow for four consecutive quarters through FY25, characteristics the market rewarded most in the recovery phase.
ASX tech stocks are classified as long-duration assets, meaning their valuations are based on the present value of future cash flows. When interest rates rise, the discount rate applied to those distant earnings increases and share prices fall, making the technology sector structurally more volatile than most other ASX sectors during monetary policy shifts.