ATEC Is Down 36%: Opportunity or a Broken Thesis?
48 mins ago

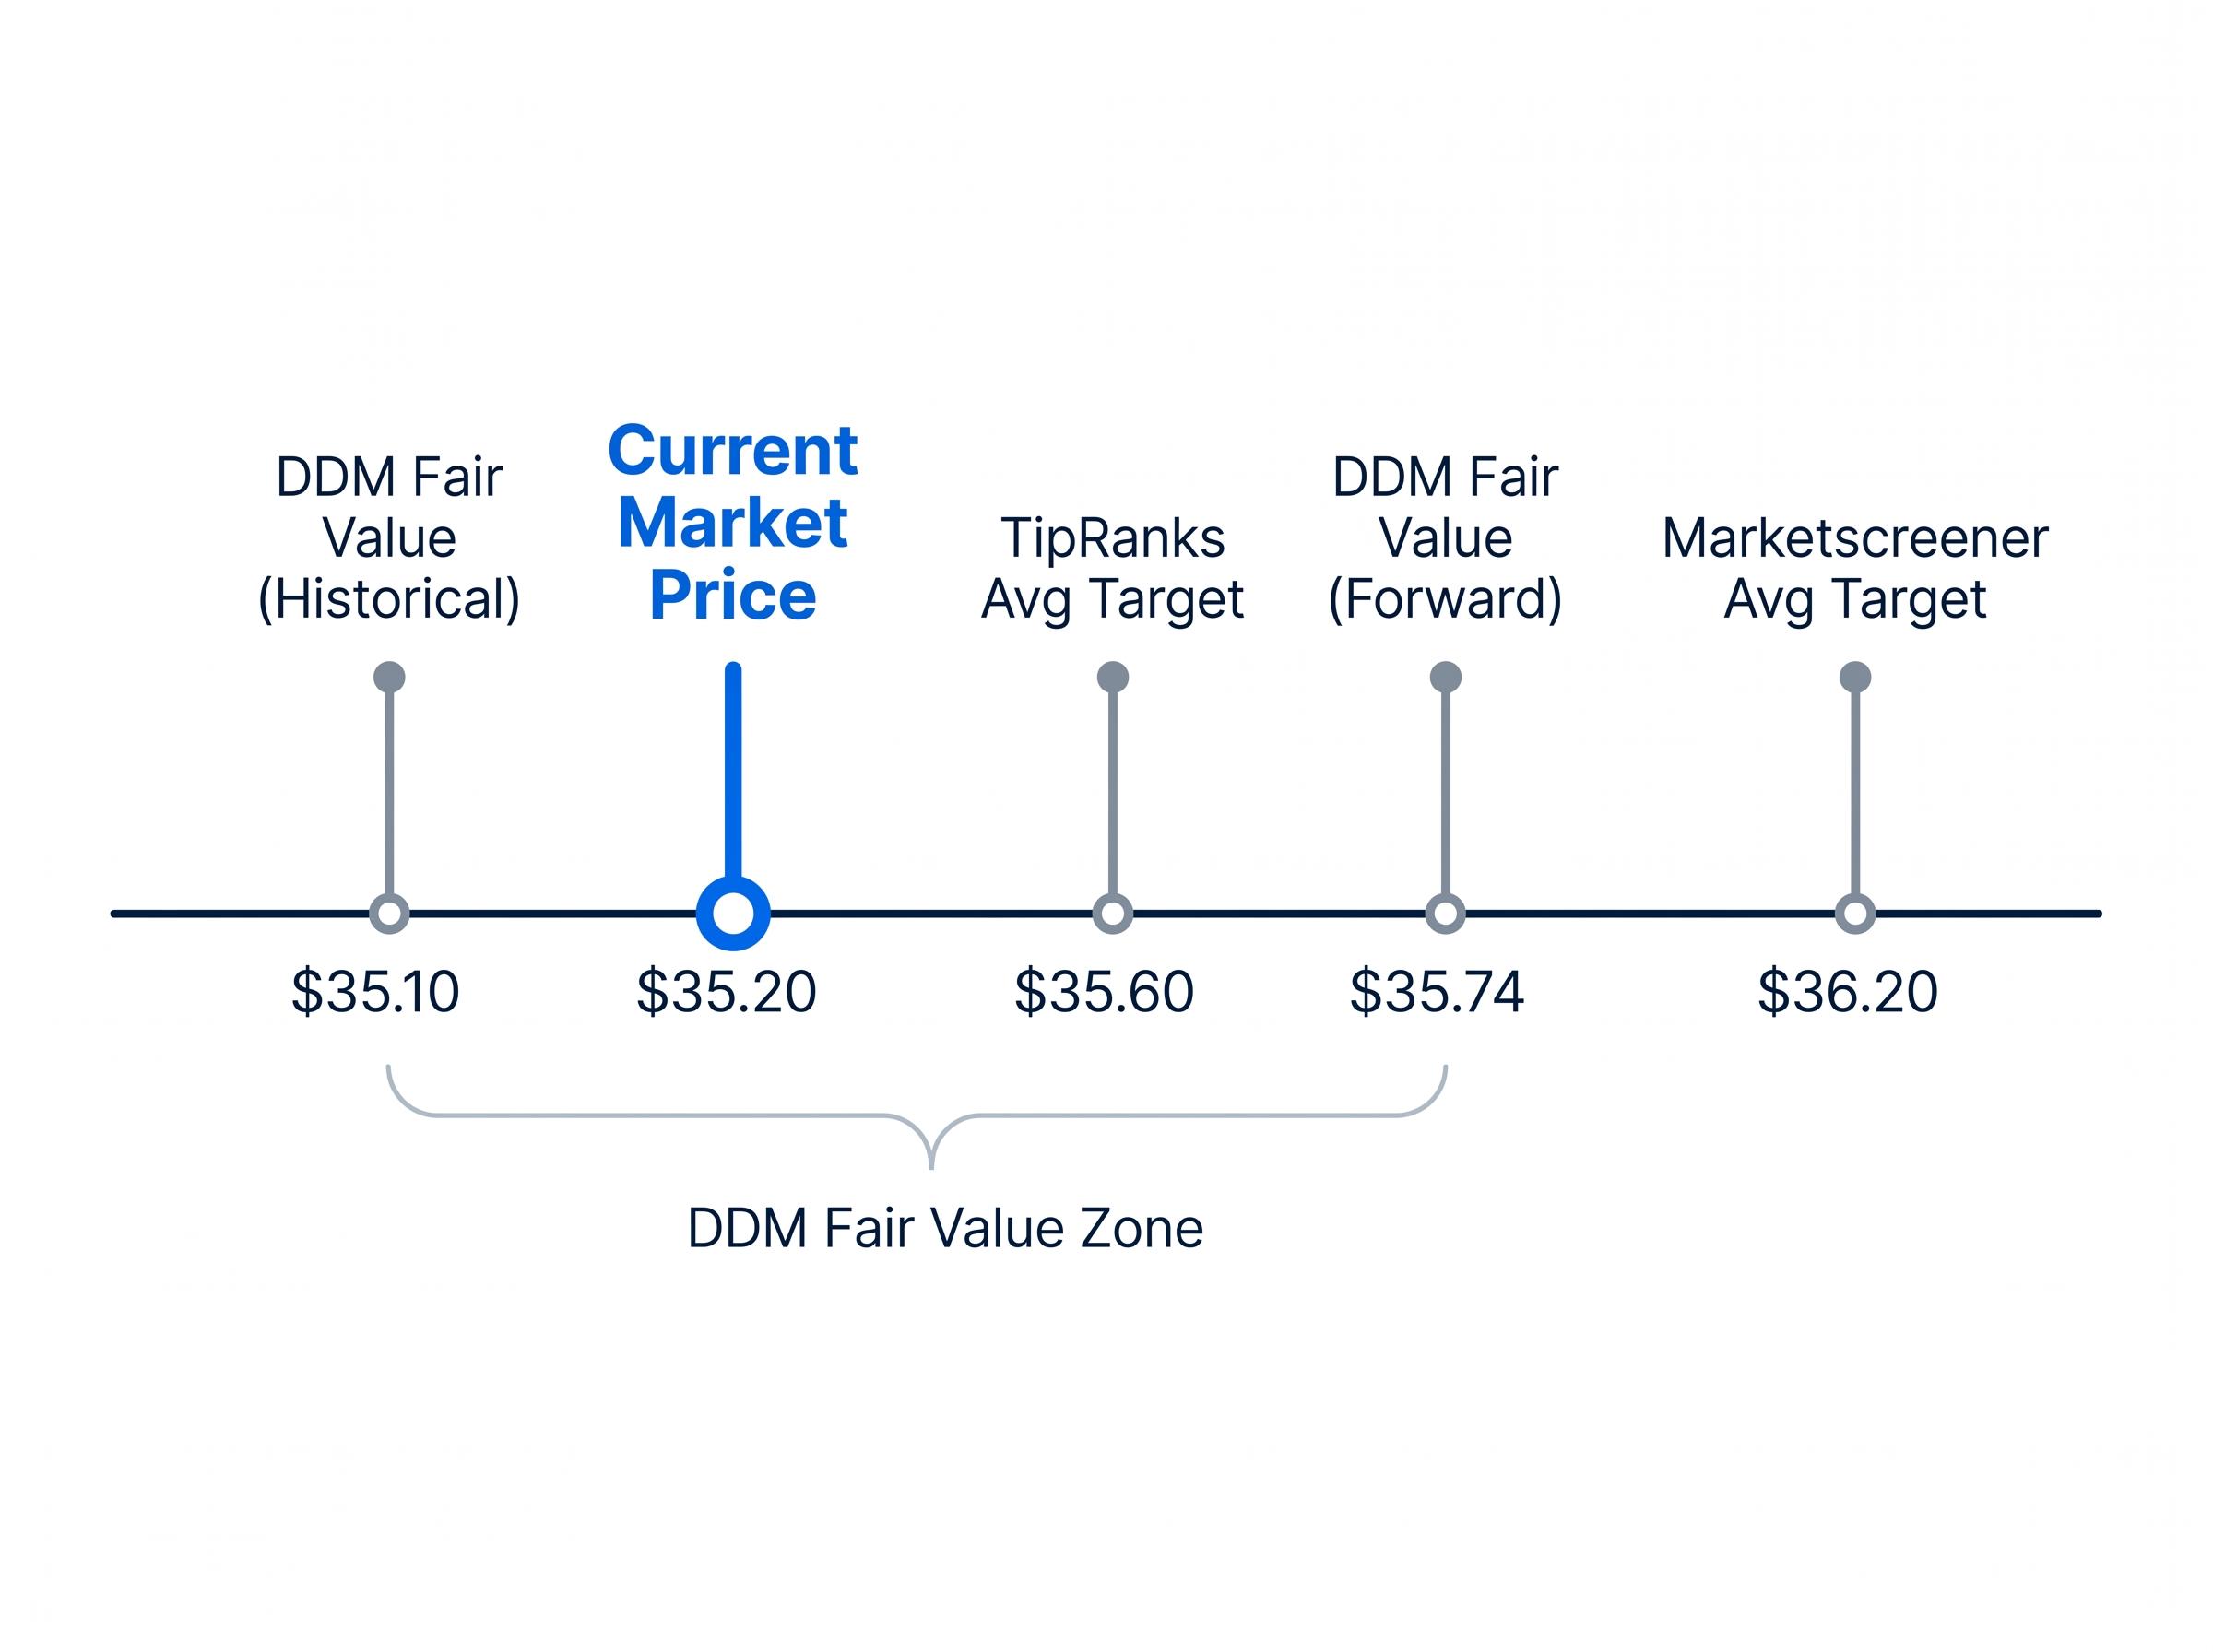
ANZ shares closed at $35.20 in mid-May 2026, and a Dividend Discount Model (DDM) analysis puts fair value at approximately $35.10 to $35.74, depending on whether historical or forward dividends anchor the calculation. The gap between the model’s output and the market price is narrow enough to raise a pointed question: is ANZ fairly valued, or is the market simply waiting for a catalyst that has not yet arrived?
The bank’s 1H26 results, released on 1 May 2026, confirmed an interim dividend of 83 cents per share and a franking rate increase to 75%. The RBA, meanwhile, lifted the cash rate to 4.35% at its May meeting, with markets pricing a further move toward 4.70% by year-end. For income-oriented investors reassessing the big four’s appeal at current prices, ANZ sits in an uncomfortable middle ground: not obviously cheap, not obviously expensive, and carrying a specific set of margin and return characteristics that complicate the value story.
What follows is a structured DDM valuation of ANZ, an examination of whether the bank’s fundamentals can sustain the dividend assumptions that produce that result, and a reading of the macro and peer context that determines whether “fairly valued” is the right characterisation at $35.20.
Banks are not software companies. They do not reinvest most of their earnings into high-growth capital expenditure or research pipelines. They return capital to shareholders through dividends, and that return is the most direct, measurable proxy for investor value. The Dividend Discount Model captures this reality by valuing a stock as the present value of its future dividend stream.
DDM works best when the company pays a consistent, forecastable dividend. ANZ qualifies on all three criteria that make the method appropriate:
The model itself is straightforward. It derives a share price from a single equation:
DDM Formula: Share Price = Full-Year Dividend / (Risk Rate minus Dividend Growth Rate)
The preferred input is a forward dividend estimate rather than a purely historical figure, as it better reflects the current earnings trajectory. A forward estimate of approximately $1.69, derived from the 1H26 run-rate and modest growth expectations, provides a more current anchor than the trailing $1.66.
Understanding why DDM is used, and what it assumes, is the difference between treating the output as a headline number and treating it as a tool with specific, identifiable limitations.
For readers who want to stress-test the assumptions before accepting any single fair-value output, our dedicated guide to how the DDM values income stocks walks through the Gordon Growth Model formula, the franking credit adjustments that materially alter after-tax yield comparisons for Australian investors, and the three criticisms of the model that genuinely apply versus those that apply equally to all discounted cash flow methods.
A DDM produces a single fair value estimate for each pair of assumptions. Change the dividend growth rate or the risk rate, and the output moves. The analytical value comes not from any single point estimate but from running the model across a range of plausible assumptions and observing where the outputs cluster.
The scenario matrix below uses dividend growth rates of 2% to 4% per annum, reflecting ANZ’s modest earnings growth profile, and risk rates of 7% to 11%, spanning a range from a benign to a stressed environment.
| Dividend Growth Rate | Risk Rate 7% | Risk Rate 9% | Risk Rate 11% |
|---|---|---|---|
| 2% | $33.20 | $23.71 | $18.78 |
| 3% | $41.50 | $27.67 | $20.75 |
| 4% | $55.33 | $33.20 | $23.71 |
The full output range spans approximately $18.78 to $84.50 per share when the extremes of both inputs are combined. That width is expected; it reflects the mathematical sensitivity of the DDM to small changes in denominator assumptions, not analytical imprecision. The extremes are not the analytically useful zone.
Averaging across the scenario matrix neutralises the influence of any single assumption pair. The result:
ANZ DDM fair value (historical $1.66 dividend): approximately $35.10 ANZ DDM fair value (forward $1.69 dividend): approximately $35.74 Current market price: $35.20
The market is pricing ANZ almost exactly where the DDM’s midpoint sits. The question becomes whether the fundamentals can sustain the dividend assumptions that produced that result.
A “fairly valued” DDM output is only meaningful if the business can sustain the dividend growth rate embedded in the model. ANZ’s fundamental profile provides a mixed but instructive answer.
ANZ’s net interest margin (NIM) of 1.57% sits 21 basis points below the sector average of 1.78%. That gap matters. NIM is the spread a bank earns between what it pays for deposits and what it charges on loans; a persistently below-average NIM constrains earnings power and, by extension, dividend growth capacity. Return on equity (ROE) of 9.3% is virtually in line with the sector average of 9.35%, confirming that ANZ is not structurally underperforming on capital efficiency but is not outperforming either.
| Metric | ANZ | Sector Average |
|---|---|---|
| Net Interest Margin | 1.57% | 1.78% |
| Return on Equity | 9.3% | 9.35% |
| CET1 Ratio | 12.2% | Below 12.2% |
| Trailing P/E | ~18.26x | Varies by peer |
The trailing price-to-earnings ratio of approximately 18.26x compares with Westpac at approximately 19.29x, placing ANZ at a modest discount to its closest peer on this measure. The discount is not arbitrary; it reflects the margin and return characteristics described above.
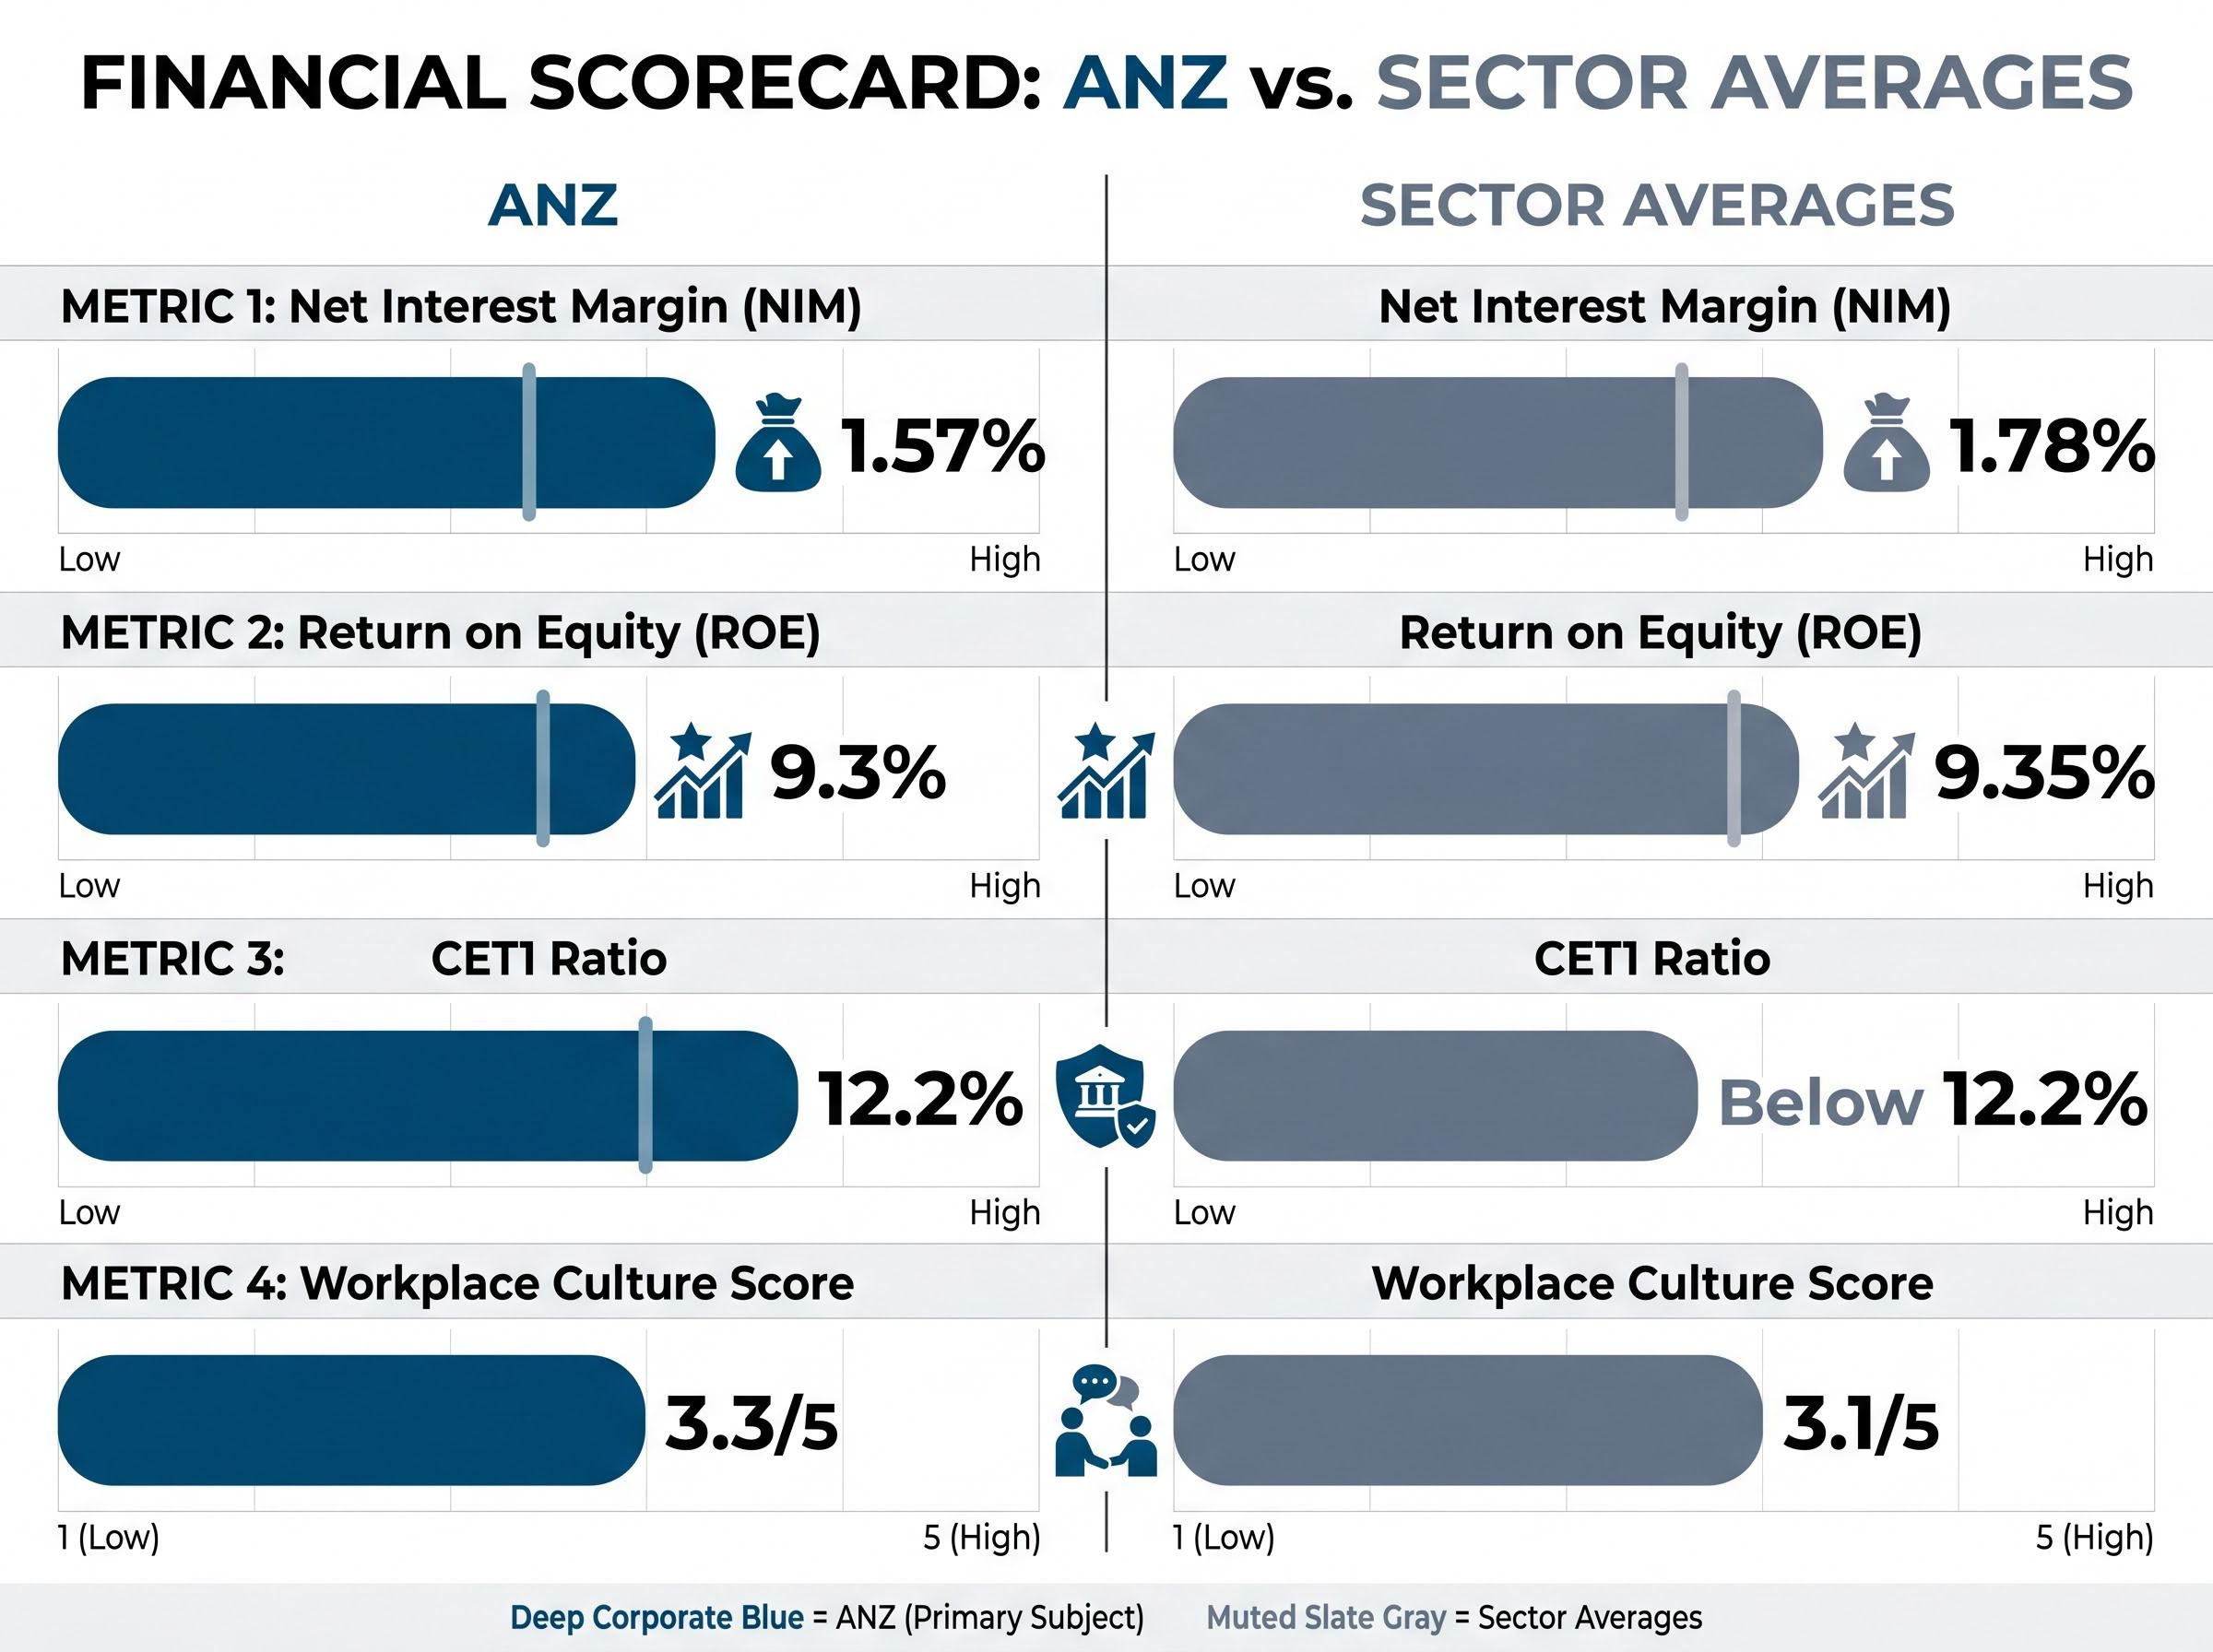
The Common Equity Tier 1 (CET1) ratio, the primary measure of a bank’s capital buffer above regulatory minimums, stands at 12.2%, above the sector average. This is the floor that underpins dividend continuity: a well-capitalised bank has greater flexibility to maintain payouts even if earnings soften temporarily.
APRA’s Prudential Standard APS 110 sets the minimum Common Equity Tier 1 capital requirement at 4.5% for standardised authorised deposit-taking institutions, making ANZ’s reported CET1 ratio of 12.2% a substantial buffer above the regulatory floor and a direct indicator of its capacity to sustain dividend payments through an earnings downturn.
The increase in the franking rate to 75% in 1H26, up from 70%, carries a specific signal. Management does not raise franking unless confident in both the capital position and the earnings trajectory that supports it. For Australian retail and superannuation investors, the higher franking rate enhances the grossed-up yield, making ANZ more attractive on an after-tax basis, particularly for those in the 30%+ tax bracket.
ANZ reported 1H26 cash profit of $3,780 million. The workplace culture score of 3.3 out of 5 (versus a sector average of 3.1) is a softer data point, but it suggests operational stability at a time when the bank is executing a multi-year transformation.
The cost-driven profit surge that produced ANZ’s 62% statutory profit increase in 1H26 came with a revenue line that grew just 3%, a distinction the market priced carefully on results day when shares fell approximately 1% despite the headline beat, reflecting investor awareness that cost savings are a one-cycle lever rather than a recurring earnings growth engine.
The fundamental picture confirms the DDM’s verdict from a different angle: below-average margins limit the upside case, while above-average capital adequacy limits the downside risk.
The DDM’s fair-value signal comes with a timestamp. It reflects assumptions about dividend growth and risk that are themselves sensitive to the macroeconomic environment, and that environment shifted materially in May 2026.
The RBA increased the cash rate by 25 basis points to 4.35% at its May meeting. Market pricing implies a further rise to approximately 4.70% by end-2026. For a bank like ANZ, this tightening cycle transmits through three channels:
The RBA’s May 2026 Statement on Monetary Policy confirmed the cash rate increase to 4.35% and outlined market expectations for further tightening toward 4.70% by year-end, providing the macroeconomic backdrop against which ANZ’s dividend growth assumptions must be assessed.
The Suncorp integration and ANZ 2030 strategy under CEO Nuno Matos offer medium-term offsets, with cost synergies and revenue diversification potentially supporting earnings growth beyond the current cycle. ANZ New Zealand, which reported 1H26 cash net profit after tax of $1,238 million, continues to contribute meaningfully to the group, though margin pressure across the Tasman mirrors conditions in Australia.
The DDM’s fair-value signal is most reliable if deposit competition remains contained and credit quality deterioration proves modest. If either assumption breaks, the growth and risk rate inputs shift simultaneously, and the model’s output moves with them.
ANZ is the value candidate in the big four. That label has been accurate for several years, and it has not yet translated into outperformance. Understanding why requires looking at what each bank offers and what the market prices into each.
| Bank | Valuation Tone | Trailing P/E | Key Attraction | Key Risk |
|---|---|---|---|---|
| ANZ | Value / catch-up | ~18.26x | Yield, capital strength | Execution, margin compression |
| CBA | Premium quality | Richest in sector | Earnings quality, brand | Premium valuation |
| NAB | Growth | Mid-range | Business banking momentum | Business credit cycle |
| Westpac | Turnaround / income | ~19.29x | Yield, simplification | Execution delivery |
ANZ’s discount to CBA is not a valuation anomaly. It reflects structural differences in NIM and ROE that the market is correctly pricing. The gap will narrow only if ANZ delivers measurable improvement on both metrics, not simply because it looks cheaper on a trailing P/E basis.
NIM trajectory is the metric that separates the analytical signal from the noise in big four comparisons: a trailing P/E ratio shows where each bank has been, but a bank with improving NIM momentum is compounding its earnings base, while one with a structurally compressed margin, as ANZ’s 1.57% versus the sector’s 1.78% illustrates, faces a headwind that the earnings multiple does not automatically capture.
Broker consensus reflects this reality. The average price target sits at approximately $36.20 (according to Marketscreener data), with TipRanks reporting an average of approximately $35.60 and a range of $30.72 to $40.00. The implied upside of roughly 4-5% from current levels is consistent with a “hold” characterisation rather than a strong buy signal. The market continues to apply an execution risk discount under the relatively new leadership of CEO Nuno Matos.
Three medium-term catalysts could shift that positioning:
Until at least one of these materialises in reported numbers, the value catch-up thesis remains a forward bet rather than a current reality.
The DDM analysis places ANZ’s fair value at $35.10 on a historical dividend basis and $35.74 using a forward estimate of $1.69 per share. The current market price of $35.20 sits almost exactly in between.
This is not a stock that the model identifies as mispriced. It is a stock that appears to be approximately fairly valued, with the grossed-up dividend yield providing the primary return driver for investors at current prices. The FY26 full-year dividend forecast of approximately $1.68, franked at 75%, is particularly relevant for investors in the 30%+ tax bracket, where the after-tax yield advantage over unfranked alternatives widens meaningfully.
ANZ’s annualised forward yield of approximately 4.7%-4.8%, the highest among the big four on a percentage basis, is the figure income-oriented investors are pricing at current levels; the gap between that yield and the cash rate of 4.35% has narrowed significantly relative to prior years, reducing the margin of safety that once made bank dividends a straightforward alternative to fixed income.
Broker consensus reinforces the DDM’s conclusion, with implied upside of approximately 4-5% serving as a cross-check rather than a contradiction.
Three conditions would shift the assessment from “fairly valued” to “attractive”:
At $35.20, ANZ appears approximately fairly valued. The grossed-up yield provides the primary return driver for income-oriented investors at current prices, while the upside case depends on margin improvement and earnings growth that have not yet been confirmed in reported results.
The downside risk is equally specific. If dividend growth fails to reach even the 2% assumption embedded in the DDM’s lower bound, the scenario matrix’s weaker outputs, well below $30, become materially more relevant.
This article is for informational purposes only and should not be considered financial advice. Investors should conduct their own research and consult with financial professionals before making investment decisions. Past performance does not guarantee future results. Financial projections are subject to market conditions and various risk factors.
A Dividend Discount Model (DDM) values a stock by calculating the present value of its future dividend payments using the formula: Share Price equals Full-Year Dividend divided by the difference between the Risk Rate and the Dividend Growth Rate. For ANZ, applying this model with a forward dividend estimate of approximately $1.69 and a range of risk and growth rate assumptions produces a fair value range of roughly $35.10 to $35.74 per share.
The Common Equity Tier 1 (CET1) ratio measures a bank's capital buffer above regulatory minimums, and ANZ's 12.2% sits above both the APRA minimum of 4.5% and the sector average, indicating the bank has substantial capacity to maintain dividend payments even if earnings soften temporarily.
ANZ increased its franking rate to 75% in its 1H26 results, which enhances the grossed-up dividend yield for Australian investors, particularly those in the 30% or higher tax bracket, by reducing the additional tax owed on dividend income through credits for tax already paid at the corporate level.
ANZ's net interest margin of 1.57% sits 21 basis points below the sector average of 1.78%, which constrains its earnings power and dividend growth capacity relative to peers, and partly explains why the market applies a discount to ANZ's trailing price-to-earnings ratio of approximately 18.26x compared to Westpac's approximately 19.29x.
According to the DDM analysis, ANZ would move from fairly valued to attractively valued if it achieves dividend growth exceeding the 2% floor assumption across multiple reporting periods, narrows its net interest margin toward the sector average of 1.78%, or delivers demonstrable Suncorp integration synergies that flow through to reported earnings.