
AMD and SMCI Earnings Confirm AI Demand, but Nvidia Holds the Key
3 hrs ago

The ASX 300 returned 8.62% annually over 15 years, compounding a $1,000 investment into $3,456. Yet only 36% of the largest listed companies in the index matched or exceeded that figure. The April 2026 Morningstar Australia ASX Long-Term Wealth Creation Study, authored by Mark LaMonica, CFA, examined 210 of the largest ASX-listed companies over the 15-year period to quantify a pattern long documented in US equities: that a small minority of stocks generate the vast majority of market returns, while most trail the index they belong to. The findings carry direct implications for Australian investors who select individual stocks. What follows is an analysis of why the index itself is one of the most underappreciated structural advantages in investing, and what the data reveals about the true odds facing any portfolio built without a clearly defined selection framework.
The headline figures are specific enough to let the paradox speak for itself. The ASX 300 compounded at 8.62% annually over 15 years. The average individual stock in the dataset returned 7.11%. The median returned 6.73%. A cash deposit over the same period delivered 2.67%, growing $1,000 to just $1,484.
Morningstar Australia’s ASX wealth creation study, authored by Mark LaMonica CFA and published in April 2026, applied Bessembinder’s return-skewness framework to 210 of the largest ASX-listed companies across a 15-year period, producing the dataset from which all figures in this analysis are drawn.
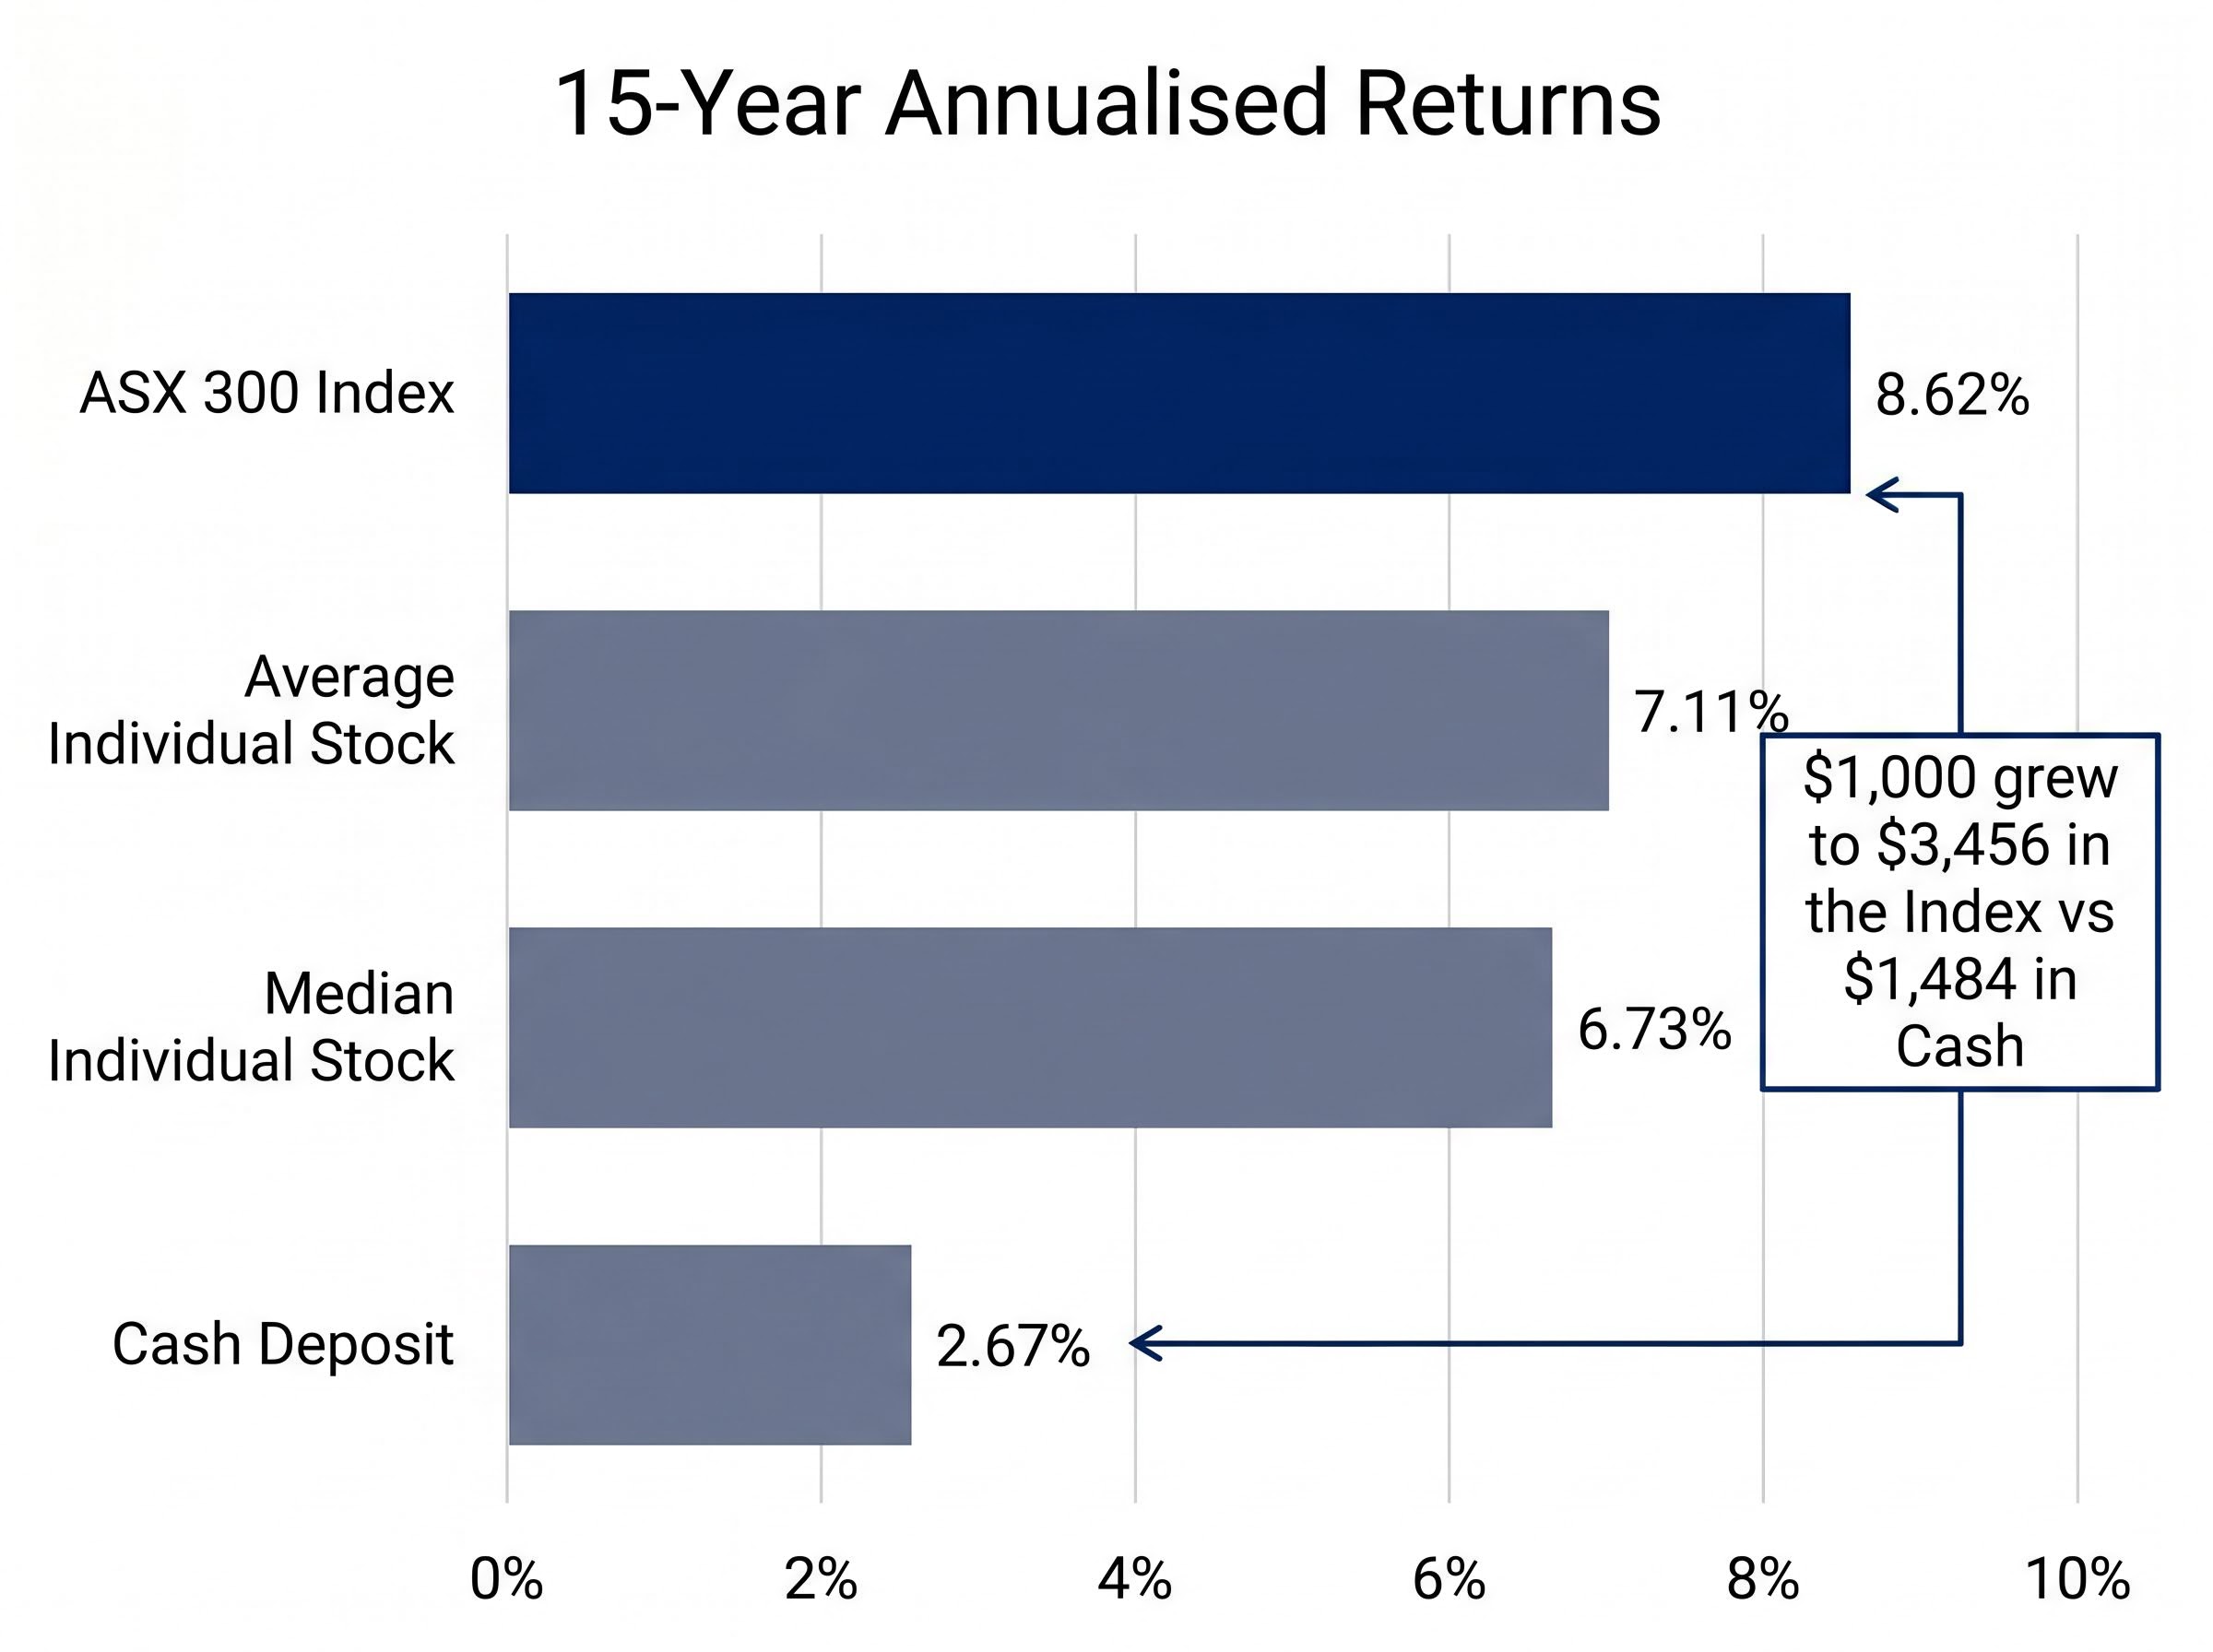
| Investment Vehicle | Annualised Return | $1,000 Grown To |
|---|---|---|
| ASX 300 Index | 8.62% | $3,456 |
| Average Individual Stock | 7.11% | Lower than index |
| Median Individual Stock | 6.73% | Lower than average |
| Cash Deposit | 2.67% | $1,484 |
The gap between the index return and the median stock return, nearly two full percentage points annually, means the typical large-cap ASX stock materially lagged the benchmark it was part of. Some 72% of the 210 stocks beat cash, which sounds encouraging until the comparison shifts to the index itself.
The compounding mechanics that make the second decade of an investment nearly double the dollar gains of the first decade explain why the 15-year study window is not arbitrary: it is long enough for the structural gap between index and average stock to become arithmetically decisive rather than merely probable.
Fewer than one in three of the largest ASX-listed companies beat the ASX 300 over 15 years.
For context, the S&P 500 returned 16.03% annually in Australian dollar terms over the same period, a comparison that sharpens further in later sections. But even before introducing the international gap, the domestic numbers alone present a statistical reality that most stock-pickers are working against.
The Morningstar study began with 333 companies and narrowed the dataset to 210 by excluding those without a full 15-year return history. That exclusion is not a minor methodological footnote. It is the single largest source of upward bias in the findings.
Of the 123 companies removed, some were delisted because they failed. Virgin Australia, for instance, entered voluntary administration in 2020, delivering a 100% loss to shareholders. That outcome does not appear anywhere in the dataset. The study captured only companies that survived the full 15-year period, which means the worst-performing cohort, those that ceased to exist, was systematically excluded.
The directional effects of these exclusions are worth separating:
All return figures in the study include dividend reinvestment but exclude franking credit value, a further conservative adjustment. The net effect is clear: 36% of stocks beating the index is almost certainly the ceiling, not the floor, for the proportion of all ASX-listed companies that outperformed over this period. The 72% figure for stocks beating cash is similarly inflated.
The true odds for an investor selecting from the full ASX universe, rather than just the largest survivors, would be meaningfully worse.
The reason the ASX 300 returned 8.62% while the average stock in the index returned 7.11% is not luck. It is mechanical. Market-capitalisation weighting is the structural feature that separates the index from an equal-weighted portfolio of its components, and the difference it makes compounds dramatically over time.
The logic operates in three steps:
In an equal-weighted portfolio, the opposite happens. Every stock commands the same allocation regardless of performance. A permanent loser keeps pulling returns down at full weight.
Energy Resources of Australia (ASX: ERA) was the worst performer in the dataset, delivering approximately -25% annualised returns over the 15-year study period, despite nearly doubling in the preceding 12 months. Short-term recoveries did not reverse the long-term compounding destruction.
Consider what a -25% annualised return does over 15 years in an equal-weighted portfolio. If an investor allocated $1,000 to ERA as one of 210 positions (totalling $210,000), that single position would have been virtually wiped out. In a cap-weighted index, ERA’s declining market capitalisation progressively reduced its index weight to near zero, limiting the damage to the overall return.
The study’s own data illustrates the gap. An equal-weighted $210,000 portfolio across all 210 stocks grew to approximately $1.8 million over 15 years. The cap-weighted ASX 300, by comparison, delivered 8.62% annually, a superior result driven not by better stock selection but by mechanical rebalancing that continuously reduced exposure to deteriorating companies.
This is the structural advantage that retail investors most often overlook. A passive index fund does not require stock-picking skill. It requires only that market-cap weighting quietly minimises the damage from the majority of stocks that underperform.
The mechanical rebalancing advantage that cap-weighting delivers to the index is increasingly interacting with the growing influence of passive flows on ASX pricing, with Australian ETF assets reaching approximately A$200 billion by March 2026 and inflows now large enough to move individual blue-chip prices independent of underlying earnings revisions.
The Morningstar study’s most striking finding mirrors what Hendrik Bessembinder documented across US equities: wealth creation on the ASX is concentrated in a remarkably small number of companies. The top 10 stocks in the 210-company dataset generated 56% of total wealth created. Of the approximately $1.8 million produced by the equal-weighted hypothetical portfolio, just over $1 million came from those 10 names.
Bessembinder’s research on stock return concentration, published in the Journal of Financial Economics, established that across the full history of US equity markets a tiny fraction of listed stocks account for the entirety of long-run wealth creation, with the median stock destroying value relative to Treasury bills.
One stock towered above the rest.
Pro Medicus (ASX: PME) was responsible for approximately 27% of all wealth created across 210 companies, a single healthcare technology firm generating more than a quarter of the dataset’s total gains.
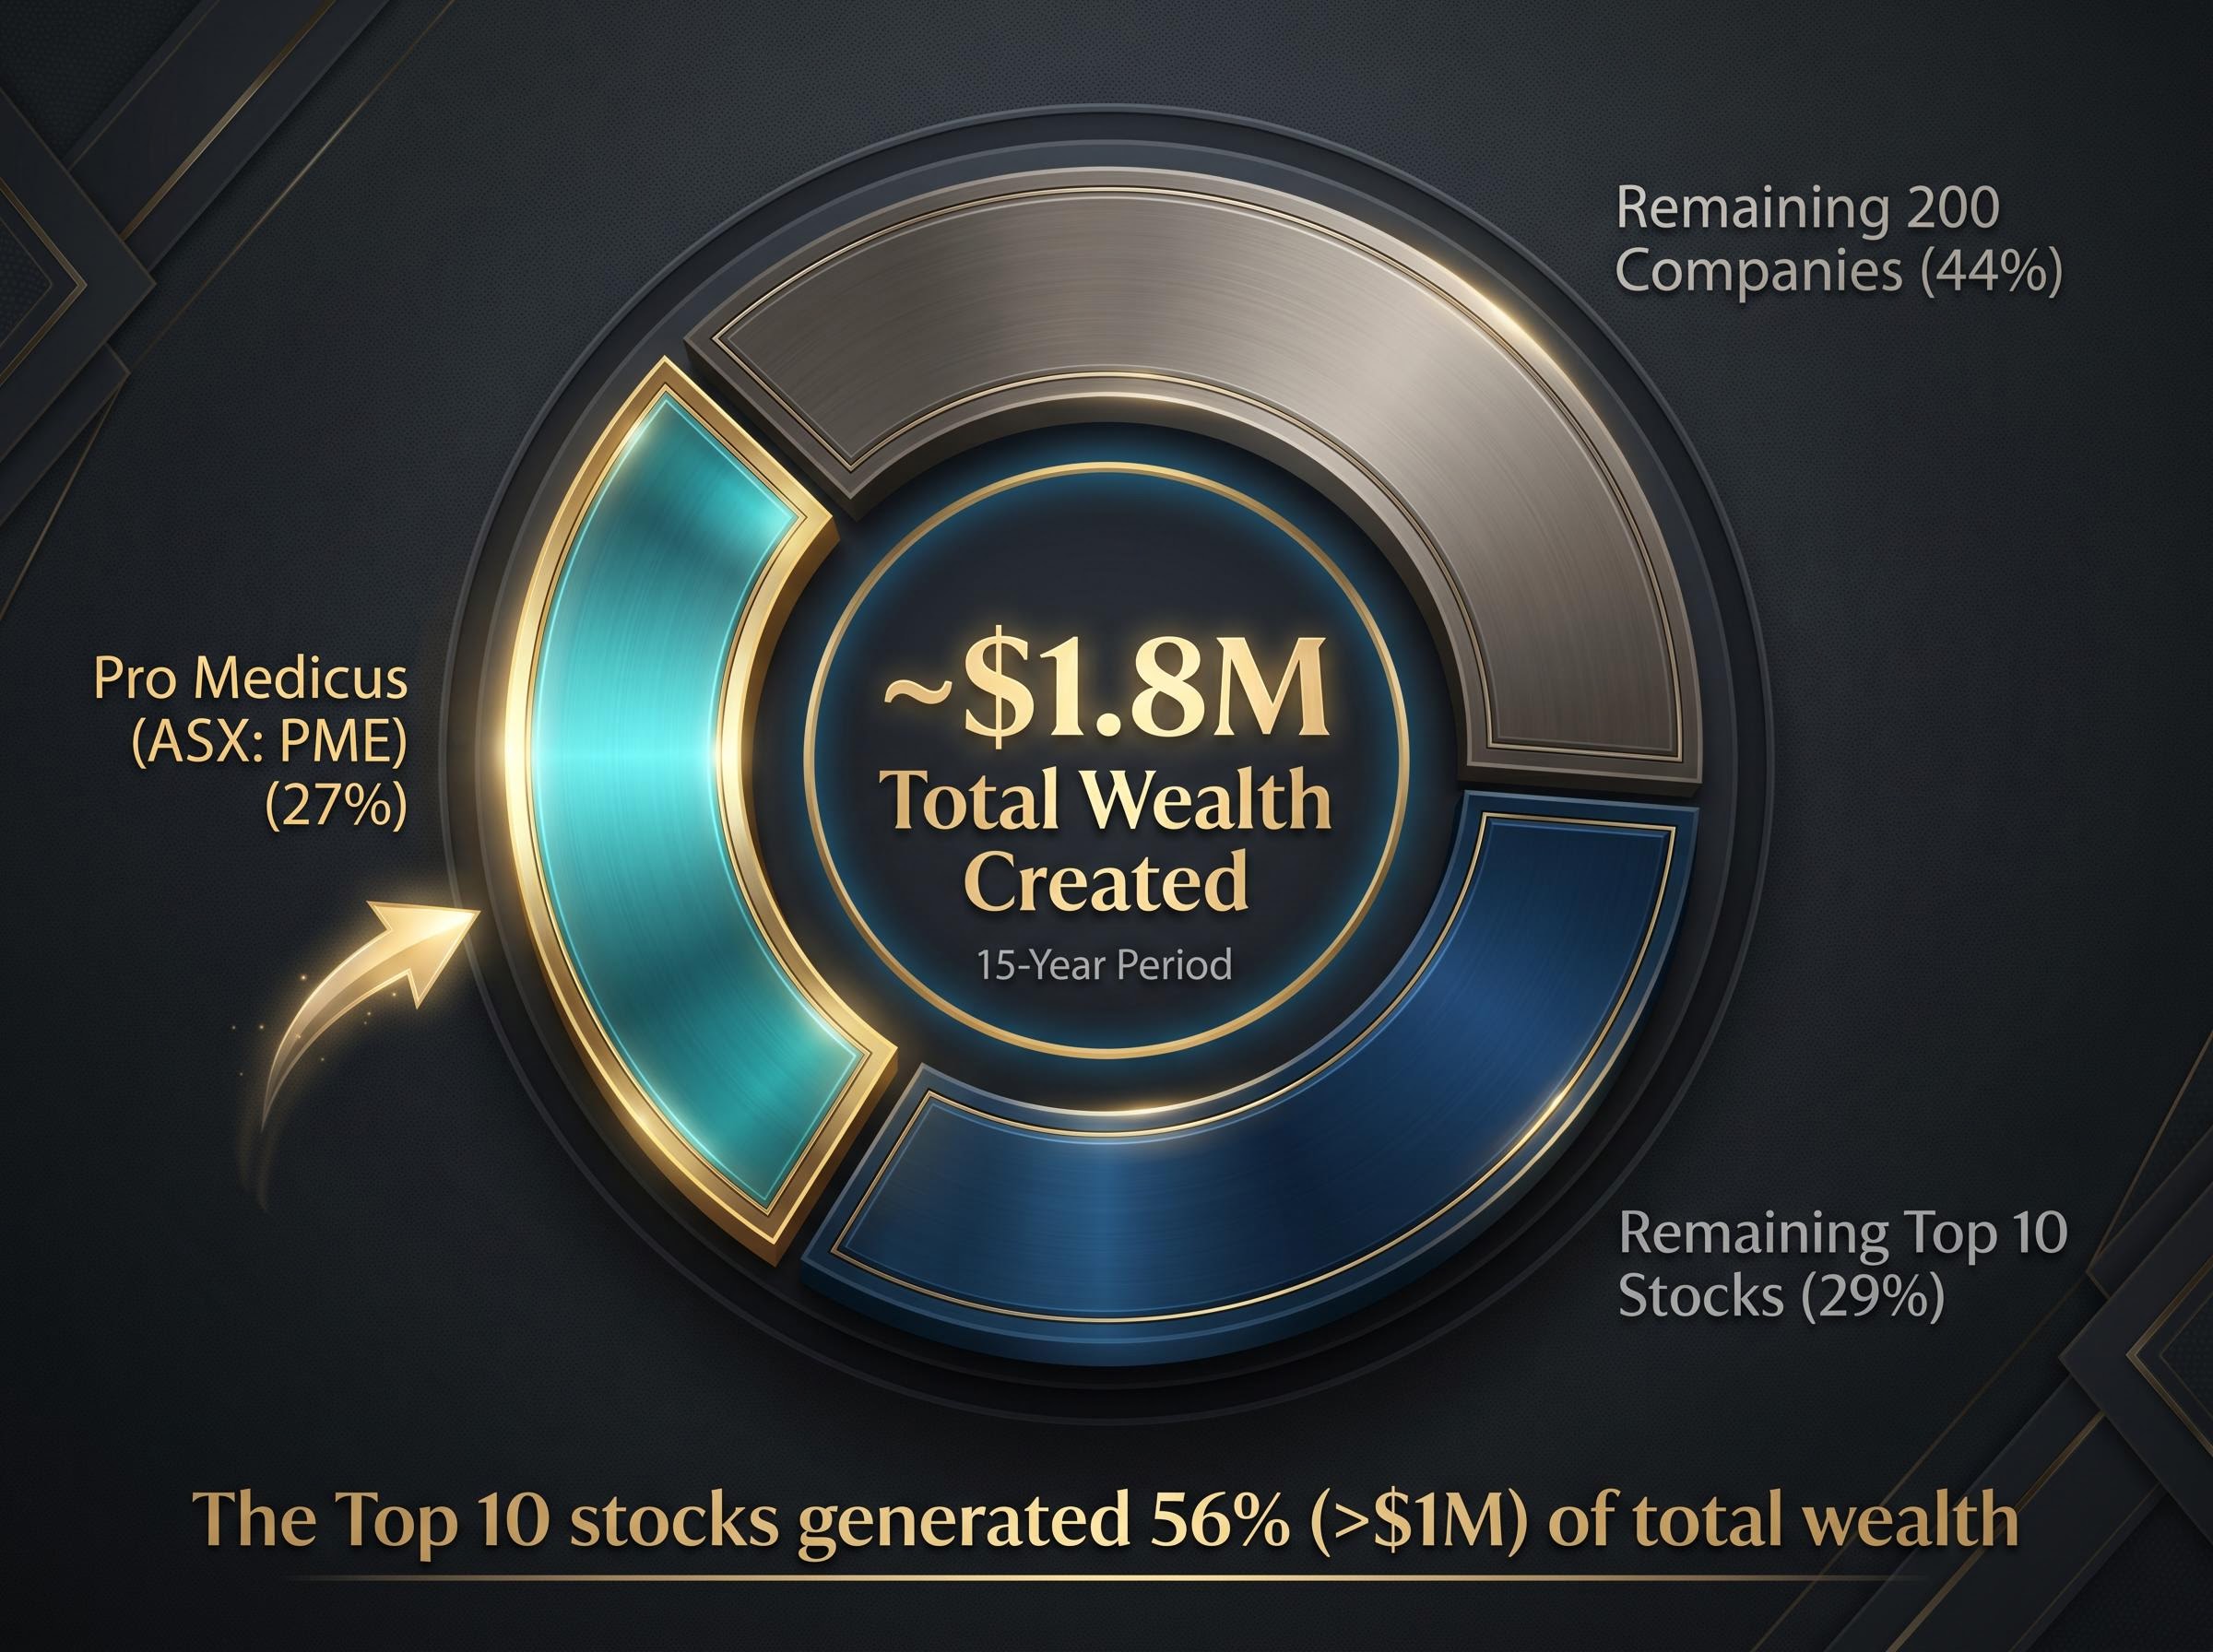
The concentration is uncomfortable in its specificity. Missing Pro Medicus alone would have reduced total portfolio wealth creation by more than a quarter. Missing the top 10 would have halved it.
The concentration pattern becomes more uncomfortable still when examined at the sector level. Many Australian retail investors hold portfolios naturally tilted toward the big four banks and large miners, often accumulated through CHESS-sponsored holdings, employer share schemes, or simple familiarity bias.
| Company | Sector | Beat ASX 300 Index |
|---|---|---|
| Macquarie | Banking | Yes |
| CBA | Banking | Yes |
| ANZ | Banking | No |
| NAB | Banking | No |
| Westpac | Banking | No |
| Fortescue | Mining | Yes |
| BHP | Mining | No |
| Rio Tinto | Mining | No |
Only Macquarie and CBA outperformed the 8.62% index benchmark among the five largest banks. Only Fortescue outperformed among the three largest miners. The household names that dominate Australian portfolio construction, ANZ, NAB, Westpac, BHP, and Rio Tinto, all trailed.
The international comparison reinforces the point. The S&P 500 returned 16.03% annually in Australian dollar terms over the same 15-year period. The ASX’s structural tilt toward banking and mining, two sectors where most individual names failed to beat even the domestic index, is cited as a contributing factor to this performance gap.
Sector familiarity, sector dominance in the economy, and even sector dividend yields did not translate to index-beating returns for the majority of the names investors know best.
The statistical reality is now visible. Beating the ASX 300 over a 15-year period required either identifying the small group of exceptional long-term winners in advance, or consistently avoiding the large cohort of underperformers, or both. The Morningstar data indicates most investors achieve neither.
Bessembinder’s original US dataset puts the challenge in even starker terms. Across the full history of US equity markets, the median stock had a buy-and-hold return of -6.87%, even as the overall market compounded at 10.10% annually. Only 48.33% of US stocks produced a positive return at all; just 41.17% outperformed Treasury bills.
The median US stock had a buy-and-hold return of -6.87%, even as the overall market compounded at 10.10% annually.
The Australian data mirrors this pattern within its survivorship-biased dataset. A meaningful proportion of the 210 large-cap companies, the best-positioned cohort on the ASX, produced negative annualised returns over 15 years. The passive alternative, the ASX 300’s 8.62% annualised return, required no stock selection at all.
Home-country bias toward ASX equities, the tendency to overweight the familiar banks and miners that dominate domestic portfolios, is now measurably shifting: international ETFs overtook domestic ETFs as the most purchased category on Selfwealth by Syfe in Q1 2026, suggesting a growing cohort of Australian investors has internalised the performance gap between the ASX and broader global indices.
Individual stock selection can rationally expect to outperform under three conditions:
Without all three, the Morningstar analysis indicates the statistical probability of success is low. The prerequisite is not conviction or market knowledge in the abstract; it is a clearly articulated selection framework that the investor can explain before buying.
Past performance does not guarantee future results. Financial projections are subject to market conditions and various risk factors.
Three findings from the Morningstar study converge on a single analytical conclusion. Return skewness is real and applies to Australian equities: 36% of the largest ASX stocks beat the index over 15 years. Index construction mechanically mitigates the drag of poor performers through cap-weighting, which is why the index outperformed both the average and median stock. And identifying which companies will be among the small group of long-run winners requires genuine analytical edge, not just sector familiarity or conviction.
The study period covered 15 years to approximately April 2026, capturing multiple market cycles including the 2020 COVID crash and recovery. The ASX 300’s 8.62% annualised return is the passive benchmark that two-thirds of large-cap stocks failed to match.
Before choosing individual stocks over an index fund, any investor should be able to answer three questions:
The data does not argue against stock selection as a strategy. It argues against stock selection without a strategy. For investors who cannot clearly articulate why they expect to beat the odds, the ASX 300’s long-term return remains a structurally sound default, delivered without any stock-picking requirement at all.
The practical decision between stocks vs index ETFs involves more than probability statistics: expense ratios, tax treatment, portfolio volatility, and the core-and-satellite framework each shape how much of a portfolio should sit in passive index exposure versus targeted individual positions for any given investor’s circumstances.
This article is for informational purposes only and should not be considered financial advice. Investors should conduct their own research and consult with financial professionals before making investment decisions.
Return skewness means that a small number of stocks generate the vast majority of market gains while most underperform. On the ASX, just 10 companies out of 210 generated 56% of total wealth created over 15 years, meaning missing those winners significantly damages portfolio returns.
Cap-weighted indexes automatically reduce exposure to underperforming companies as their market value shrinks, limiting the drag they cause on total returns. This mechanical rebalancing is why the ASX 300 returned 8.62% annually while the average individual stock in the index returned only 7.11%.
According to the April 2026 Morningstar Australia study, only 36% of the 210 largest ASX-listed companies matched or exceeded the ASX 300's annualised return of 8.62% over the 15-year study period.
Survivorship bias inflates reported figures because studies typically exclude companies that were delisted or went insolvent during the period, such as Virgin Australia in 2020. This means the true proportion of stocks that beat the index is likely lower than the already modest 36% figure reported.
The Morningstar analysis identifies three requirements: a repeatable process for identifying future winners before the market prices in their advantage, the discipline to hold through significant volatility, and portfolio construction that limits concentration in the majority of stocks that underperform the index.


