RBA Raises Cash Rate to 4.35% as 4.6% Inflation Bites
8 hrs ago

U.S. gasoline prices have reached $4.558 per gallon nationally, with West Coast drivers paying more than $5.58, as crude oil trades near $100 a barrel for the first time since the pandemic era. The cause is a single waterway. The U.S.-Iran military conflict, launched jointly with Israel in late February 2026, has effectively closed the Strait of Hormuz to normal tanker traffic, severing approximately one-fifth of global oil supply from international markets. More than two months into the fighting, peace negotiations are advancing: Iran is expected to respond to a U.S. ceasefire framework by end of day 7 May, with formal talks scheduled in Islamabad for 11-13 May. The next 72 hours could determine whether oil prices stabilise near current levels or climb well past them. What follows is a breakdown of how the conflict drove crude to its current levels, where prices could move under each scenario, and what consumers and energy investors should watch as the diplomatic window opens.
The Strait of Hormuz is a narrow corridor between Iran and Oman, roughly 21 miles wide at its tightest navigable point. Under normal conditions, approximately 20-21% of global oil supply passes through it daily, the single largest volume of crude transiting any chokepoint on Earth. When the U.S.-Iran conflict began in late February 2026, that flow stopped.
The disruption has now persisted for more than two months. In that time, the loss of Hormuz transit has removed the equivalent of roughly one in every five barrels consumed globally, a shortfall no combination of alternative routes, strategic reserves, or production increases has fully replaced.
The Hormuz closure scale has no modern parallel: the IEA estimated approximately 13 million barrels per day removed from global circulation within days of the conflict beginning, a figure that dwarfs every prior supply disruption in the IEA’s own data series.
President Trump publicly stated he anticipated prices could have reached $200-$250 per barrel at the conflict’s peak, a figure that underscores how severely markets priced the worst-case supply loss.
Global crude is priced on marginal supply. Removing 20% of transit volume from one chokepoint does not merely raise prices for the barrels that normally flow through it; it reprices all crude globally, because buyers who lose access to Gulf-origin supply compete for the same remaining barrels from West Africa, the Americas, and the North Sea.
The countries most dependent on Hormuz-transiting oil are Gulf producers (Saudi Arabia, Iraq, Kuwait, the UAE) and their largest customers across Asia, particularly China, Japan, South Korea, and India. When those buyers redirect to alternative suppliers, they bid up prices in every other producing region simultaneously.
Crude benchmarks on 7 May 2026 reflect two competing forces: the war premium built over ten weeks of conflict and the peace-talk optimism that began repricing markets over the past 48 hours.
| Benchmark | May 5 Price (approx.) | May 7 Price (approx.) | Change | Driver |
|---|---|---|---|---|
| Brent Crude | $101-$102 | $99-$102 | Down ~2% | Ceasefire optimism |
| WTI Crude | $99.81 | $94.59 | Down ~0.52% | Peace talk momentum |
Iran’s expected response to the U.S. ceasefire framework is generating sufficient optimism to partially unwind the war premium. Brent declined approximately 2% on 7 May, with some sources showing $99.11 as peace-talk sentiment strengthened.
The supply-demand imbalance underpinning current prices is more severe than spot price moves suggest: Goldman Sachs has modelled a shift from a 1.8 million barrels per day surplus in 2025 to a 9.6 million barrels per day deficit in Q2 2026, the sharpest projected swing in recent institutional forecasting.
Energy stocks are moving in the same direction. ExxonMobil, Chevron, and ConocoPhillips all fell roughly 2% on 7 May, giving back a portion of the gains accumulated since the conflict began. ExxonMobil alone had risen approximately 15% from pre-conflict levels. The simultaneous retreat in crude and energy equities illustrates how quickly market pricing can shift on a single diplomatic signal.
The negotiation has specific actors, specific deadlines, and specific unresolved disputes. Here is where each stands as of 7 May 2026.
President Trump described the U.S. position as having “prevailed” and characterised communications as reflecting “great progress,” while separately warning of resumed strikes if no agreement materialises.
The distinction between a ceasefire and a comprehensive deal matters for pricing. A ceasefire could reopen the strait within days. A full nuclear and sanctions resolution could take months. The speed of any price normalisation depends on which outcome unfolds.
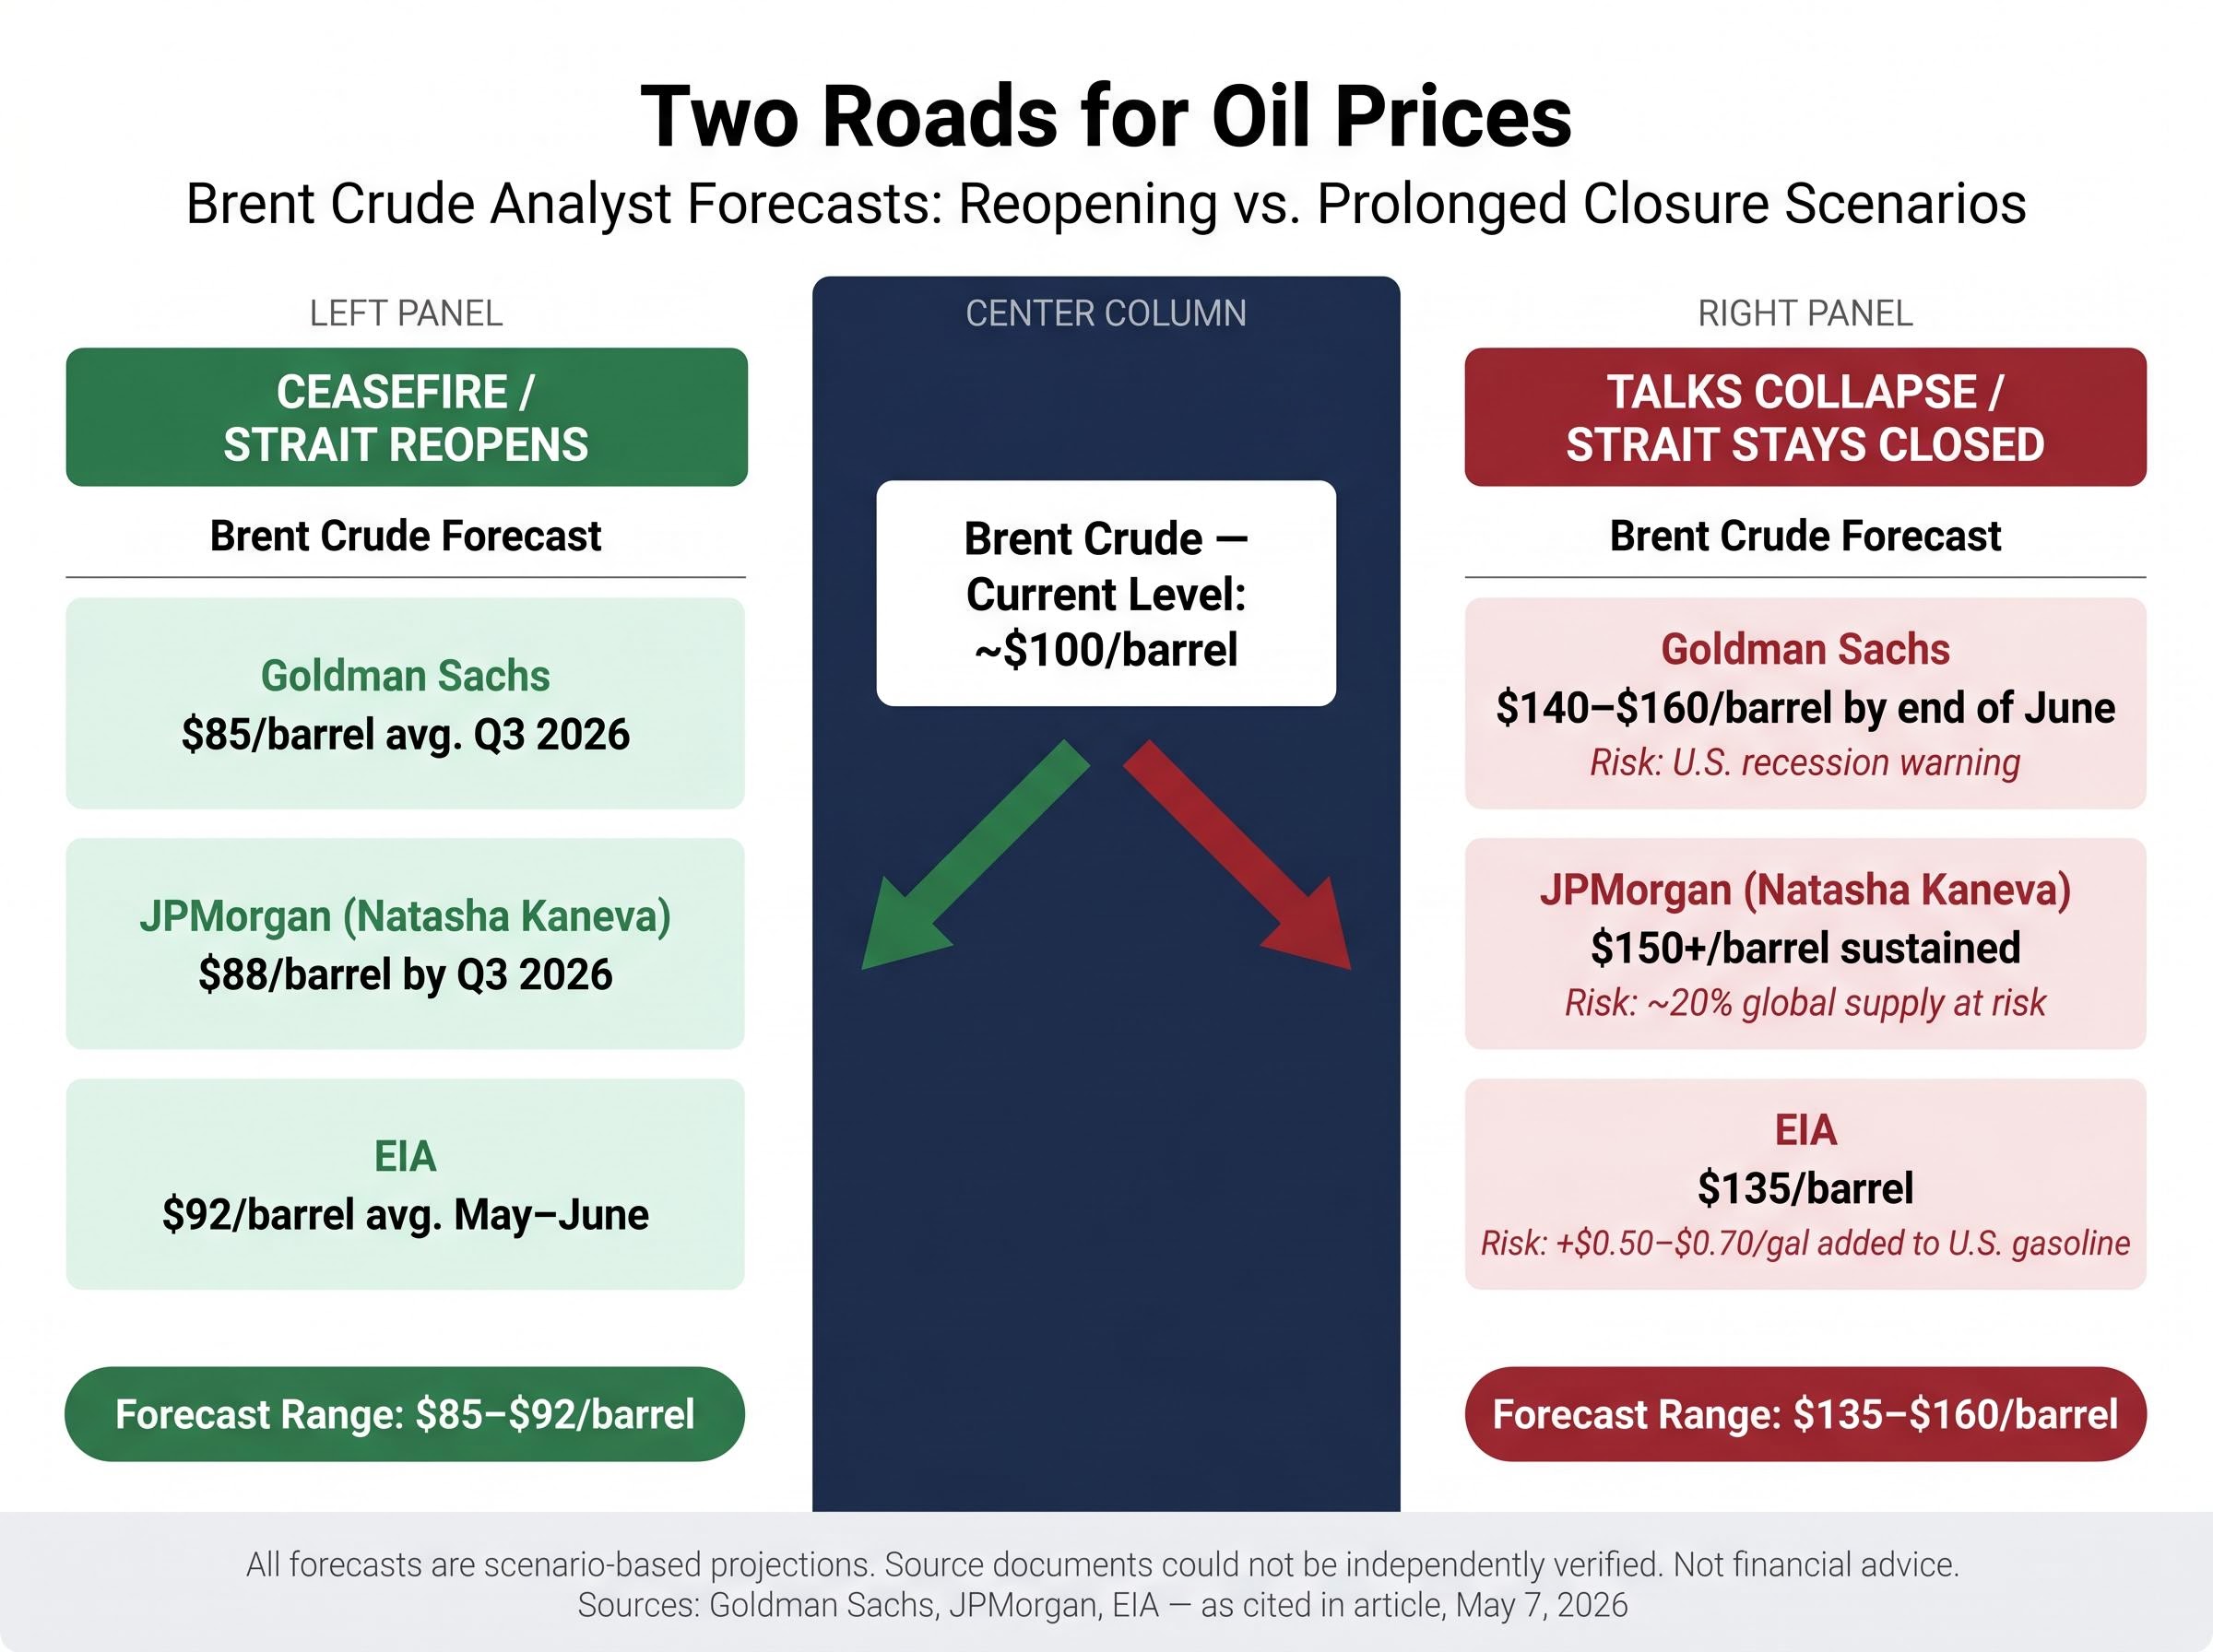
Two paths diverge from this week’s negotiations, and the price outcomes under each are separated by more than $60 a barrel. All forecasts below are scenario-based projections; source documents could not be independently verified.
| Institution | Reopening Forecast (Brent) | Collapse Forecast (Brent) | Key Additional Risk |
|---|---|---|---|
| Goldman Sachs | $85/barrel avg. Q3 2026 | $140-$160/barrel by end of June | U.S. recession risk |
| JPMorgan (Natasha Kaneva) | $88/barrel by Q3 2026 | $150+/barrel sustained | ~20% global supply at risk |
| EIA | $92/barrel avg. May-June | $135/barrel | $0.50-$0.70/gallon added to U.S. gasoline |
Goldman Sachs carries the most severe upper bound in a collapse scenario, projecting Brent could reach $160 a barrel by end of June if the strait remains closed for 30 or more days, with an explicit U.S. recession warning attached.
JPMorgan analyst Natasha Kaneva’s collapse scenario projects U.S. national gasoline prices reaching $5.50 per gallon, a figure that would exceed the 2022 peak and represent the highest sustained pump prices in American history.
The gap between an $85 reopening outcome and a $150+ collapse outcome is the single most consequential variable for energy investment decisions and household budgets over the next 60 days.
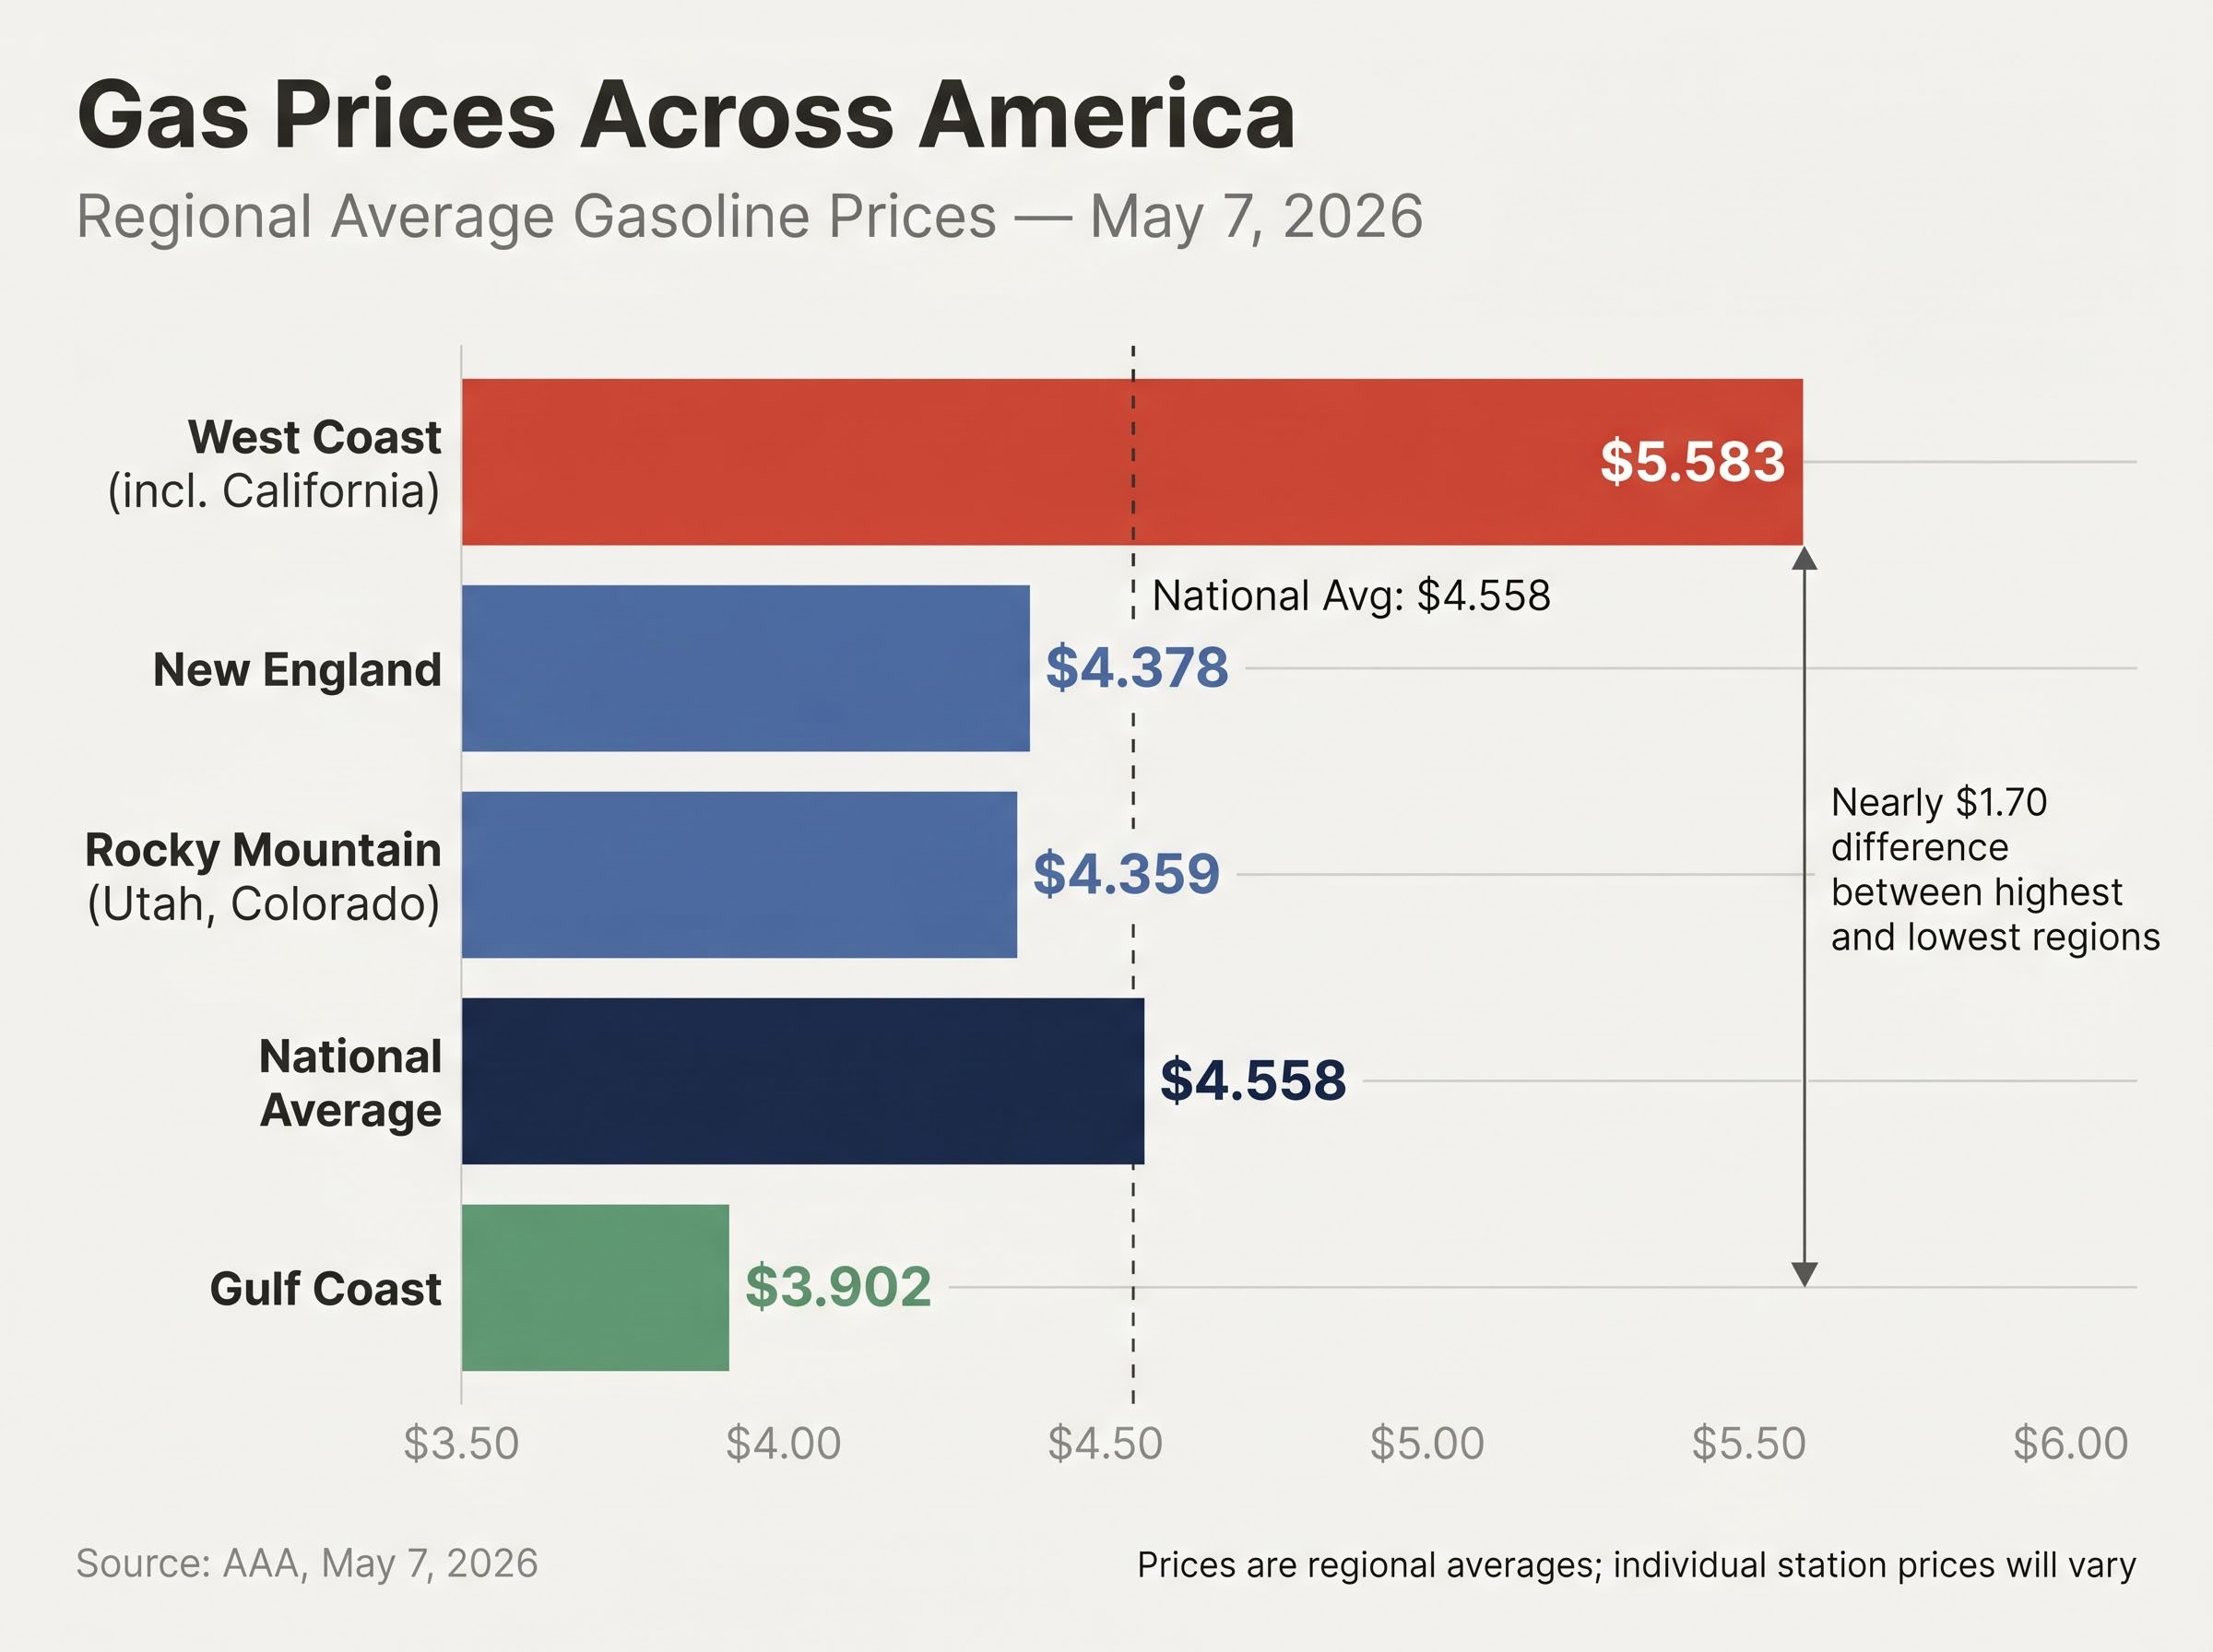
The $4.558 national average reported by AAA on 7 May 2026 is a number that almost no one actually pays. Regional variation spreads nearly $1.70 between the cheapest and most expensive markets.
The AAA state gas price averages tracker confirms the regional spread, showing West Coast consumers bearing prices more than $1.60 above the Gulf Coast average, a disparity driven by refinery capacity constraints and state-level fuel blend requirements that exist independently of the Hormuz disruption.
| Region | Avg. Gasoline Price (May 7 approx.) |
|---|---|
| West Coast (incl. California) | $5.583 |
| New England | $4.378 |
| Rocky Mountain (Utah, Colorado) | $4.359 |
| National Average | $4.558 |
| Gulf Coast | $3.902 |
Current gasoline prices are comparable to the 2022 peak levels reached during the pandemic-era supply crunch, a threshold that triggered broad consumer spending shifts at the time.
The costs extend beyond the pump:
The DOE Strategic Petroleum Reserve quick facts page shows current inventory levels sitting well below the reserve’s authorized storage capacity of 714 million barrels, a gap that limits the government’s ability to sustain high-volume releases across a multi-month disruption of the scale caused by the Hormuz closure.
For investors, the diesel price elevation signals ongoing cost pressure across goods-producing and logistics sectors that will persist regardless of near-term gasoline price movements.
A ceasefire, if reached, would set a specific sequence of events in motion:
Energy major stocks are already partially pricing a reopening. ExxonMobil, Chevron, and ConocoPhillips each fell approximately 2% on 7 May, trimming accumulated war-premium gains. ExxonMobil’s roughly 15% gain from pre-conflict levels would partially unwind further under a sustained reopening scenario.
Broader equity markets are also pricing Iran optimism. The S&P 500 and Nasdaq hit all-time highs on 6 May, driven by strong earnings and AI sector enthusiasm alongside ceasefire hopes. A collapse in negotiations could carry equity market consequences well beyond the energy sector.
The commodity rotation triggered by peace-talk signals has been as striking as the crude selloff itself: in the same session that Brent fell approximately 7.6%, gold miners gained 7.73% and copper miners rose 6.85%, illustrating that de-escalation reshuffled rather than uniformly reduced commodity exposure for energy investors watching sector positioning.
A ceasefire does not immediately restore pre-conflict price levels. Tanker rerouting contracts carry fixed terms. Insurance markets for Hormuz transit will reprice gradually, not overnight. No verifiable data on OPEC or OPEC+ production adjustments in response to the conflict is currently available, meaning the supply-side picture carries uncertainty beyond the strait variable alone.
The distinction matters: a ceasefire delivers near-term relief, but full supply normalisation likely takes months, not days. Congress is simultaneously debating war powers related to the conflict, adding a domestic political variable to the diplomatic timeline.
For readers wanting to understand the logistics of how commercial shipping could resume before a formal ceasefire, our dedicated guide to Project Freedom covers the US military’s vessel-guidance programme through the strait, including why war risk insurance normalisation and diplomatic resolution, not military logistics alone, are the decisive variables for restoring commercial transit.
Oil near $100 a barrel and gasoline above $4.50 are both direct products of the Hormuz closure. The speed of resolution is the dominant variable for what comes next. Analyst consensus points toward Brent in the mid-to-upper $80s by Q3 if the strait reopens. Prolonged closure risks $135-$160 crude and a recession warning from multiple major banks.
The signals to watch over the coming days:
These three data points will reveal, before crude prices do, which of the two scenarios is unfolding.
This article is for informational purposes only and should not be considered financial advice. Investors should conduct their own research and consult with financial professionals before making investment decisions. All analyst forecasts referenced are scenario-based projections subject to change based on market developments and diplomatic outcomes. Past performance does not guarantee future results.
The Strait of Hormuz is a 21-mile-wide waterway between Iran and Oman through which approximately 20-21% of global oil supply passes daily. When it is disrupted, all crude globally reprices upward because buyers compete for the same remaining barrels from other producing regions.
Crude oil has risen to near $100 a barrel since the U.S.-Iran conflict began in late February 2026, with Goldman Sachs modelling a swing from a 1.8 million barrels per day surplus in 2025 to a 9.6 million barrels per day deficit in Q2 2026, the sharpest projected supply swing in recent institutional forecasting.
Goldman Sachs projects Brent averaging $85 per barrel in Q3 2026 under a reopening scenario, JPMorgan forecasts $88 per barrel by Q3 2026, and the EIA projects a $92 per barrel average for May-June 2026 if the Strait of Hormuz reopens.
Retail gasoline prices typically lag crude oil movements by 2-4 weeks, as existing refined product inventory is sold through before cheaper crude flows into the refining chain.
West Coast drivers, including those in California, are paying approximately $5.583 per gallon as of 7 May 2026, more than $1.60 above the Gulf Coast average of $3.902, a disparity driven by refinery capacity constraints and state-level fuel blend requirements.


