
How to Read ASX Biotech Stocks With No Earnings to Analyse
2 hrs ago

The S&P 500 Shiller CAPE ratio reached 40.11 on 1 May 2026, a level breached only once before in recorded market history. Seven stocks now account for roughly 35% of the entire index. Hyperscalers have committed a combined $725 billion in capital expenditure for 2026 alone. And since November 2022, Nvidia has gained approximately 1,476% while Meta has climbed roughly 613%. Ask whether this constitutes a bubble in artificial intelligence equities, and the uncomfortable answer is that it depends entirely on which analytical framework is applied. Media narratives oscillate between “generational opportunity” and “dot-com redux” without equipping readers to evaluate either claim. What follows is a practical analytical toolkit: four frameworks that finance-educated investors can apply independently to weigh the evidence for and against speculative excess, and a clear account of where current conditions sit against each benchmark.
Bubbles are typically confirmed only in retrospect. Alan Greenspan warned of “irrational exuberance” in December 1996; the Nasdaq did not peak until March 2000. That four-year gap illustrates why opinions about whether a market is overheating carry limited practical value. Frameworks, by contrast, offer structured criteria that can be applied in real time.
Three categories of evidence matter when assessing speculative excess:
When multiple frameworks across these categories point in the same direction, the signal strengthens. When they disagree, the disagreement itself is informative.
Sir John Templeton observed that bull markets are born on pessimism, grow on scepticism, mature on optimism, and die on euphoria. One counterpoint worth noting from the source material: the very fact that bubble discussions are widespread may itself suggest that genuine mania has not yet formed. Frameworks help investors move beyond that kind of circular reasoning.
The Greater Fool Theory, drawn from John Kenneth Galbraith’s analytical framework, describes a market condition in which assets are purchased not for intrinsic value but on the expectation that another buyer will pay a higher price. Market peaks, under this lens, are identified by the disappearance of greater fools.
Applied to current conditions, speculative activity is visible in meme stocks, certain cryptocurrency segments, and prediction markets. These assets, however, are not concentrated on the balance sheets of systemically important financial institutions, which limits (though does not eliminate) contagion risk to the broader financial system.
Where does current AI sentiment sit on the euphoria spectrum? The available evidence suggests optimism, and perhaps greed, but not the kind of indiscriminate euphoria that preceded prior major corrections. Consider the calibration points:
Current AI valuations have not reached those extremes of detachment from any financial reality.
Signals consistent with bubble psychology:
Signals inconsistent with full mania:
The behavioural picture is mixed. Sentiment is elevated but selective, a condition that complicates the bubble thesis rather than confirming it.
The Shiller CAPE ratio divides the S&P 500’s price by its average inflation-adjusted earnings over the preceding ten years. That cyclical adjustment strips out short-term earnings distortions, making it a more reliable gauge of structural overvaluation than a standard trailing price-to-earnings ratio. As of 1 May 2026, the CAPE stood at 40.11, with the broader May 2026 reading at 39.27.
Placing the current reading within 155-year CAPE history shows that the 40-41 range has been breached only twice in recorded data, once at the dot-com peak and briefly before the 2008 financial crisis, a historical depth that the shorter trailing-PE comparison understates.
Shiller’s CAPE methodology and historical data, maintained at Yale University, provides the full construction details behind the cyclically adjusted earnings series, including adjustments for changes in corporate payout policy that affect how the ratio should be interpreted across different market eras.
John Hussman’s Market Capitalisation to Gross Value Added (GVA) metric takes a different angle, measuring total equity market value against the economy’s aggregate output. Where CAPE captures earnings-relative pricing, GVA captures economy-wide valuation. Both metrics are currently signalling levels consistent with prior bubble peaks.
GMO’s analysis characterises the current environment as an “extreme bubble” based on a two-standard-deviation divergence from the long-term trend, a threshold that has historically preceded significant corrections.
The Magnificent Seven’s combined market capitalisation grew from approximately $7-9 trillion in 2020 to around $22 trillion by April 2026, roughly a 2.5-3x increase versus approximately 2x for the remainder of the S&P 500. Their index weighting, at approximately 34-35%, matches dot-com peak concentration according to Oliver Wyman’s January 2026 analysis.
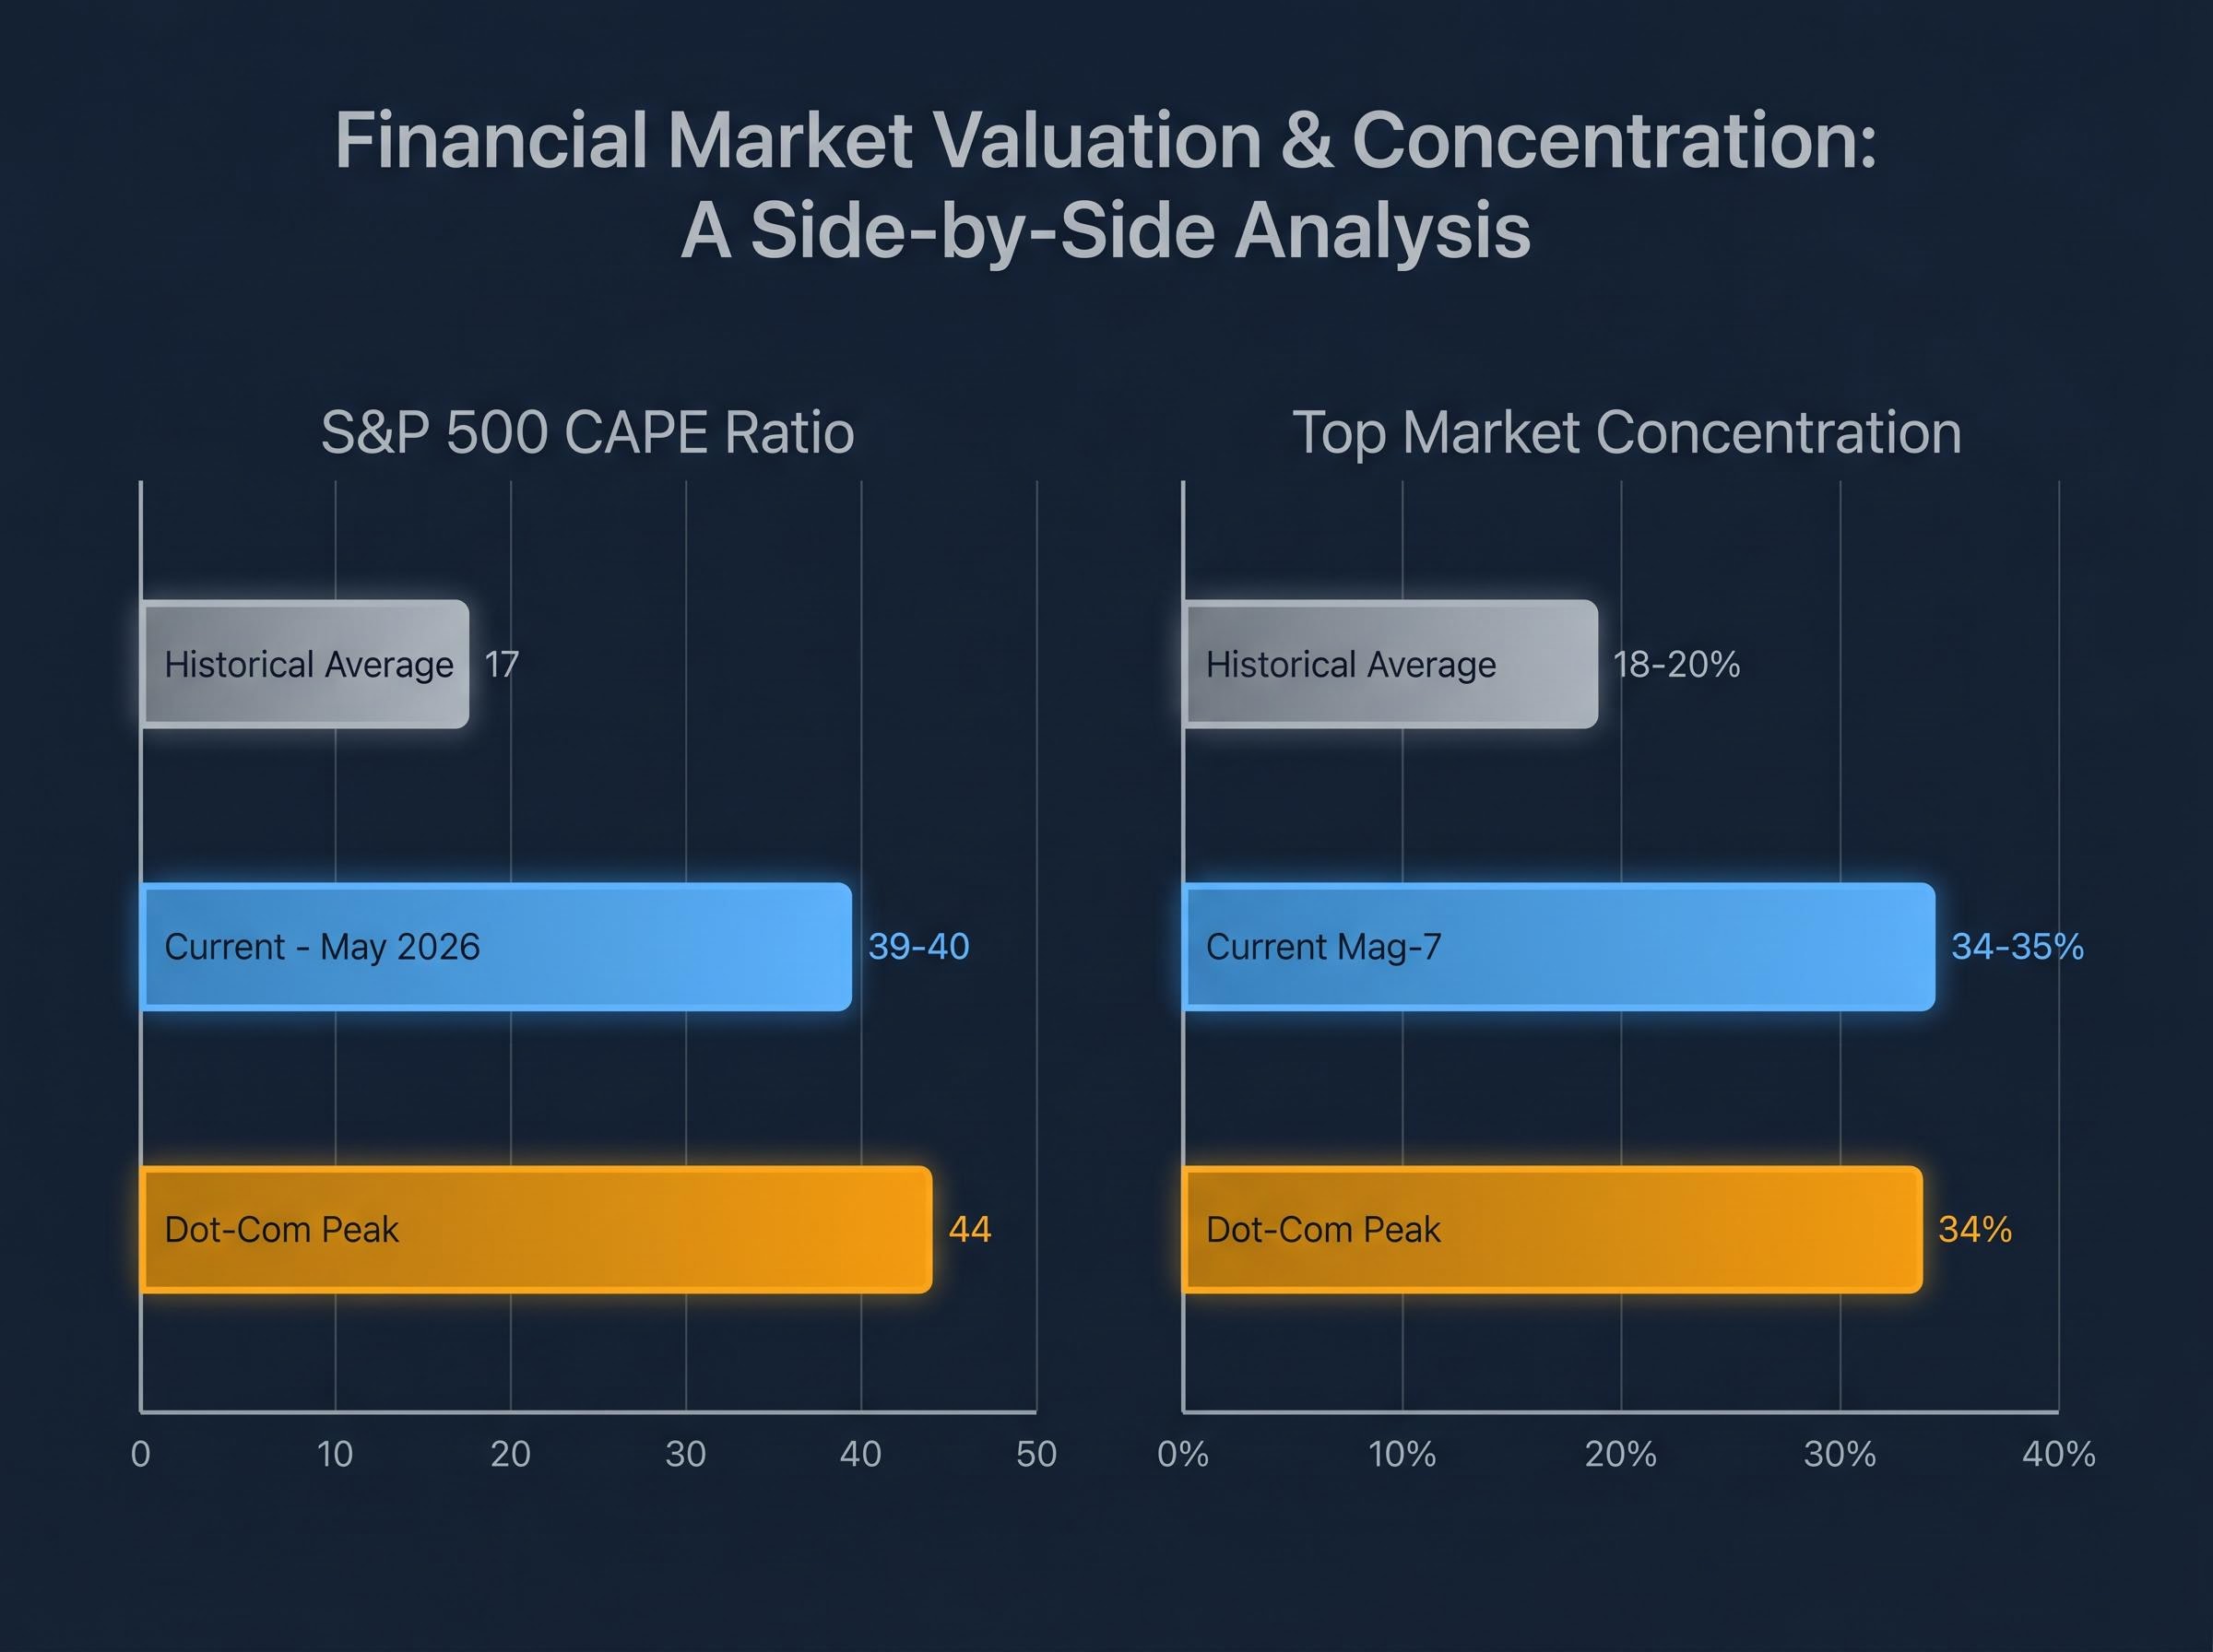
| Metric | Current Reading | Dot-Com Peak | Historical Average | Signal Direction |
|---|---|---|---|---|
| S&P 500 CAPE Ratio | 39-40 | ~44 | ~17 | Elevated; approaching prior peak |
| Mag-7 Index Concentration | ~34-35% | ~34% | ~18-20% | Matching dot-com concentration |
The “this time is different” counterargument carries partial weight. The dot-com era featured triple-digit revenue multiples for companies with negative operating margins, a threshold not yet breached in the current cycle. Cash-rich technology balance sheets represent a structural difference from 2000. These distinctions matter, but they speak to severity, not direction. The quantitative signal remains firmly elevated.
Hyman Minsky’s financial instability hypothesis describes how economies move through three stages of financing, each more fragile than the last. The framework is not a checklist; it is a map with a direction of travel.
Minsky’s 1992 financial instability hypothesis, published through the Levy Economics Institute of Bard College, lays out in his own words how economies transition from stable hedge-financing relationships to progressively fragile speculative and Ponzi structures, a progression the current AI investment cycle is replicating in measurable form.
The hyperscaler CapEx trajectory extends beyond 2026: Q1 2026 alone saw $130 billion deployed across Amazon, Microsoft, Alphabet, and Meta, with the combined annual run rate on course toward $1 trillion by 2027, which amplifies the revenue-justification question at the heart of the Minsky speculative financing assessment.
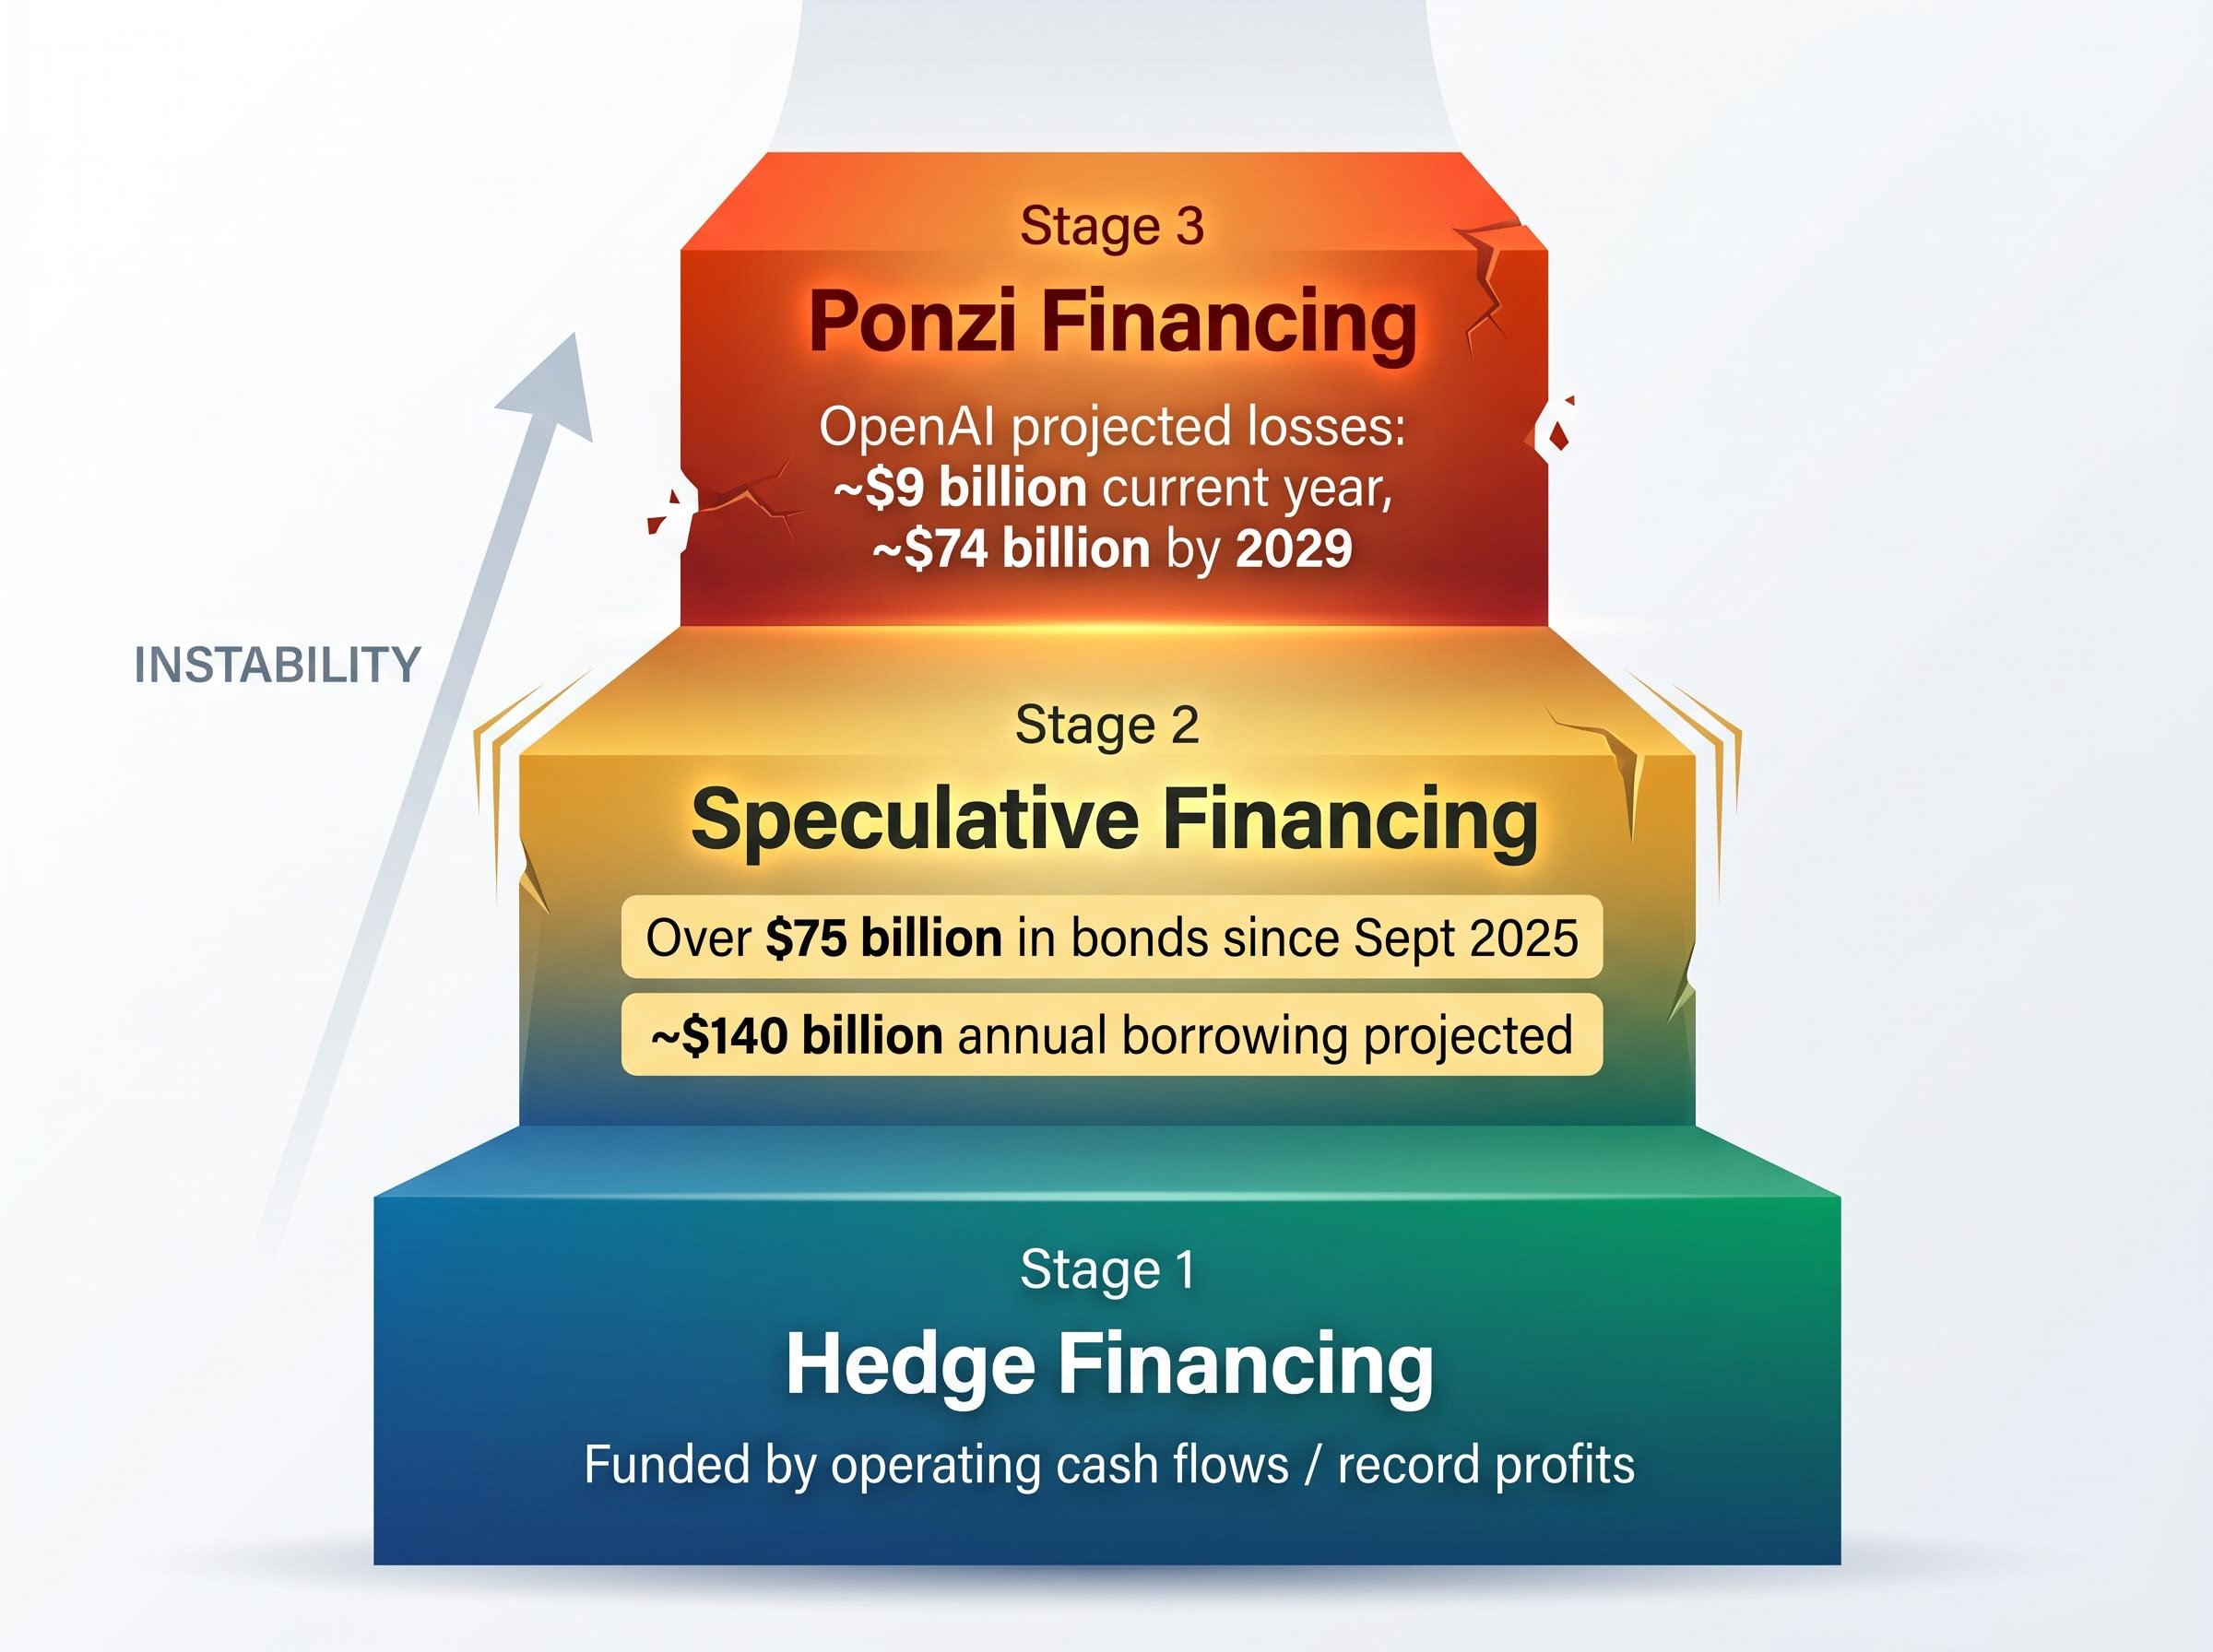
Minsky Moment: The point at which borrowers can no longer cover interest obligations and rely entirely on asset price appreciation for debt service, triggering forced selling and a self-reinforcing decline.
OpenAI’s projected losses of approximately $9 billion in the current year, expected to reach roughly $74 billion by 2029, represent the most visible case of a financing structure that depends on future revenue materialisation rather than current cash generation. Oliver Wyman estimates a potential $33 trillion equity loss if a dot-com-scale correction materialises.
The honest reading is that the AI investment cycle sits in the speculative financing stage, with isolated pockets displaying characteristics closer to Ponzi-stage dynamics. The direction of travel matters more than the current coordinate.
Four frameworks have been applied. They do not agree.
| Framework | Current Signal | Bubble Confirmed? | Key Caveat |
|---|---|---|---|
| CAPE / Hussman GVA | Two-sigma divergence from long-term trend | Consistent with bubble | Valuations can remain elevated for years before correcting |
| Minsky Stages | Speculative financing stage | Not yet (Ponzi threshold not breached) | Direction of travel is toward greater fragility |
| Greater Fool / Sentiment | Optimism with speculative pockets | No broad euphoria detected | Absence of euphoria may indicate room to run, or may mean correction arrives without warning |
| Concentration / Structural | Matching dot-com peak levels | Consistent with bubble | Cash-rich balance sheets differ from 2000; AI adoption is real, if not yet ROI-positive |
GMO acknowledges that the bubble lacks classic top signals: no speculative stock collapse, no sustained quality-over-growth rotation, no market slowdown. This absence cuts both ways, potentially indicating more room to run or meaning the correction arrives without the usual advance warning.
The Yale Cowles study detected clear AI-driven bubbles in the Nasdaq and six of the Magnificent Seven (excluding Apple), with Nvidia and Microsoft exhibiting the longest bubble durations. The March 2026 S&P 500 pullback of approximately 7%, led by AI stocks, produced no sustained quality-over-growth rotation in its aftermath.
Semiconductor concentration has reached a structural extreme that sits alongside CAPE and GVA as an independent warning signal: semiconductor companies accounted for 13% of total US equity market value in April 2026, a level that surpassed dot-com era concentration in that sub-sector and amplifies the directional risk already visible in the broader index.
The scale of committed capital requiring eventual revenue justification is substantial. McKinsey estimates $5.2-6.7 trillion in AI infrastructure spending through 2030; Goldman Sachs estimates $3-4 trillion. These figures represent bets on revenue streams that have not yet materialised at scale, financed increasingly through debt rather than cash flows.
The structural counterarguments are genuine. Cash-rich technology balance sheets, demonstrated (if not yet ROI-positive) AI product adoption, and the distinction between infrastructure-layer companies and zero-revenue dot-com analogues all complicate a clean bubble verdict. The internet was real in 1999. Dot-com valuations were still unjustifiable.
Bubbles are verifiable only in retrospect. The investor’s task is not to call the top but to calibrate portfolio exposure to the probability distribution that multiple frameworks collectively imply.
The rebalancing logic is straightforward. If equities have grown from 60% to 70% of a portfolio through appreciation, rebalancing back to 60% captures gains while reducing exposure to a market where CAPE, concentration, and financing-structure indicators all signal elevated risk. This is not a prediction. It is a framework-grounded action.
Concentration risk deserves specific attention. Passive index investment mechanically amplifies Magnificent Seven exposure: every dollar flowing into an S&P 500 index fund allocates roughly 35 cents to seven stocks. Investors who have not reviewed their index fund holdings may carry more AI-thematic concentration than they realise.
Three concrete portfolio review actions:
Investors wanting to work through the execution mechanics in detail will find our dedicated guide to portfolio rebalancing after an equity rally covers the specific drift thresholds that trigger a rebalance, the tax-efficient sequencing of sales across account types, and the alternative asset destinations best suited for trimmed equity positions in 2026.
The February 2026 software selloff illustrated that capital is rotating within AI (from disrupted software companies to infrastructure beneficiaries) rather than exiting the theme entirely. Intra-sector positioning matters as much as aggregate AI exposure. Hyperscalers committing up to $725 billion in combined CapEx for 2026 alone require potentially generational revenue streams to justify that expenditure.
This article is for informational purposes only and should not be considered financial advice. Investors should conduct their own research and consult with financial professionals before making investment decisions. Past performance does not guarantee future results. Financial projections are subject to market conditions and various risk factors.
The value of CAPE, Minsky, Hussman’s GVA, and the Greater Fool framework is not that they predict timing. It is that they reveal structural conditions shifting the risk-reward calculus regardless of when a correction occurs.
The absence of euphoria and the presence of genuine AI technological progress are real moderating factors. Neither invalidates elevated valuation risk.
Investors who apply frameworks consistently are better positioned than those who either dismiss bubble concerns entirely or act on media-driven panic. The AI investment cycle may still have significant distance to run, or the correction may arrive without the classic warning signals that preceded prior market peaks. The frameworks do not resolve that uncertainty. They quantify it.
“Bull markets are born on pessimism, grow on scepticism, mature on optimism, and die on euphoria.” Sir John Templeton’s observation remains the simplest behavioural calibration available. By that measure, the current cycle reads as somewhere between optimism and greed, a stage that warrants vigilance rather than either complacency or alarm.
The Shiller CAPE ratio divides the S&P 500's price by its average inflation-adjusted earnings over the preceding ten years, smoothing out short-term distortions. As of 1 May 2026, it stood at 40.11, a level breached only once before in recorded market history, making it one of the strongest quantitative signals of elevated valuation risk in the current AI-driven market.
Based on Minsky's framework, the AI investment cycle currently sits in the speculative financing stage, where borrowers cover interest from cash flows but must refinance principal through external credit markets. Hyperscalers have issued more than $75 billion in bonds since September 2025, consistent with this stage, though the Ponzi financing threshold has not yet been clearly breached.
The Magnificent Seven account for approximately 34-35% of the entire S&P 500 index as of early 2026, matching the peak concentration levels seen during the dot-com era according to Oliver Wyman's January 2026 analysis. This means every dollar invested in an S&P 500 index fund allocates roughly 35 cents to just seven stocks.
Investors should review their index fund holdings to check Magnificent Seven concentration, rebalance if equity weighting has drifted above their intended target through appreciation, and consider alternative asset classes such as private credit or market-neutral strategies to reduce correlation to AI-thematic equities.
A Minsky Moment is the point at which borrowers can no longer cover interest obligations and rely entirely on rising asset prices for debt service, triggering forced selling and a self-reinforcing decline. While the AI cycle has not yet reached Ponzi-stage financing, the direction of travel toward greater fragility, combined with over $725 billion in committed hyperscaler CapEx for 2026 alone, means the risk cannot be dismissed.