Societe Generale’s strategists say the risk-reward on Chinese equities has improved, most clearly in onshore China tech stocks. The CSI 300 fell about 8.5% in October 2026, which widely reported coverage called its worst month in more than a decade. Other reviews put the drop at 7.6%-7.8%, and parts of the market still trade at multiples far above their US peers.
That gap is the problem with the “cheap after the sell-off” story. The pullback has prompted investors to ask whether Beijing will step in again and whether the floor under the market is real or simply hoped for.
As of 5 November 2026, there is evidence on both sides. If you buy because you believe in a floor, you are protected against some outcomes and fully exposed to others.
This analysis separates what the policy floor protects (the market from disorderly, panic-driven selling) from what it leaves alone (company earnings). You will also see where onshore tech, as opposed to the internet giants, could sit in your portfolio.
Is the policy floor real? What the evidence shows
Societe Generale’s case rests on two pillars. The first is purchases by the National Team, a group of state-linked funds that buy shares to steady the market. The second is the return of incentives for companies to buy back their own shares. In the bank’s view, these steps together strengthen the belief that authorities have a line they will defend.
National Team buying
The first signal came from exchange-traded funds (ETFs), which are baskets of shares that trade like a single stock. A group of nine ETFs favoured by the National Team reportedly drew RMB76.7 billion in one day. That would be the basket’s second-largest inflow on record, although the figure has not been independently confirmed.
Goldman Sachs said state ETF buying began around mid-October and has since picked up. Cumulative inflows over the past two weeks exceeded the whole of April 2025.
Goldman Sachs, 5 November 2026: The market appears to have reached a “policy bottom.”
Estimates of the total vary. Bloomberg Industry Research put purchases at about US$15 billion between 9 and 20 October. The South China Morning Post cited as much as RMB170 billion for October as a whole. The two estimates cover different windows and use different methods, so you should treat them as separate readings rather than as a contradiction.
Buyback incentives and liquidity tools
The buying has come alongside cheaper financing and regulatory pressure on companies to support their own share prices.
| Measure | Latest reported terms | Source/date |
|---|---|---|
| PBOC buyback and share-purchase relending | Rate cut from 1.25% to 1%; moving toward a longer-term mechanism | PBOC-related reporting, 2-4 Nov 2026 |
| Relending quota applications | Bank applications above RMB200 billion | PBOC via Reuters, 4 Nov 2026 |
| Swap facility for brokers, funds and insurers | 31 firms applied for more than RMB100 billion | Goldman Sachs, 5 Nov 2026 |
| CSRC guidance | Index constituents and leading tech firms urged to conduct buybacks | CSRC statement, 2 Nov 2026 |
Taken together, these measures form a coordinated toolkit rather than a one-off rescue. They tell you that authorities will act when markets come under stress, which lowers the odds of a disorderly collapse in your onshore holdings. They say nothing about when earnings will recover.
The relending facilities behind the buyback tools sit inside a wider credit architecture in which state-owned banks direct lending toward policy priorities, and the PBOC steers that system through window guidance, reserve requirements and targeted programmes.
When big ASX news breaks, our subscribers know first
How far does a floor go? History and the sceptics
Past interventions show the limits of that confidence. Beijing has defended its market before, and each time the support steadied prices without quickly restoring them to earlier highs.
- 2015: The Shanghai Composite fell more than 40% in about two and a half months. Goldman estimated the National Team spent RMB860-900 billion in June and July. Reuters reported it took more than five years for the CSI blue-chip index to regain its peak.
- Early 2024: Central Huijin stepped up its ETF purchases and prices stabilised. Analysts warned at the time that property weakness and low confidence persisted.
- September 2024: Large liquidity facilities and cheaper buyback borrowing returned. According to KraneShares, today’s measures closely resemble that episode.
Each episode follows the same pattern. Intervention stopped the panic but did not, on its own, produce a new bull market.
That is the core of the debate today. Goldman’s view is constructive, though the bank adds that a durable recovery still needs better trading volume. Macquarie and Julius Baer, cited by the SCMP on 28 October, argue that intervention can steady prices for a while, but lasting gains depend on corporate earnings and domestic demand, and both remain weak.
Weak domestic demand is visible in the data: retail sales grew just 0.4% in August while exports surged on AI-linked chip shipments, and falling household property wealth limits how quickly consumption can recover.
There is also a behavioural risk. Investors may front-run state buying or come to rely on it. If that happens, rallies become fragile once the purchases slow. Even Societe Generale does not claim that support guarantees an immediate recovery in earnings.
The synthesis: A credible floor against disorderly selling exists. A guaranteed valuation or earnings floor does not.
For your portfolio, this means treating the floor as protection against tail risk, the rare but severe losses at the extreme end of possible outcomes. It is not a forecast of fast gains, so size your positions with that in mind.
Valuations after the sell-off: cheap market, expensive pockets
If the floor limits how far prices can fall, valuation decides how much you are paying for what is left. On that measure, the onshore market looks cheap at first glance.
First, a quick definition. A price-to-earnings (P/E) ratio shows how many dollars investors pay for each dollar of company profit. A trailing P/E uses profits already reported over the past 12 months. A forward P/E uses analysts’ estimates of future profits. If profits are expected to grow, the forward figure usually comes out lower.
The sources mix these two measures, which is where the trap lies.
| Segment | Valuation | Basis | Source/date |
|---|---|---|---|
| MSCI China | 9.7x | 12-month forward | Market review, 23 Oct 2026 |
| CSI 300 | 12.0x | 12-month forward | Market review, 23 Oct 2026 |
| China A-shares | About 13.4x | Forward | Premia Partners, 23 Oct 2026 |
| CSI All-Share IT | 59x FY2026E; 48x FY2027E | Forward | FSM Global, 17 Oct 2026 |
| STAR 50 | About 100x (peak near 250x) | Trailing | Reuters, 26 Oct 2026 |
| Nasdaq 100 tech proxy | About 30x | Trailing | Reuters, 26 Oct 2026 |
Note: these figures are not directly comparable. Forward and trailing multiples use different earnings bases, and the sources use different dates.
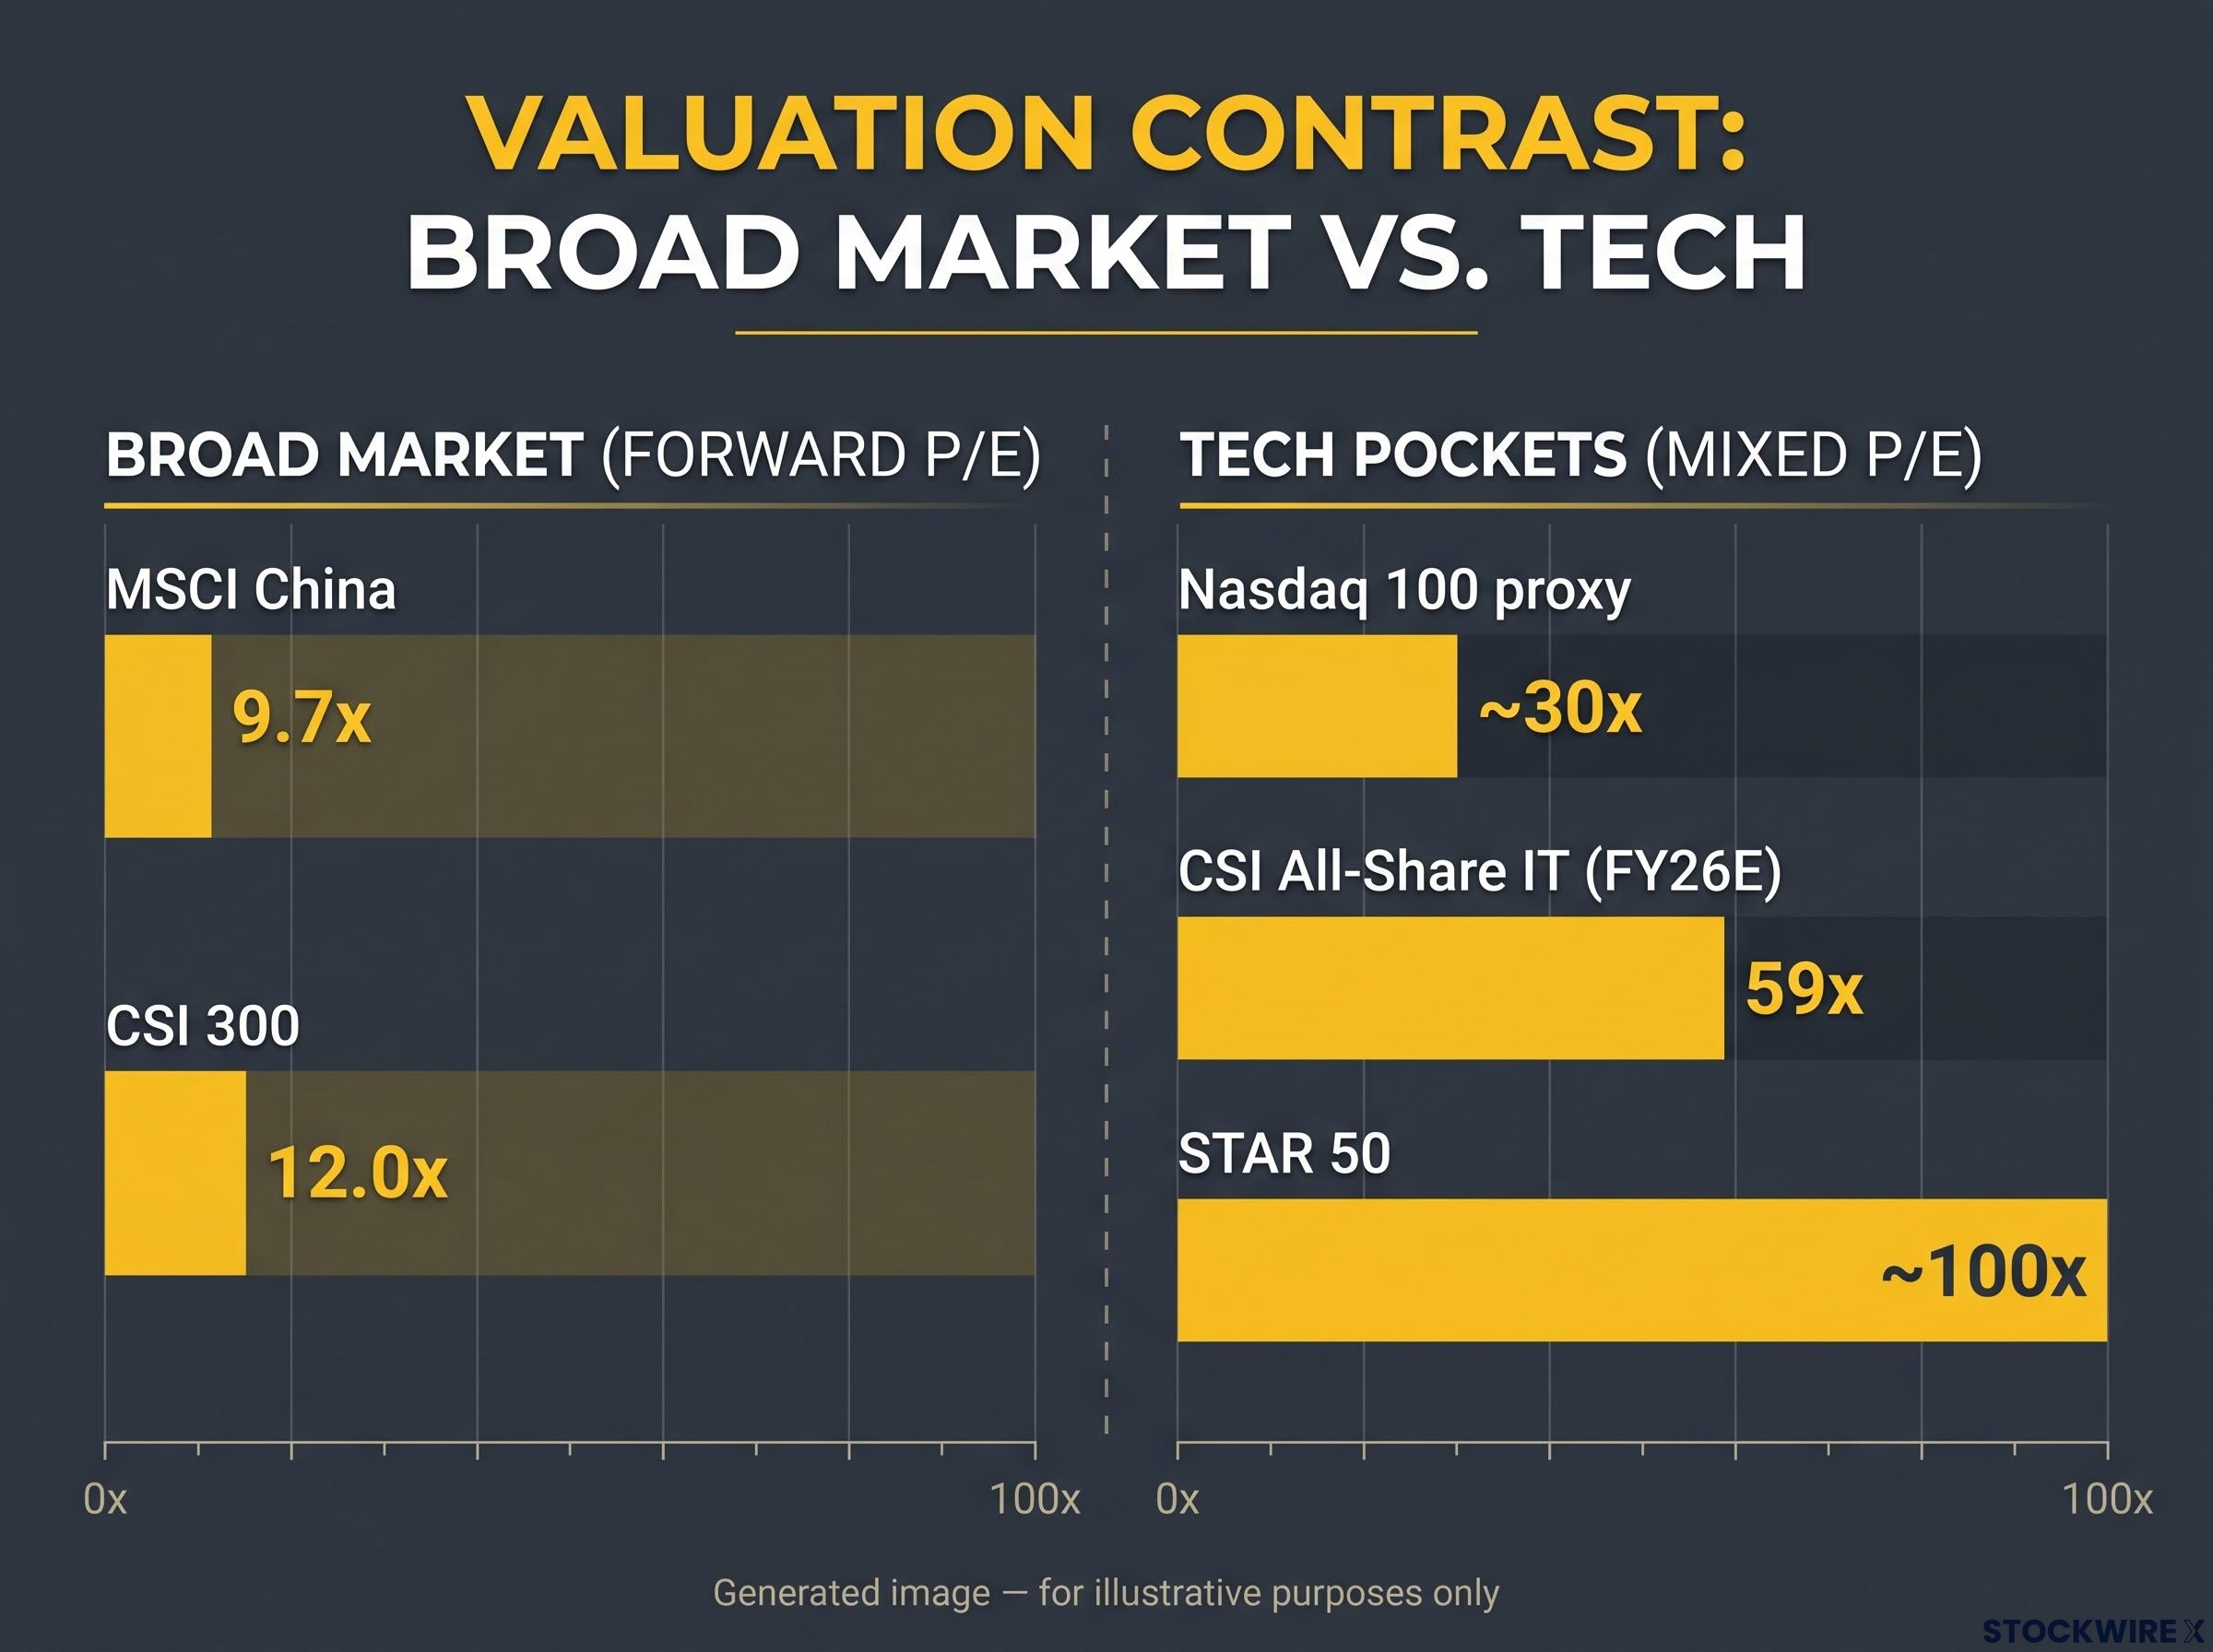
The broad market tells one story. At about 10-13x forward earnings, large onshore and offshore indices look inexpensive.
Part of the gap between broad large-cap multiples and tech pockets comes down to index composition: Kospi and Taiwan are anchored by chipmakers, while the CSI 300 holds mostly banks, industrials and consumer names, so broad exposure delivers little direct AI hardware.
The technology segments tell another. The STAR 50, China’s growth and semiconductor board, sits roughly 40% below its midyear high, and its multiple has fallen from nearly 250x to about 100x. On a like-for-like trailing basis, that is still more than three times the Nasdaq proxy. The Hang Seng Tech index also fell 11.7% in October in one review.
So the correction did trim excess valuations, as Societe Generale says, but it did not make onshore AI cheap. “Improved risk-reward” applies unevenly. Broad large caps look inexpensive, while parts of onshore AI still price in a great deal of growth. That difference should shape whether you choose broad exposure or a concentrated tech bet.
Why China tech stocks track US hyperscalers, and why onshore tech may still diversify
Valuation is only half the picture for the tech names. The other half is what moves them, and in the near term the answer often lies in the US. Hyperscalers are the giant cloud and data-centre operators, such as Amazon, Microsoft and Alphabet.
The near-term link
Chinese AI internet stocks are connected to the US AI trade through three channels:
- Global AI sentiment: Investors treat AI as one global theme, so a sell-off in US AI stocks tends to cut exposure across the whole group.
- Shared capex and demand signals: US capital expenditure, or capex (spending on assets such as data centres), acts as a live signal of demand for chips and cloud capacity.
- Chip and infrastructure economics: Chinese platforms depend on the cost and availability of advanced computing equipment.
J.P. Morgan estimates that five US hyperscalers are on track for about US$1 trillion of AI capex in 2026. Chinese platforms are spending heavily too:
- Alibaba: About RMB380 billion planned over 2026-29; quarterly capex up 75% to RMB67.68 billion
- Tencent: First-half capex of RMB96.3 billion, up from RMB45.9 billion; June-quarter AI and computing capex up 176%
- Baidu: No current company-specific capex target found
- Aggregate: Rhodium Group estimates an implied RMB932 billion of Chinese AI infrastructure capex in 2026; Alibaba, Tencent and Baidu together spent RMB208 billion in the first half
This is why Societe Generale expects AI internet platforms to benefit near term if US hyperscalers rebound.
The longer-term diversification case
Over a longer horizon, the bank’s preference for onshore tech rests on different foundations. Its earnings depend more on industrial automation, semiconductors, telecom infrastructure, government-backed innovation and demand from Chinese businesses. Those drivers sit apart from the US mega-cap AI complex at a time when investors increasingly question whether the global AI build-out can keep its current pace.
The thesis has limits. Rhodium describes the broader pattern as heavy capex paired with negative cash flows. Proposed Chinese rules would also identify 23 AI-related technologies for restriction or approval.
What this tells you is that the AI link that lifts these stocks now also ties them to US AI sentiment risk. Any diversification benefit comes mainly from onshore sectors, not from the internet platforms.
For readers weighing AI monetisation risk, our detailed coverage of China’s AI rollout timing draws on a CIO survey showing nearly half of enterprises targeting 2027 for first deployments.
What to weigh before adding China tech stocks
The evidence points in one direction, with caveats. Risk-reward has improved, mainly because tail risk is lower and valuations have been trimmed. Earnings, domestic demand and AI monetisation will decide whether any gains last. Societe Generale’s preferred exposures remain technology, onshore China and large caps, while Macquarie and Julius Baer warn that weak earnings and demand still cap the upside.
Five variables are worth tracking:
- Trading volume: Goldman’s stated condition for a durable recovery.
- Pace of state buying: A slowdown would test how much of the rally is self-sustaining.
- Earnings: The signal the floor cannot supply.
- Capex versus cash flow: Whether AI spending starts to pay its way.
- Export controls: New restrictions in either direction.
The floor helps you decide when to enter and how much to commit. It is not a reason to expect a rally.
This article is for informational purposes only and should not be considered financial advice. Investors should conduct their own research and consult with financial professionals before making investment decisions. Past performance does not guarantee future results. Financial projections are subject to market conditions and various risk factors.