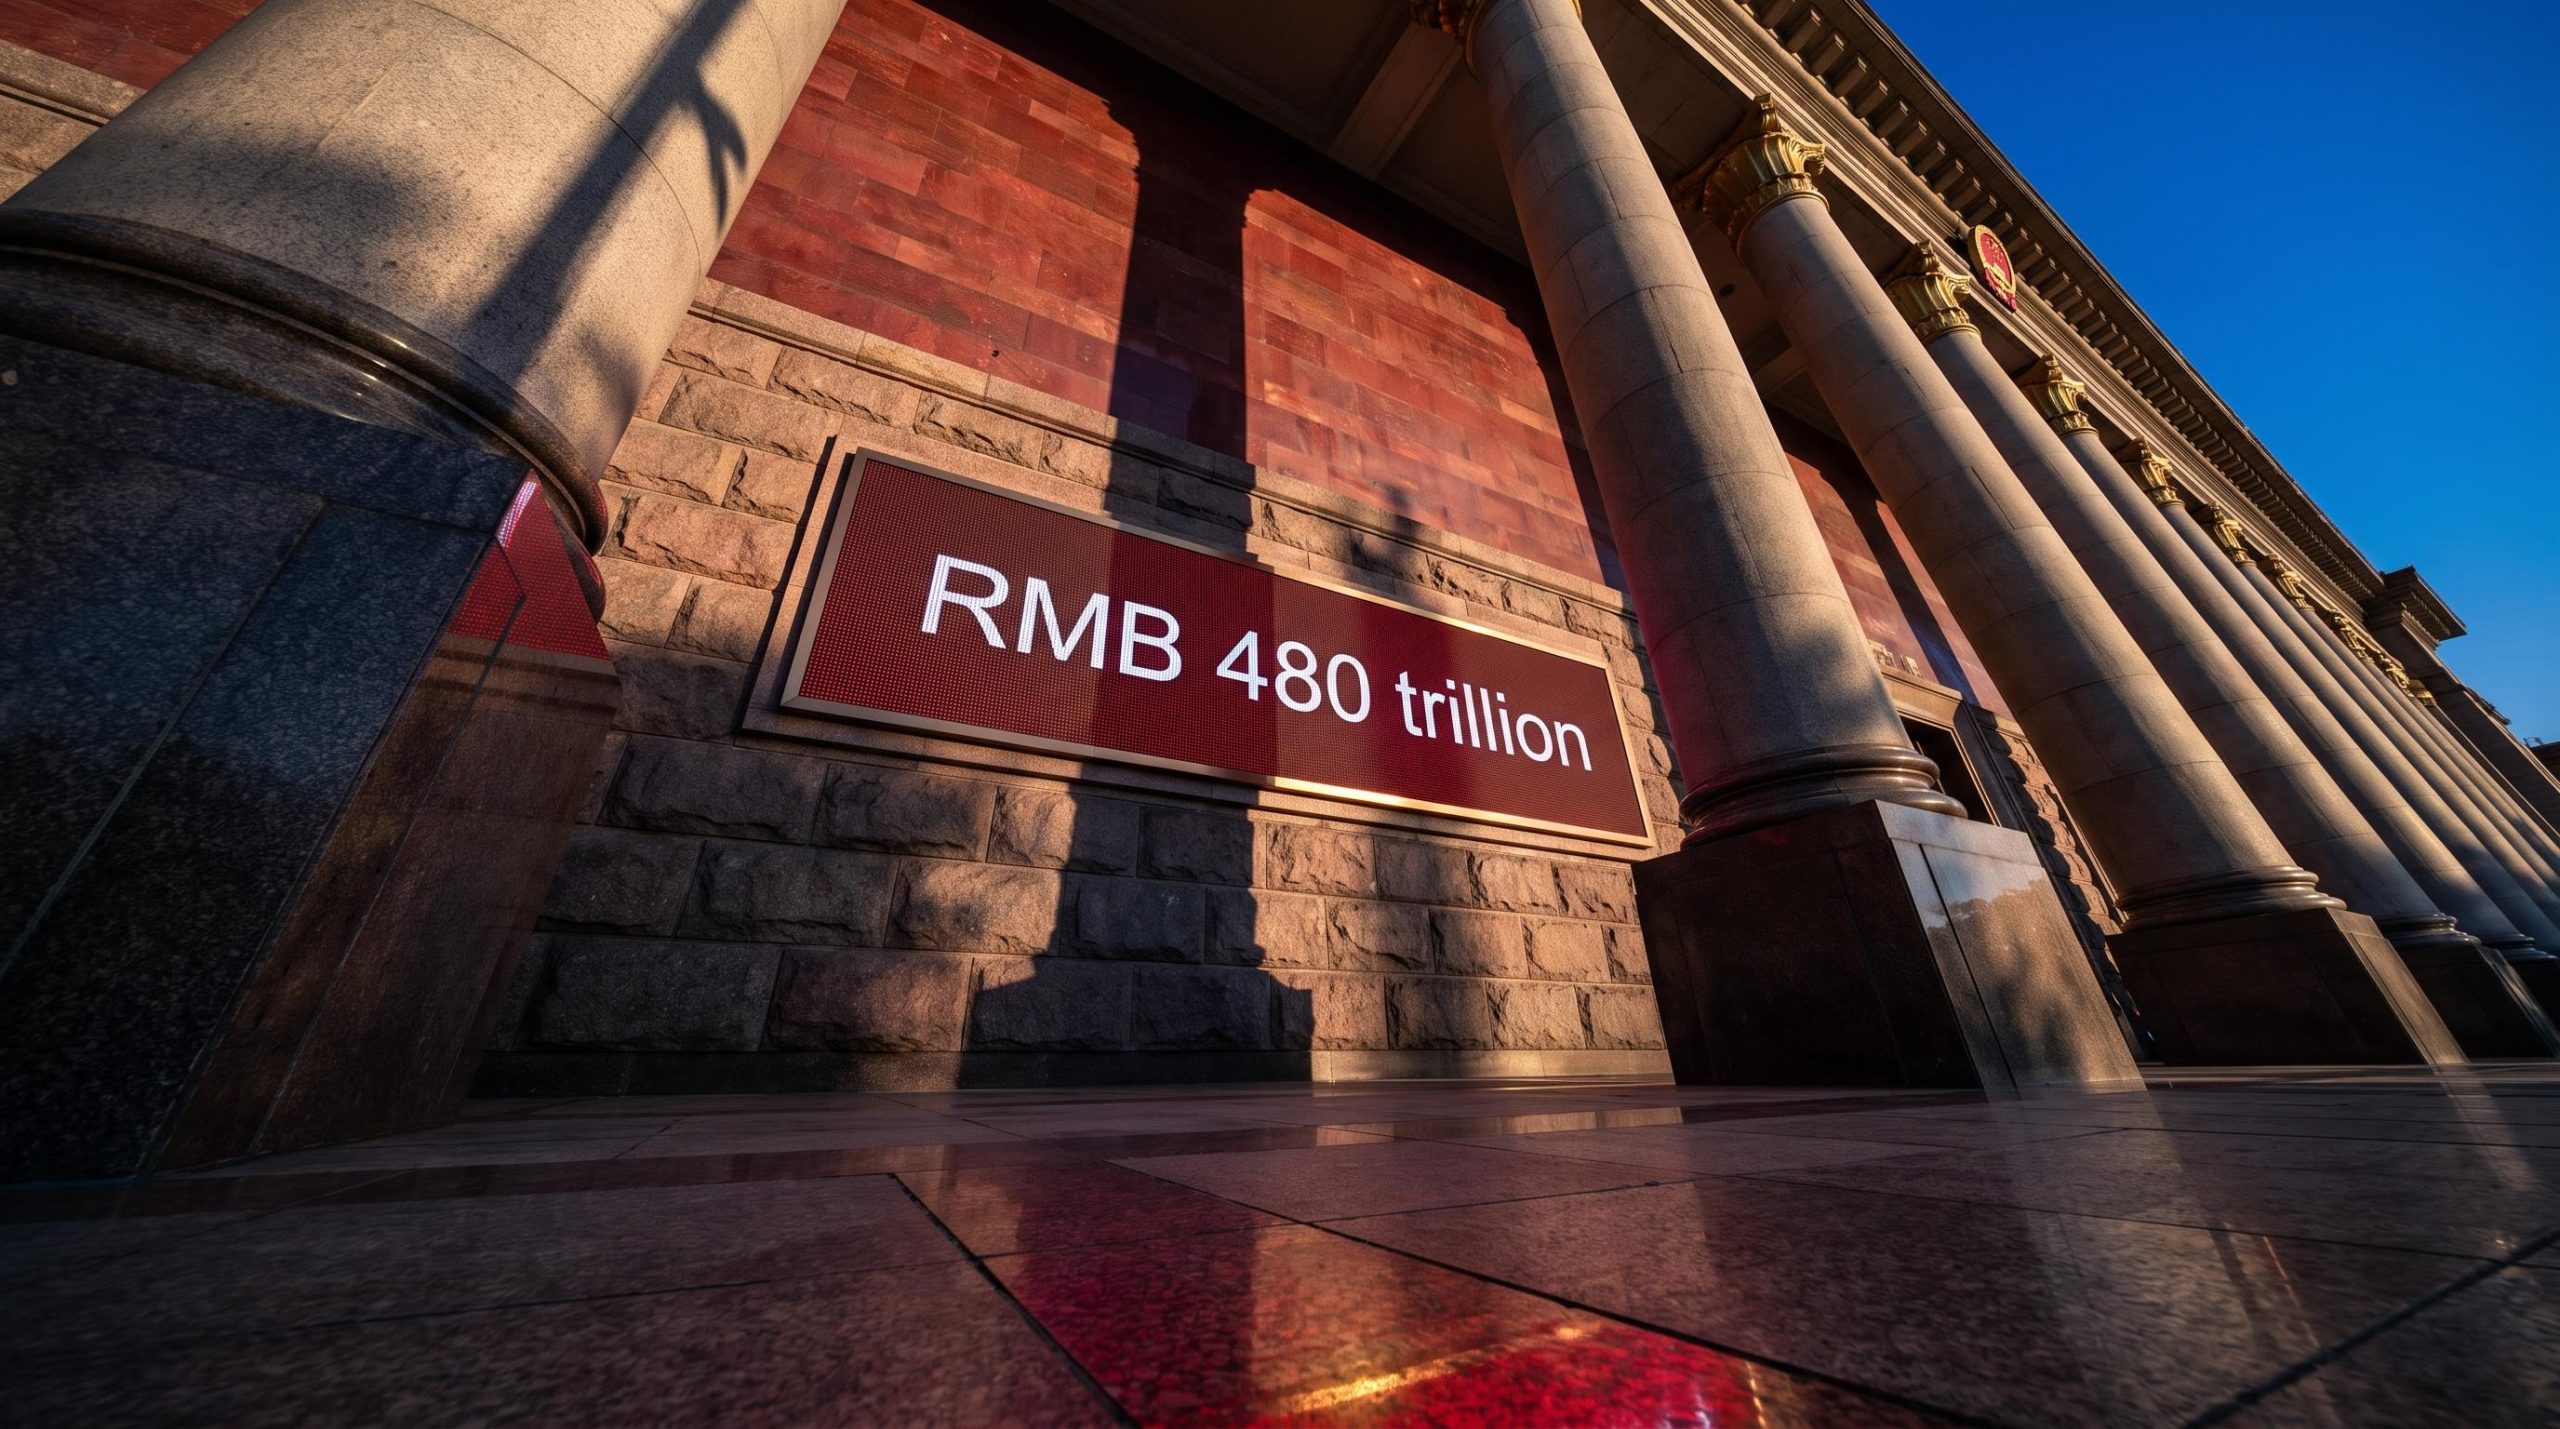
The total assets of China’s banking system reached RMB 480.01 trillion at the end of 2025.
Most investors can name China’s big banks. Far fewer understand why those banks behave so differently from a Western commercial lender, and the answer is not incidental to the system. It is the architecture.
State ownership sits at the centre of how credit moves through the world’s second-largest economy. The People’s Bank of China (PBoC) does not simply set an interest rate and step aside; the entire system is engineered to direct capital toward government-priority outcomes. If you hold Chinese equities, Asian bonds, or any broad emerging-market exposure, you are operating in the shadow of this structure whether you have mapped it or not.
Here is what you will walk away with: a clear picture of who holds the assets, who issues the instructions, where private competition is genuinely growing, and where the structural fault lines run heading into 2026. Treat it as a navigational tool for assessing Chinese financial exposure, not a history lesson.
A system built around six banks that control almost half of everything
Concentration is the defining feature of Chinese banking, and it starts at the top. As of end-2025, the six largest state-owned commercial banks, ICBC, CCB, ABC, BOC, BOCOM, and Postal Savings Bank, together held approximately 44% of all commercial bank assets, according to Rhodium Group. That single fact does most of the explaining for how credit gets allocated across the country.
Look at the full tier structure and the picture sharpens. The large state-owned commercial bank tier held RMB 210.8 trillion at end-2025, equal to 43.9% of total system assets, based on data from China’s National Financial Regulatory Administration (NFRA).
The NFRA banking system statistics released in February 2026 confirm the large state-owned commercial bank tier at RMB 210.8 trillion and joint-stock lenders at RMB 77.8 trillion, making the official data the most precise available basis for assessing tier-level concentration.
The scale problem, in one number RMB 480.01 trillion in total banking assets. When a system this size directs credit, the effects ripple through global growth, commodity demand, and emerging-market risk.
Below the state giants sit the joint-stock commercial banks, holding RMB 77.8 trillion, or 16.2% of the system. Then come the city and regional commercial banks, which accounted for roughly 26.4% of system assets at year-end. An EY review of listed Chinese banks found that the large state-owned, joint-stock, and city commercial tiers together represent around 83% of commercial banking assets.
That leaves the private banks. There are 19 of them in the entire country, per the PBoC, and in system-level terms they are a rounding error against the state-owned core.
| Tier | Key Institutions | Assets (RMB trillion) | Share of System (%) | Notes |
|---|---|---|---|---|
| Large state-owned commercial | ICBC, CCB, ABC, BOC, BOCOM, Postal Savings | 210.8 | 43.9% | Core of the system; state shareholders |
| Joint-stock commercial | National joint-stock lenders | 77.8 | 16.2% | Substantial secondary tier |
| City and regional commercial | City and regional lenders | Not separately stated | ~26.4% | Regionally concentrated |
| Private banks | WeBank, MYbank, 17 others | Marginal at system level | Small fraction | 19 licensed banks total |
Here is the read that matters for you. The tier breakdown is not a market-share curiosity; it tells you that meaningful credit-allocation decisions in China run through a handful of institutions that answer to state shareholders first. If you hold Chinese bank equities or a sector ETF, your exposure is driven almost entirely by that state-owned tier, not by the private digital banks generating fintech headlines. Misread the structure, and you misread the risk.
When big ASX news breaks, our subscribers know first
Why the state owns the banks, and what it actually asks of them
State dominance in China is a deliberate policy choice, not a leftover from an unreformed past. Understanding what the state asks of its banks is the difference between reading Chinese bank stocks accurately and applying a Western template that does not fit.
The official rationale, as framed by the PBoC, treats two goals as dual priorities: directing major financial institutions to support the real economy, and strengthening their capital bases. A concentrated core of state-controlled banks lets authorities push credit toward strategic outcomes with a directness that a fragmented private system could not match.
The model is designed to serve several functions:
- Directed credit allocation to strategic sectors, including state-owned enterprises, infrastructure, and priority regions
- Counter-cyclical support, expanding credit when growth slows
- Policy implementation, executing government directives through institutions the state controls
- Green finance deployment, using large banks as the primary vehicle for green credit quotas
- Stability backstop, drawing on implicit government backing to avoid systemic crises
Institutions including KPMG and EY make the supportive case: this model has underpinned rapid financial deepening, helped China avoid banking crises, and channelled enormous investment into infrastructure and industrial upgrading.
The critical case is just as substantive. Rhodium Group and BBVA argue that state dominance skews credit toward SOEs and government-linked borrowers, which produces predictable problems:
- SOE bias, favouring state borrowers over more productive private firms
- Capital misallocation, funding projects on policy grounds rather than returns
- SME crowding-out, leaving smaller private businesses underserved
- Margin compression, as policy-directed lending squeezes profitability
- Risk accumulation, particularly through property developers and local government financing vehicles (LGFVs)
Rhodium Group characterises the state-led banking model as a deliberate trade-off: it buys policy control and systemic stability at the cost of productivity and private-sector dynamism, unless governance and competition reforms advance.
Rhodium Group research on China’s state banking structure frames LGFV debt accumulation and SOE credit preference not as legacy distortions but as features of a system designed to prioritise policy control, a distinction that carries direct implications for how you assess NPL risk and capital efficiency in Chinese bank equities.
The clearest examples of politically driven credit are lending to property developers and LGFVs, where risk is elevated, and green credit quotas, where state banks act as implementation vehicles for national climate targets.
What you should take from this is not a verdict but a tension you need to hold. The state-bank model is a working governance choice with real functions and real costs on both sides. Assessing Chinese bank stocks or China macro risk means taking a position on whether those trade-offs are acceptable, and setting your expectations for capital efficiency, dividends, and reform pace accordingly.
How the PBoC moves credit through the system without just setting a single rate
Watch a Chinese monetary policy announcement and the natural question is “did they cut rates?” That question misses most of the action. The PBoC’s influence over credit is cumulative and layered, built from several tools working together rather than one dominant lever.
The PBoC yuan fixing mechanism is one layer of the broader control architecture: a daily central parity rate published at 9:15 a.m. Beijing time caps all onshore USD/CNY moves within a strict 2% band before a single trade clears, giving the central bank a direct grip on currency conditions that complements its credit toolkit.
The toolkit runs in a rough sequence:
- Window guidance. Officials meet privately with major banks to signal preferred lending behaviour toward priority sectors. It is non-public and never appears in any published policy rate.
- Macro-Prudential Assessment (MPA) framework. This links a bank’s credit and risk behaviour to its regulatory evaluation, creating an incentive to lend in line with policy targets.
- Reserve requirement ratios (RRR). Adjusting the RRR controls how much banks can lend. Cuts free up liquidity; increases restrain it.
- Loan Prime Rate (LPR). Derived from quotations by major banks, the LPR is the key lending benchmark, and PBoC reductions are intended to guide borrowing costs lower.
- Relending and rediscount facilities. The PBoC offers low-cost funding to banks that hit lending targets for priority sectors such as small enterprises and green projects.
BBVA’s 2026 China Banking Monitor identifies RRR moves, alongside broader liquidity operations, as central to managing system-wide credit conditions amid slower growth. UNEP FI highlights the targeted relending facilities as an important channel for scaling green credit through large commercial banks.
The operationally relevant question, then, is not whether the PBoC cut rates. It is which combination of tools it is deploying, and toward which sectors. The non-price tools, window guidance and MPA targets, often carry as much weight as any published rate in determining where credit actually flows.
Where the toolkit creates pressure on bank profitability
Every tool that lowers borrowing costs also squeezes the banks doing the lending. Net interest margin (NIM) compression, the narrowing gap between what banks earn on loans and pay on deposits, is the central profitability challenge across the sector, according to BBVA and KPMG analysis. Lower benchmark rates and targeted credit schemes both feed it.
The system-wide non-performing loan (NPL) ratio has held near 1.5%, a picture of stability that masks elevated risk concentrated in property and LGFV exposures.
That surface calm hides a genuine strain. Directed lending to stressed sectors builds credit risk on bank balance sheets, while banks must simultaneously hold capital buffers against rising risk weights and keep funding policy priorities. Rate changes do not translate proportionally into lending either, because banks weigh their own capital constraints before extending credit.
Private credit stress in Western markets provides a useful reference point: the opacity and valuation smoothing that characterise non-traded credit vehicles outside China share structural features with the LGFV and property loan books sitting on Chinese bank balance sheets, where headline NPL ratios similarly lag the underlying risk accumulation.
WeBank, MYbank, and what private digital banks actually represent in this system
The two dominant private banks are not negligible. WeBank ended 2025 with total assets of RMB 766.3 billion, up 17.6% across the year, according to Yicai Global and WeBank’s 2025 annual report. MYbank held RMB 504.6 billion at year-end. Combined, the two hold roughly 1.3 times the aggregate assets of the other 16 private banks put together.
Now hold that against the system. WeBank’s entire balance sheet is less than 0.2% of the RMB 480 trillion banking system. These are real, fast-growing institutions, and they are also a sliver of the whole.
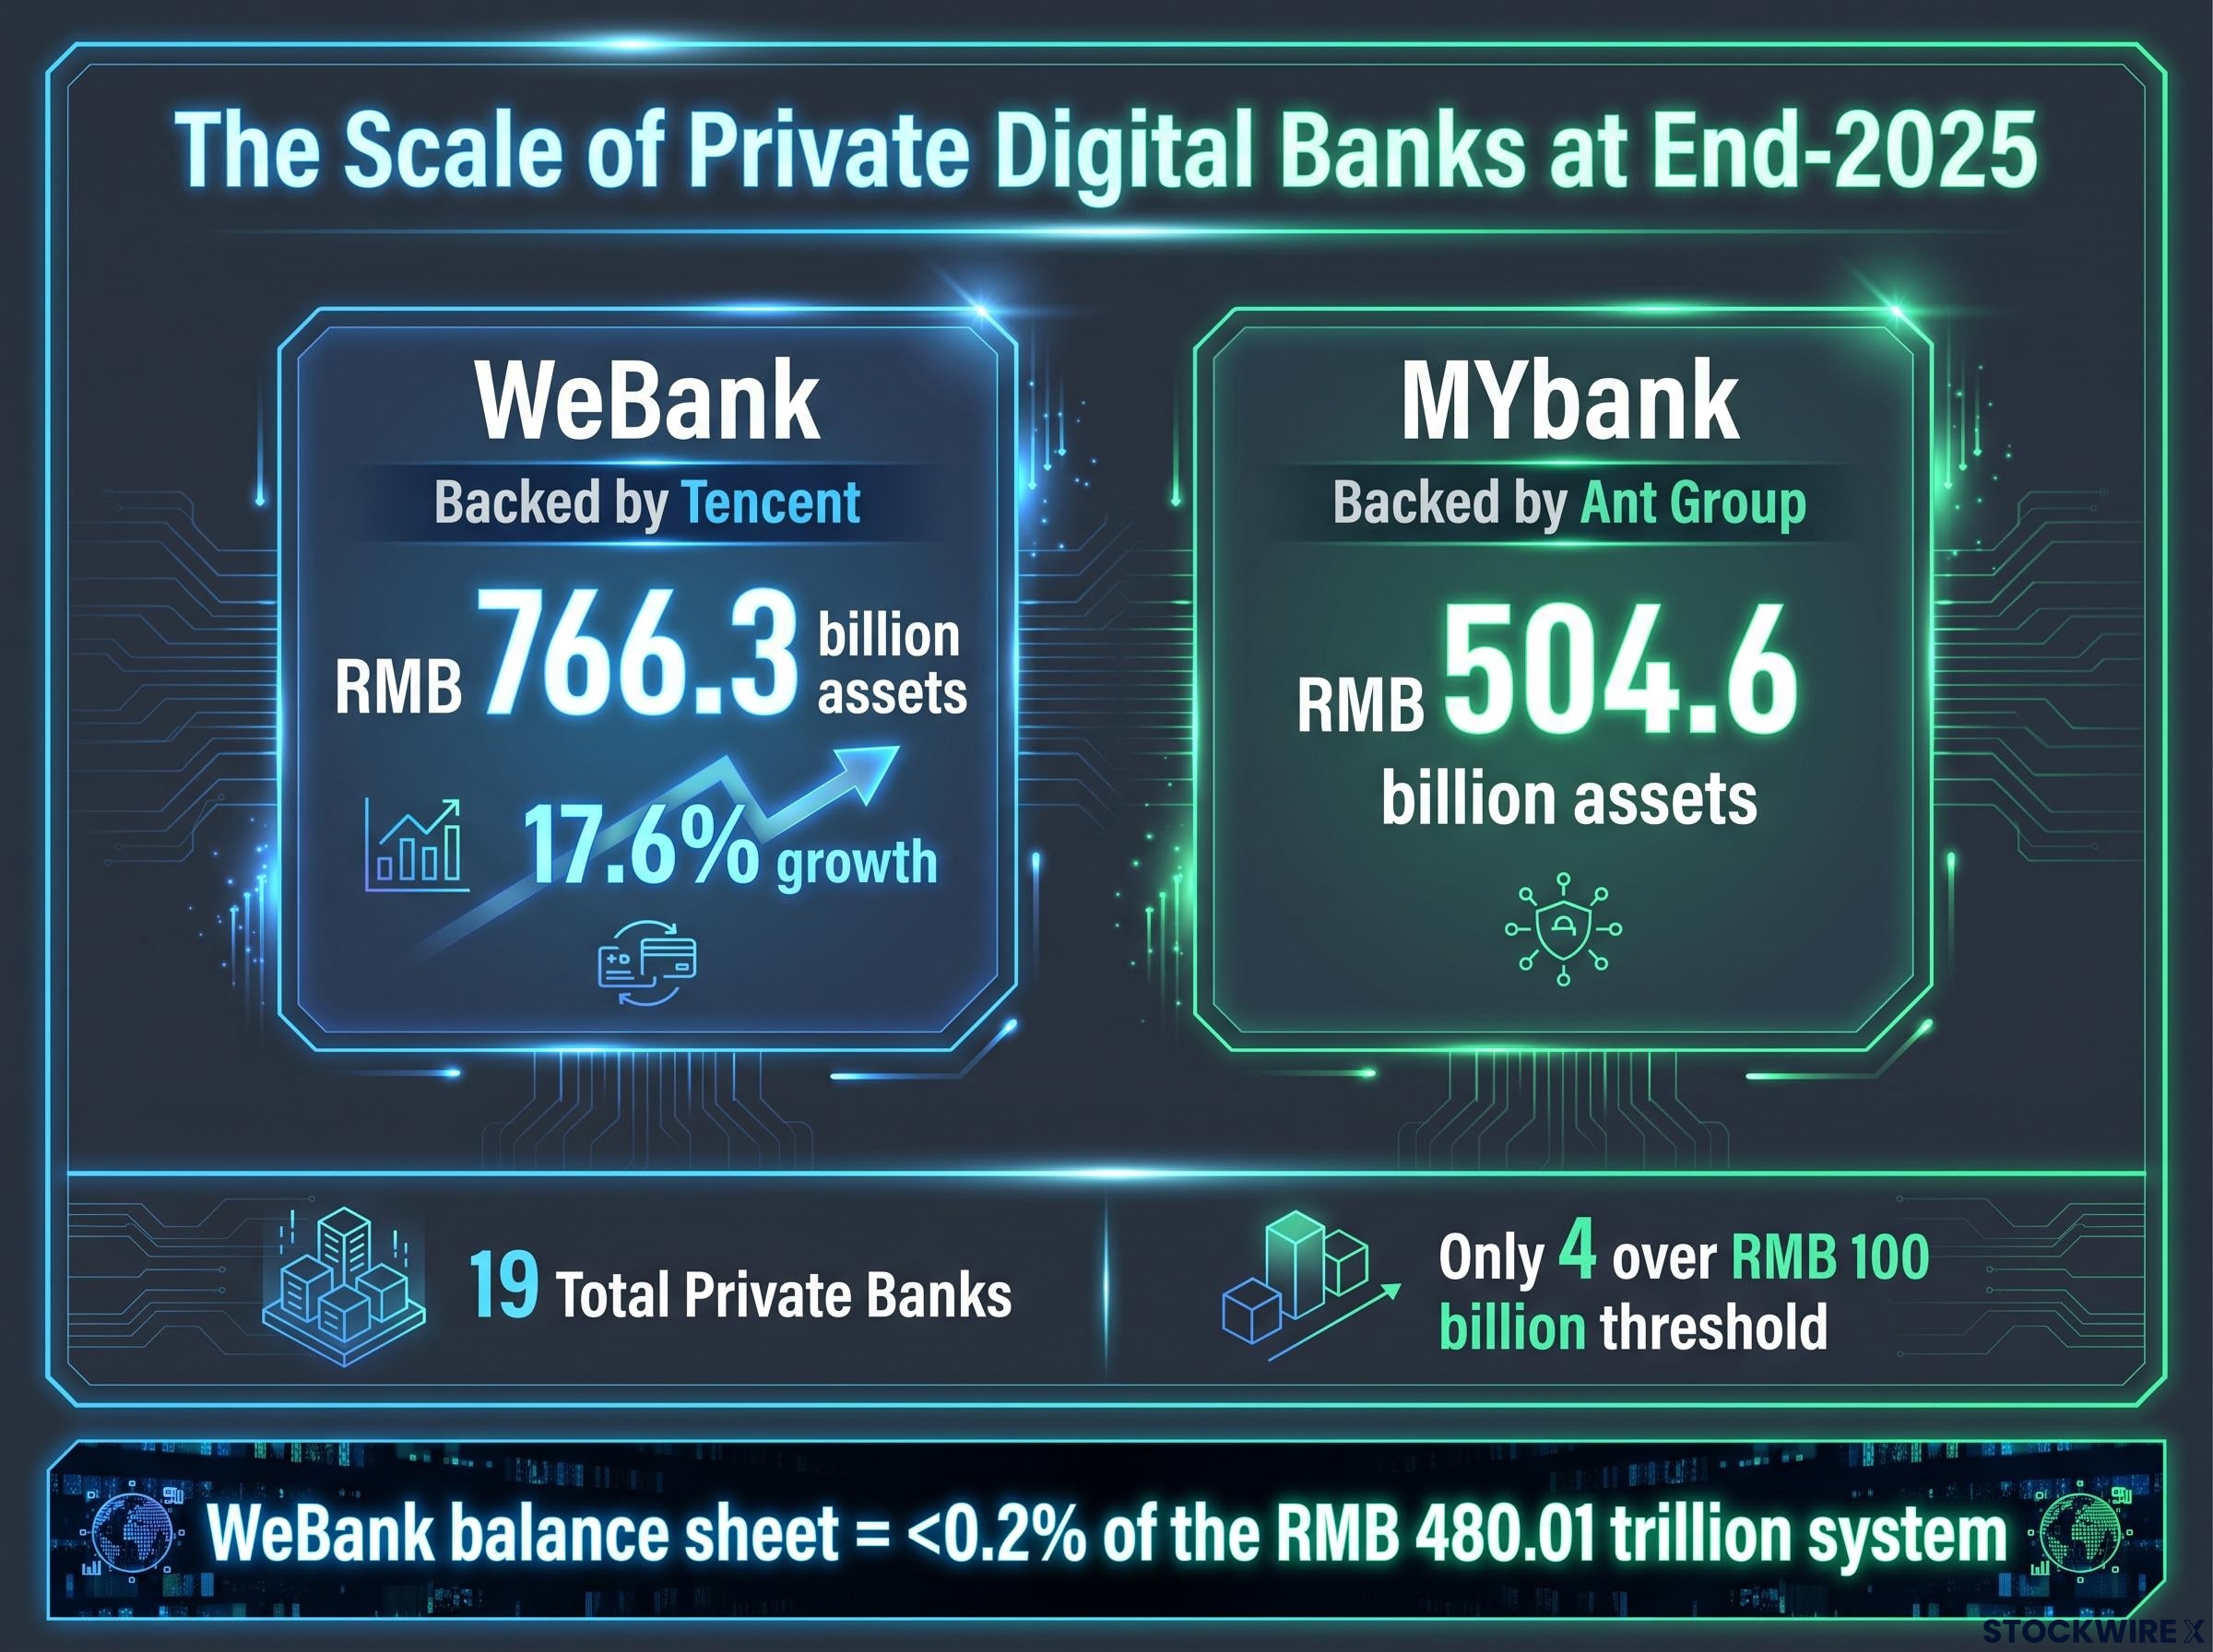
WeBank is backed by Tencent; MYbank is backed by Ant Group, the Alibaba affiliate. Both are branchless digital lenders that draw on their parent technology ecosystems for customer acquisition, automated credit scoring, and low-cost online operations, serving small businesses and retail customers that traditional banks tend to overlook.
They operate inside a tight regulatory perimeter:
- Limited geographic scope
- Strict capital and liquidity requirements
- Caps and close supervision on large exposures
- Restricted access to interbank funding
WeBank’s 17.6% growth in 2025, in context A private digital model can scale rapidly within China’s regulatory framework. Yet WeBank’s total assets still sit below 0.2% of the banking system. The growth story and the proportion are both true at once.
Only four of China’s 19 private banks have crossed the RMB 100 billion asset threshold, and performance divergence across the segment is widening, evidence that regulatory and market discipline is consolidating the private space around a small number of viable models.
Here is the more useful signal. WeBank’s growth tells you the private digital model works at scale. The gap between WeBank and MYbank on one side and the other 17 private banks on the other tells you the model is not easily replicable. If a China fintech narrative has drawn your attention, that distinction matters: these banks are genuinely innovative and growing, but they are not yet a structural challenge to state-bank dominance, and their funding and geographic constraints cap how far they can push.
Reading China’s banking sector as a global investor in 2026
Pull the four threads together and the shape of your exposure becomes clear. When you engage with Chinese financial stocks or China macro risk, you are buying into a system defined by state concentration, credit directed through the PBoC’s layered toolkit, and a private segment that innovates at the edges without threatening the core. That architecture is the mechanism through which credit reaches, or fails to reach, the real economy.
Cross-border transmission channels are how Chinese banking stress reaches portfolios that hold no direct China exposure: commodity demand contraction flowing through to Australian bank balance sheets, or wholesale funding cost spikes propagating across Asia-Pacific, illustrate that the fault lines inside China’s state-bank system have consequences well beyond Chinese equities.
Four fault lines are active heading into 2026:
- Property and LGFV credit risk, where the stable 1.5% system-wide NPL ratio conceals concentrated stress
- NIM compression, as ongoing policy-rate pressure keeps squeezing margins
- The green finance tension, with banks tasked by UNEP FI’s dual challenge to expand green credit books while managing carbon-intensive legacy exposures
- The state-versus-private divergence, with WeBank’s 17.6% growth signalling where private momentum is building against a still-dominant state tier
The analytical skill this all builds toward is simple. You should now be able to tell a headline that signals systemic risk, a property NPL surge or an LGFV restructuring, from one that signals routine policy execution, an RRR cut or an LPR adjustment. BBVA and Rhodium Group frame the state-bank model as a deliberate trade-off, not a transitional phase waiting to be reformed, and reading it that way keeps your expectations grounded.
Ask yourself three questions as you assess any Chinese banking exposure:
- How is the property and LGFV NPL picture evolving beneath the stable headline ratio?
- How much RRR and rate headroom does the PBoC still have, and which sectors is it steering credit toward?
- How fast is the regulatory perimeter around private digital banks actually widening?
The sector is profitable in aggregate. The variables that will shape its next phase, reform pace, property resolution, the PBoC’s tool mix, and private-sector access, are where the real questions sit, and understanding the architecture is the prerequisite for evaluating any of them.
For investors wanting to see the state-bank model under live stress conditions, our deep-dive into China’s August 2026 credit miss examines how yuan loan growth has decelerated from 12% to roughly 5% year-on-year over three years and what the PBoC’s no-easing stance means for China-exposed portfolios.
This article is for informational purposes only and should not be considered financial advice. Investors should conduct their own research and consult with financial professionals before making investment decisions. Past performance does not guarantee future results. Financial projections are subject to market conditions and various risk factors.