
The US dollar has just dropped to a four-week low after a Democratic sweep in the midterms. Yet UOB‘s 1-3 week range for USD/SGD has not moved since 27 October, and that steadiness matters for any USD/SGD forecast right now. The question is why a weaker dollar has not produced a bigger drop in the pair.
As of 5 November 2026, three forces are acting on the same exchange rate. A Democratic-controlled Congress has changed the US fiscal outlook. An AI-led technology sell-off has hit US growth sentiment.
The third force arrives on Friday with the US October jobs report, which could confirm the dollar’s slide or reverse it.
This analysis sets out the levels UOB is watching and the signals that would confirm or break its bearish view. It also gives you a way to read Friday’s payrolls number against those levels.
Where are UOB’s USD/SGD support and resistance levels?
USD/SGD closed near 1.2795, down 0.16%, after reaching 1.2817 two days earlier. UOB analysts Quek Ser Leang and Lee Sue Ann still see a downside lean. They expect major support near 1.2755 to limit near-term losses.
Their map works as a set of conditions. In the next 24 hours they expect trading between 1.2760 and 1.2800. Over 1-3 weeks the range is 1.2775-1.2835, the same view they held on 27 October when spot sat at 1.2810.
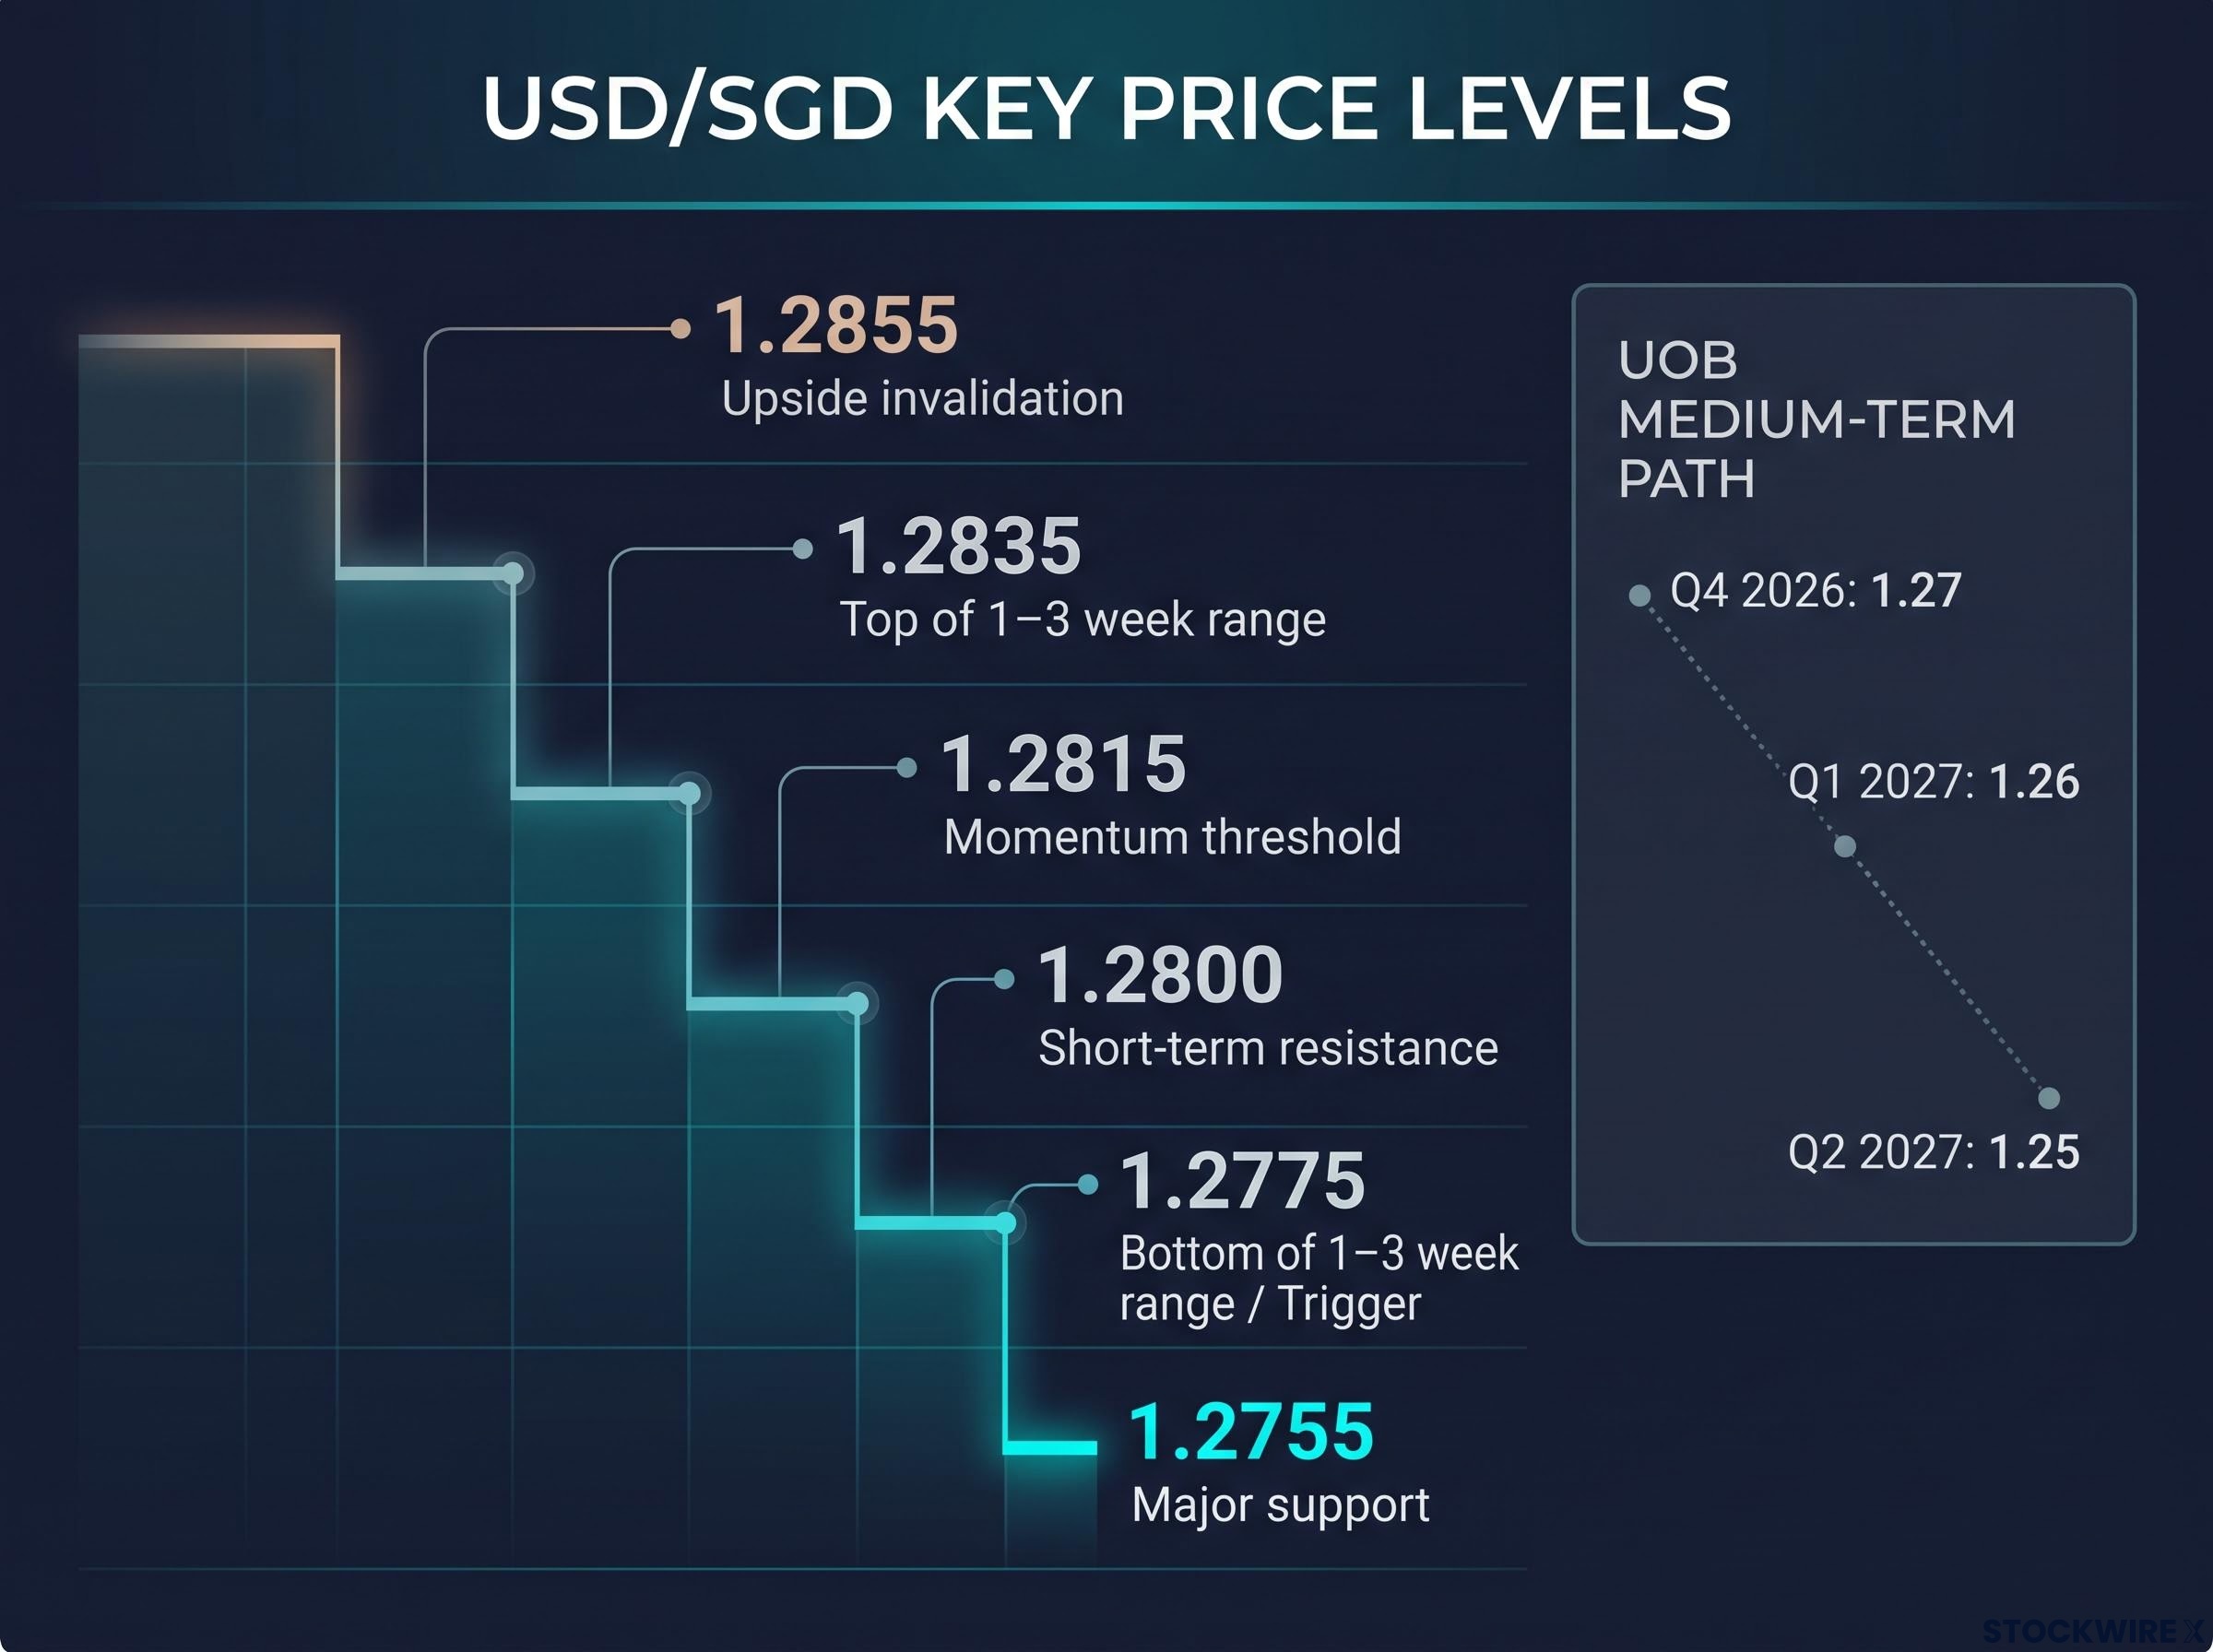
| Level | Role | What it signals |
|---|---|---|
| 1.2855 | Stronger upside confirmation | Sustained break invalidates the immediate bearish structure |
| 1.2835 | Top of 1-3 week range | Break above weakens the bearish case |
| 1.2815 | Momentum threshold | Pair must stay below to keep downward momentum |
| 1.2800 | Short-term resistance | Upper edge of the 24-hour range |
| 1.2775 | Bottom of 1-3 week range | Daily close below changes the risk profile |
| 1.2760 | Minor support | Lower edge of the 24-hour range |
| 1.2755 | Major support | Sustained break strengthens the bearish case |
UOB’s test depends on how the pair closes, not where it trades during the day. The pair has already dipped to 1.2771, below the range floor, and then recovered to settle near 1.2781. Because it did not close below the floor, UOB kept its range view.
The trigger to watch According to UOB, a daily close below 1.2775 would likely lead to a test of major support at 1.2755. An intraday dip below that level does not count.
UOB’s short-term calls have not all been accurate. The source report says an earlier forecast of 1.2790-1.2820 was missed when the pair fell to 1.2775, although that exact call could not be independently verified.
The pair has been here before: an earlier whipsaw in late August forced UOB to retire a month-long bearish call and move to a neutral stance, a reminder that range breaks in USD/SGD often reverse quickly.
The unchanged range shows you that UOB sees a downward bias that still needs confirmation. For that reason, 1.2775 is the level that would change the picture, while 1.2755 is the target that follows if it breaks.
The medium-term path
UOB’s Quarterly Global Outlook, published on 4 November, projects 1.27 for Q4 2026, 1.26 for Q1 2027 and 1.25 for Q2 2027. The short-term range describes how the pair is moving now. The quarterly forecasts show where the bank expects that movement to lead over the coming months. Past performance does not guarantee future results, and financial projections are subject to market conditions and various risk factors.
When big ASX news breaks, our subscribers know first
What pushed the dollar to a four-week low after the midterms?
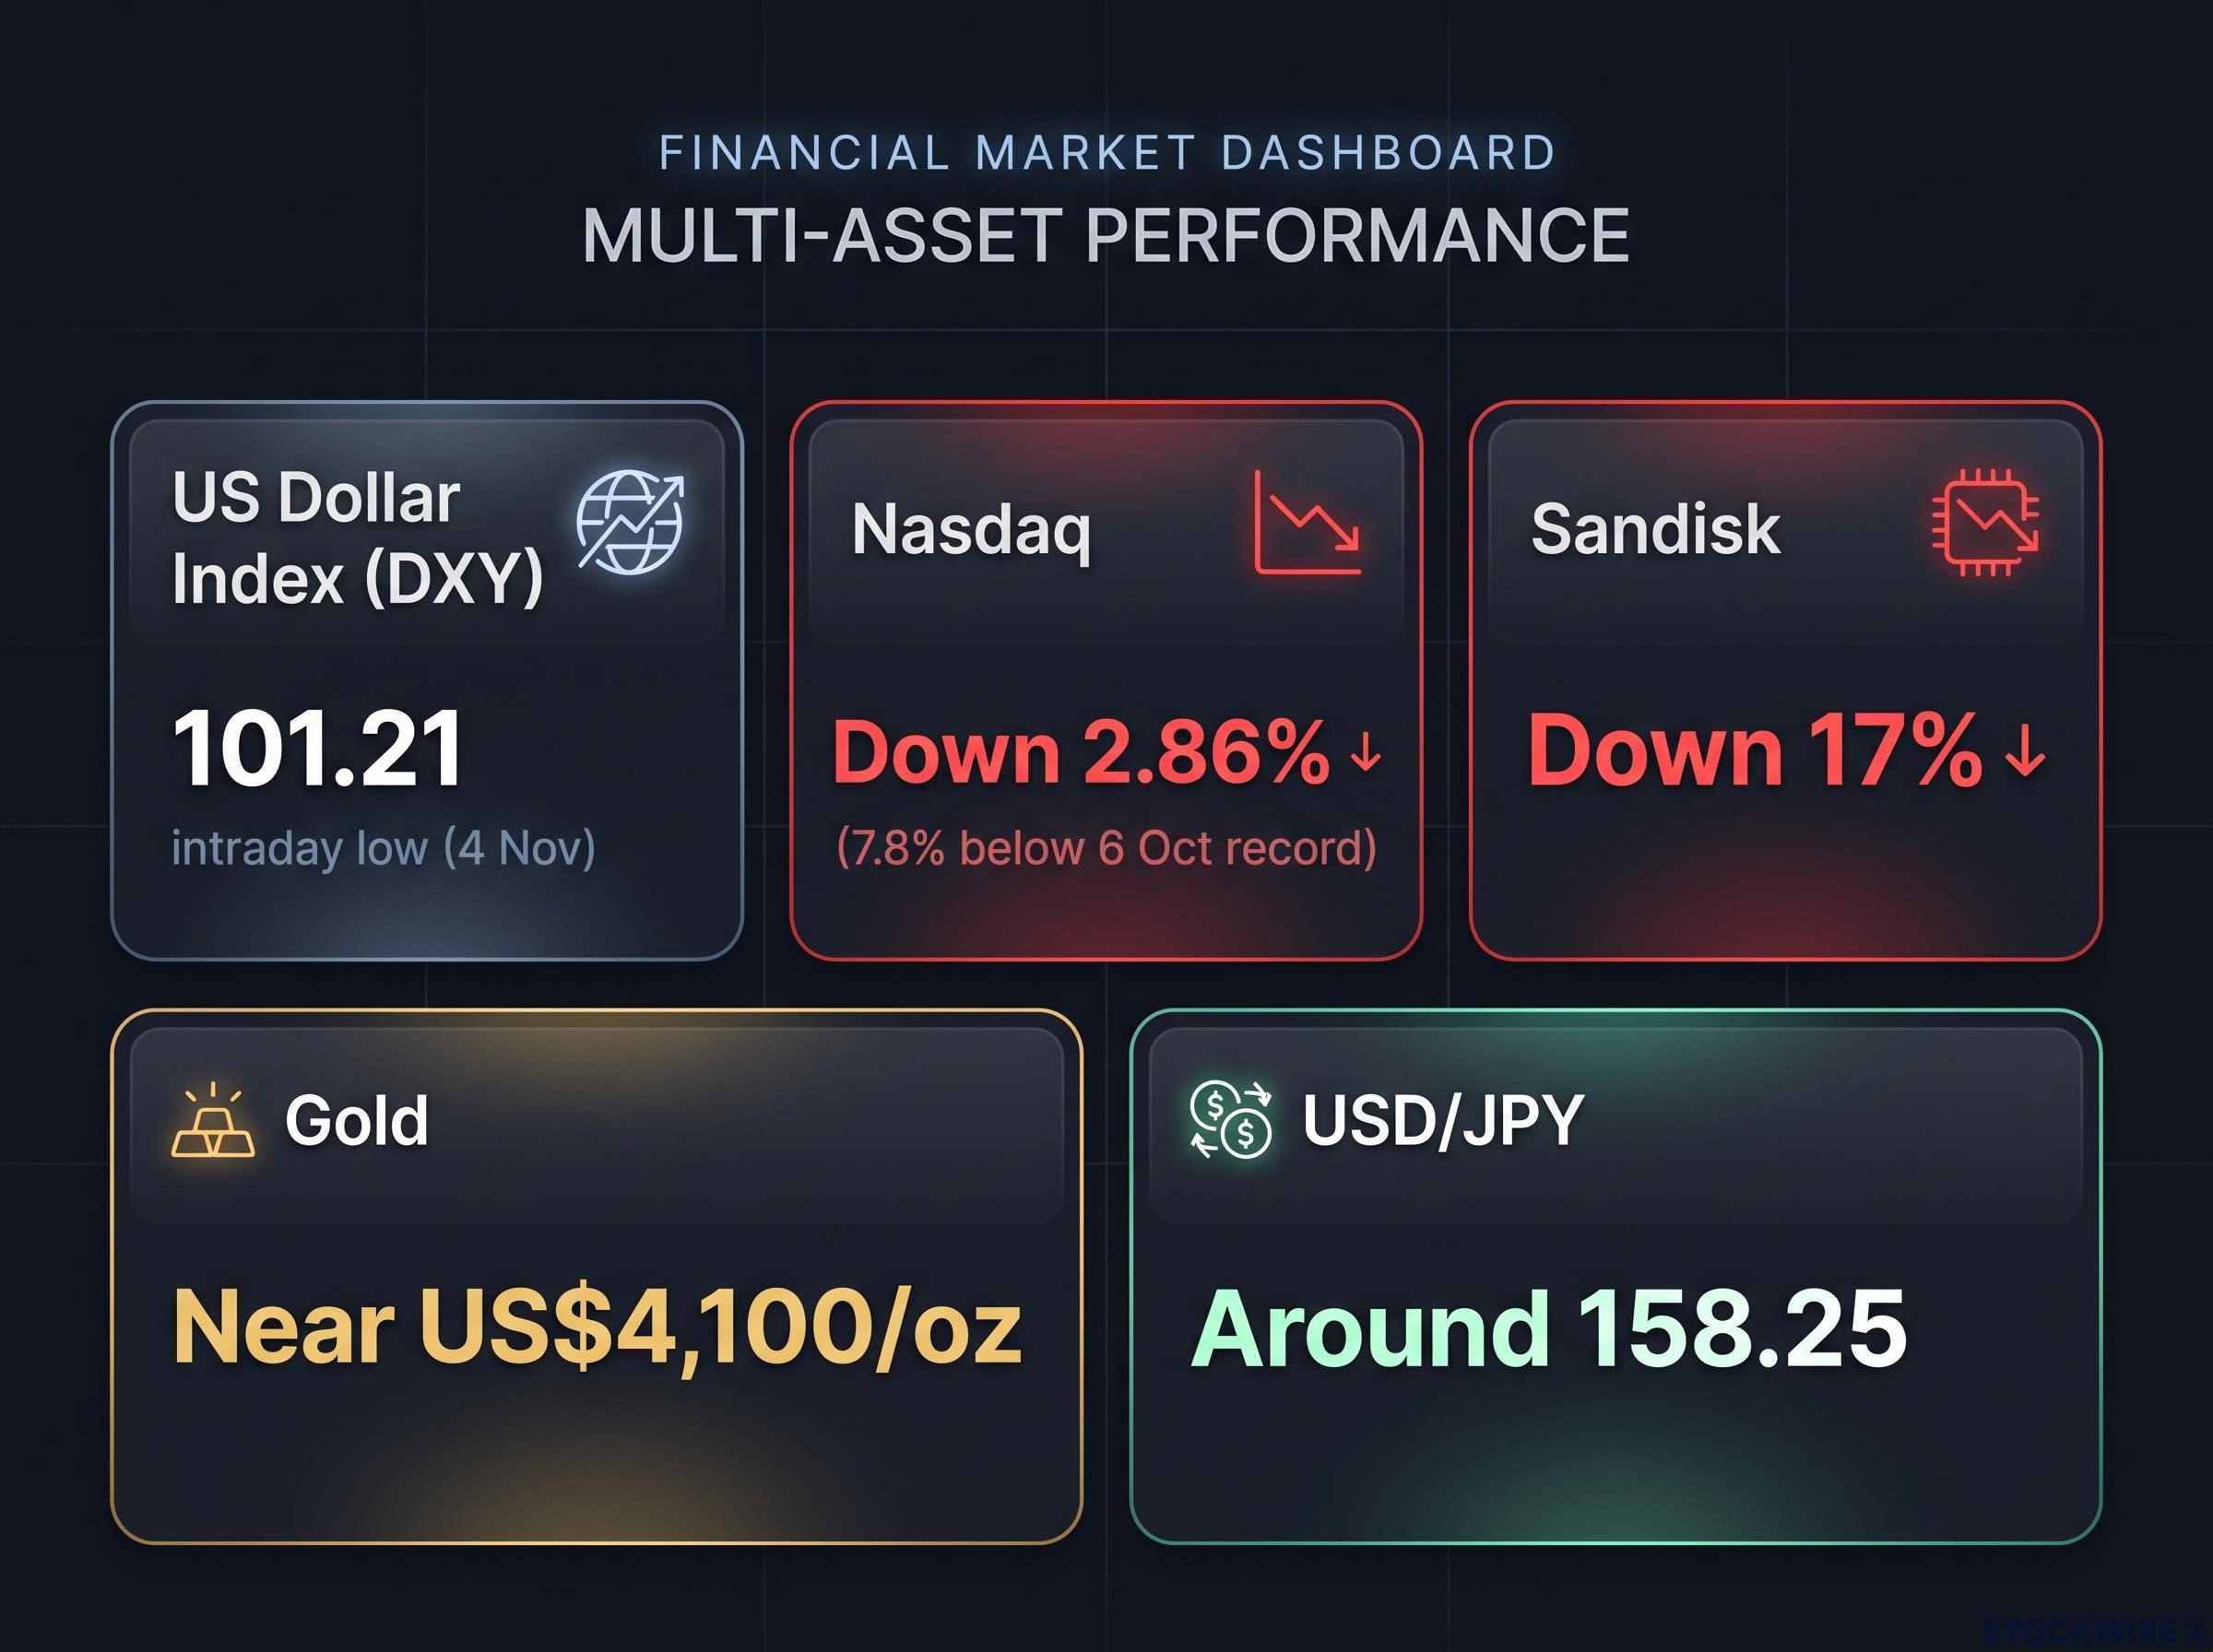
Those medium-term targets assume the dollar keeps weakening, so the cause of this week’s slide matters. The US Dollar Index (DXY), which measures the dollar against six major currencies, fell into the 101.2-101.4 area. Reuters reported an intraday low of 101.21 on 4 November. Because reports from different timestamps conflict, treat the four-week low as an approximate area rather than an exact figure.
The market’s first reading followed five steps:
- The result reduced uncertainty about the election count.
- Democratic control of both houses pointed to more resistance to the administration’s fiscal, tariff and technology agenda.
- That lowered the odds of deficit-expanding measures and aggressive tariffs.
- Treasuries and global equities initially rallied, which cut demand for the dollar as a defensive asset.
- The prospect of tougher AI regulation hit US tech and raised doubts about US growth leadership.
The fifth step has carried the most force. Reuters reported the Nasdaq down 2.86% in one session, its largest daily fall since early June and about 7.8% below its 6 October record. FXStreet’s figure of about 4% came from morning trade, so the gap between the two numbers reflects when each was measured. Memory stocks were hit hardest: Sandisk fell 17%, and Micron also fell sharply.
The effects spread across other markets:
- Gold: near US$4,100/oz as the dollar and Treasury yields fell
- Yen: USD/JPY around 158.25 after hawkish Bank of Japan meeting minutes
- Australian dollar: AUD/USD held above 0.7000
- Nasdaq: its steepest one-day fall since early June
Cyclical or structural?
Commentators disagree on whether this move is risk-on or risk-off. A cyclical reading points to temporary election positioning, profit-taking, shifting Federal Reserve expectations and a short-term correction in AI valuations. A structural reading points to a lasting decline in US exceptionalism, tighter political limits on fiscal policy and diversification away from US assets.
Current reporting supports a cyclical move with possible structural consequences, not proof of a lasting dollar bear market. When the dollar and US tech fall together, investors are likely reducing their concentration in US assets. Do not assume this weakness is a simple risk-on signal.
Some strategists argue the election result was largely priced in, with Fed expectations and Treasury refunding guidance doing more to shape the dollar than the vote itself, and a deeper AI stock correction the bigger swing factor.
Why does a weaker US dollar pull USD/SGD lower, but not one-for-one?
Even if the dollar keeps falling, the pair would not follow it point for point. The quote itself is simple. USD/SGD is the number of Singapore dollars needed to buy one US dollar, so when the dollar weakens, the number falls, for example from 1.2800 towards 1.2755.
The Monetary Authority of Singapore (MAS) adds a second layer. Most central banks set an interest rate. MAS instead manages the S$NEER, a trade-weighted index of the Singapore dollar against its main trading partners’ currencies, within a policy band.
On 14 October 2026, MAS kept the band’s upward slope unchanged, with no change to its width or centre. UOB estimates the slope at about 1.25% a year and expects MAS to hold it through 2027.
Three channels connect the dollar to the pair:
- Dollar direction: broad dollar weakness lowers the quote
- Band position: where the S$NEER sits in the band limits how far the Singapore dollar can strengthen
- Rate differentials: softer US data lowers yields and narrows the dollar’s interest-rate advantage
The band position explains why the pair moves less than the dollar index. Singapore Business Review estimates the S$NEER at about 1.71% above the band’s midpoint. With the index already in the upper half of the band, there is limited room for Singapore policy to push the currency higher.
OCBC’s read Sim Moh Siong and Christopher Wong of OCBC said on 30 October that USD/SGD had eased with a softer dollar and lower yields. They expect any pullback to stay shallow unless broad dollar weakness deepens.
DBS described the October MAS decision as “not a U-turn”, meaning the policy framework still supports the Singapore dollar. Maybank‘s forecast of about 1.285 by end-2026 comes from a 30 June note, so it is now more than four months old.
Taken together, these views mean further USD/SGD declines will depend on additional broad dollar weakness rather than on Singapore policy.
What could break the bearish case, starting with Friday’s payrolls?
The next test of broad dollar weakness is Friday’s US October jobs report. Consensus expects nonfarm payrolls to rise by 65,000, up from 29,000 in September. Unemployment is expected to hold at 4.2%, with hourly earnings up about 0.3% month-on-month versus 0.1% previously.
Forecasts vary widely. TD Securities expects +40,000 and Barclays about +50,000, so the market could react sharply even if the headline number is weak.
| Payrolls outcome | Likely dollar and yields reaction | USD/SGD level in play | UOB signal |
|---|---|---|---|
| Well above +65,000 | Fed easing bets cut, yields and dollar firm | 1.2800, then 1.2835 | Bearish case weakens; above 1.2855 invalidates it |
| Near consensus | Muted; existing trends persist | 1.2775-1.2835 | Range holds |
| Weak print | Dollar weakness reinforced, yields lower | 1.2775, then 1.2755 | Close below 1.2775 confirms downside |
Payrolls is not the only risk to the bearish view:
- Safe-haven flows: a geopolitical shock or a disorderly AI correction could revive demand for dollars even as US stocks fall
- Fed repricing: firm wage growth or lower unemployment could mean markets price in a less accommodative Fed
- Technical failure: the setup only holds while the pair stays below 1.2815
Short-horizon ranges help you judge where a move might stop. They are not reliable forecasts, and NFP volatility, central bank comments or intervention concerns can break them. Payrolls is the event most likely to decide whether 1.2775 or 1.2835 is tested first.
For readers wanting to decode Friday’s release, our comprehensive walkthrough of reading the Non-Farm Payrolls report explains why wages and revisions often matter more than the headline.
Reading the USD/SGD outlook into Friday and beyond
The evidence supports a cautiously bearish bias, not an open-ended slide. In UOB’s view, 1.2775 is the trigger and 1.2755 the objective, and the MAS band limits how much Singapore policy can add.
Keep this short watch list:
- Friday’s payrolls against the +65,000 consensus
- A daily close below 1.2775
- The 1.2815 momentum threshold
- 1.2835 and 1.2855 as the upside levels that would weaken or invalidate the bearish view
If the dollar’s slide proves cyclical, the range may hold for weeks. If it marks a lasting move away from US assets, UOB’s 1.25 path for Q2 2027 becomes more plausible. Friday’s report should give the first clear signal of which case is unfolding.
This article is for informational purposes only and should not be considered financial advice. Investors should conduct their own research and consult with financial professionals before making investment decisions.