China’s CSI 300 is down almost 6% in 2026. Over the same stretch, South Korea’s Kospi and Taiwan’s Weighted Index have gained well over 50%, and the region’s AI trade has become one of the year’s defining market stories. Chinese stocks have watched the AI rally from the sidelines, even after Moonshot AI, a Chinese developer, released a competitive low-cost model in July 2026.
That contrast challenges a common assumption: that building strong AI lifts a country’s stock market. The gap has less to do with who builds the best models and more to do with what each index owns.
Yardeni Research has offered three explanations for the divergence, reported by Investing.com on 10 October 2026. This analysis tests them against the competing views of Goldman Sachs, JPMorgan, Nomura and Morgan Stanley.
After reading, you will have a working framework for judging whether Chinese equities are a value opportunity or a value trap relative to other AI-driven markets.
Why did the CSI 300 fall while Korea and Taiwan surged?
The scale of the gap is hard to overstate.
The 2026 divergence CSI 300: roughly -6% year to date. Kospi and Taiwan’s Weighted Index: gains of roughly 57% to 70%+.
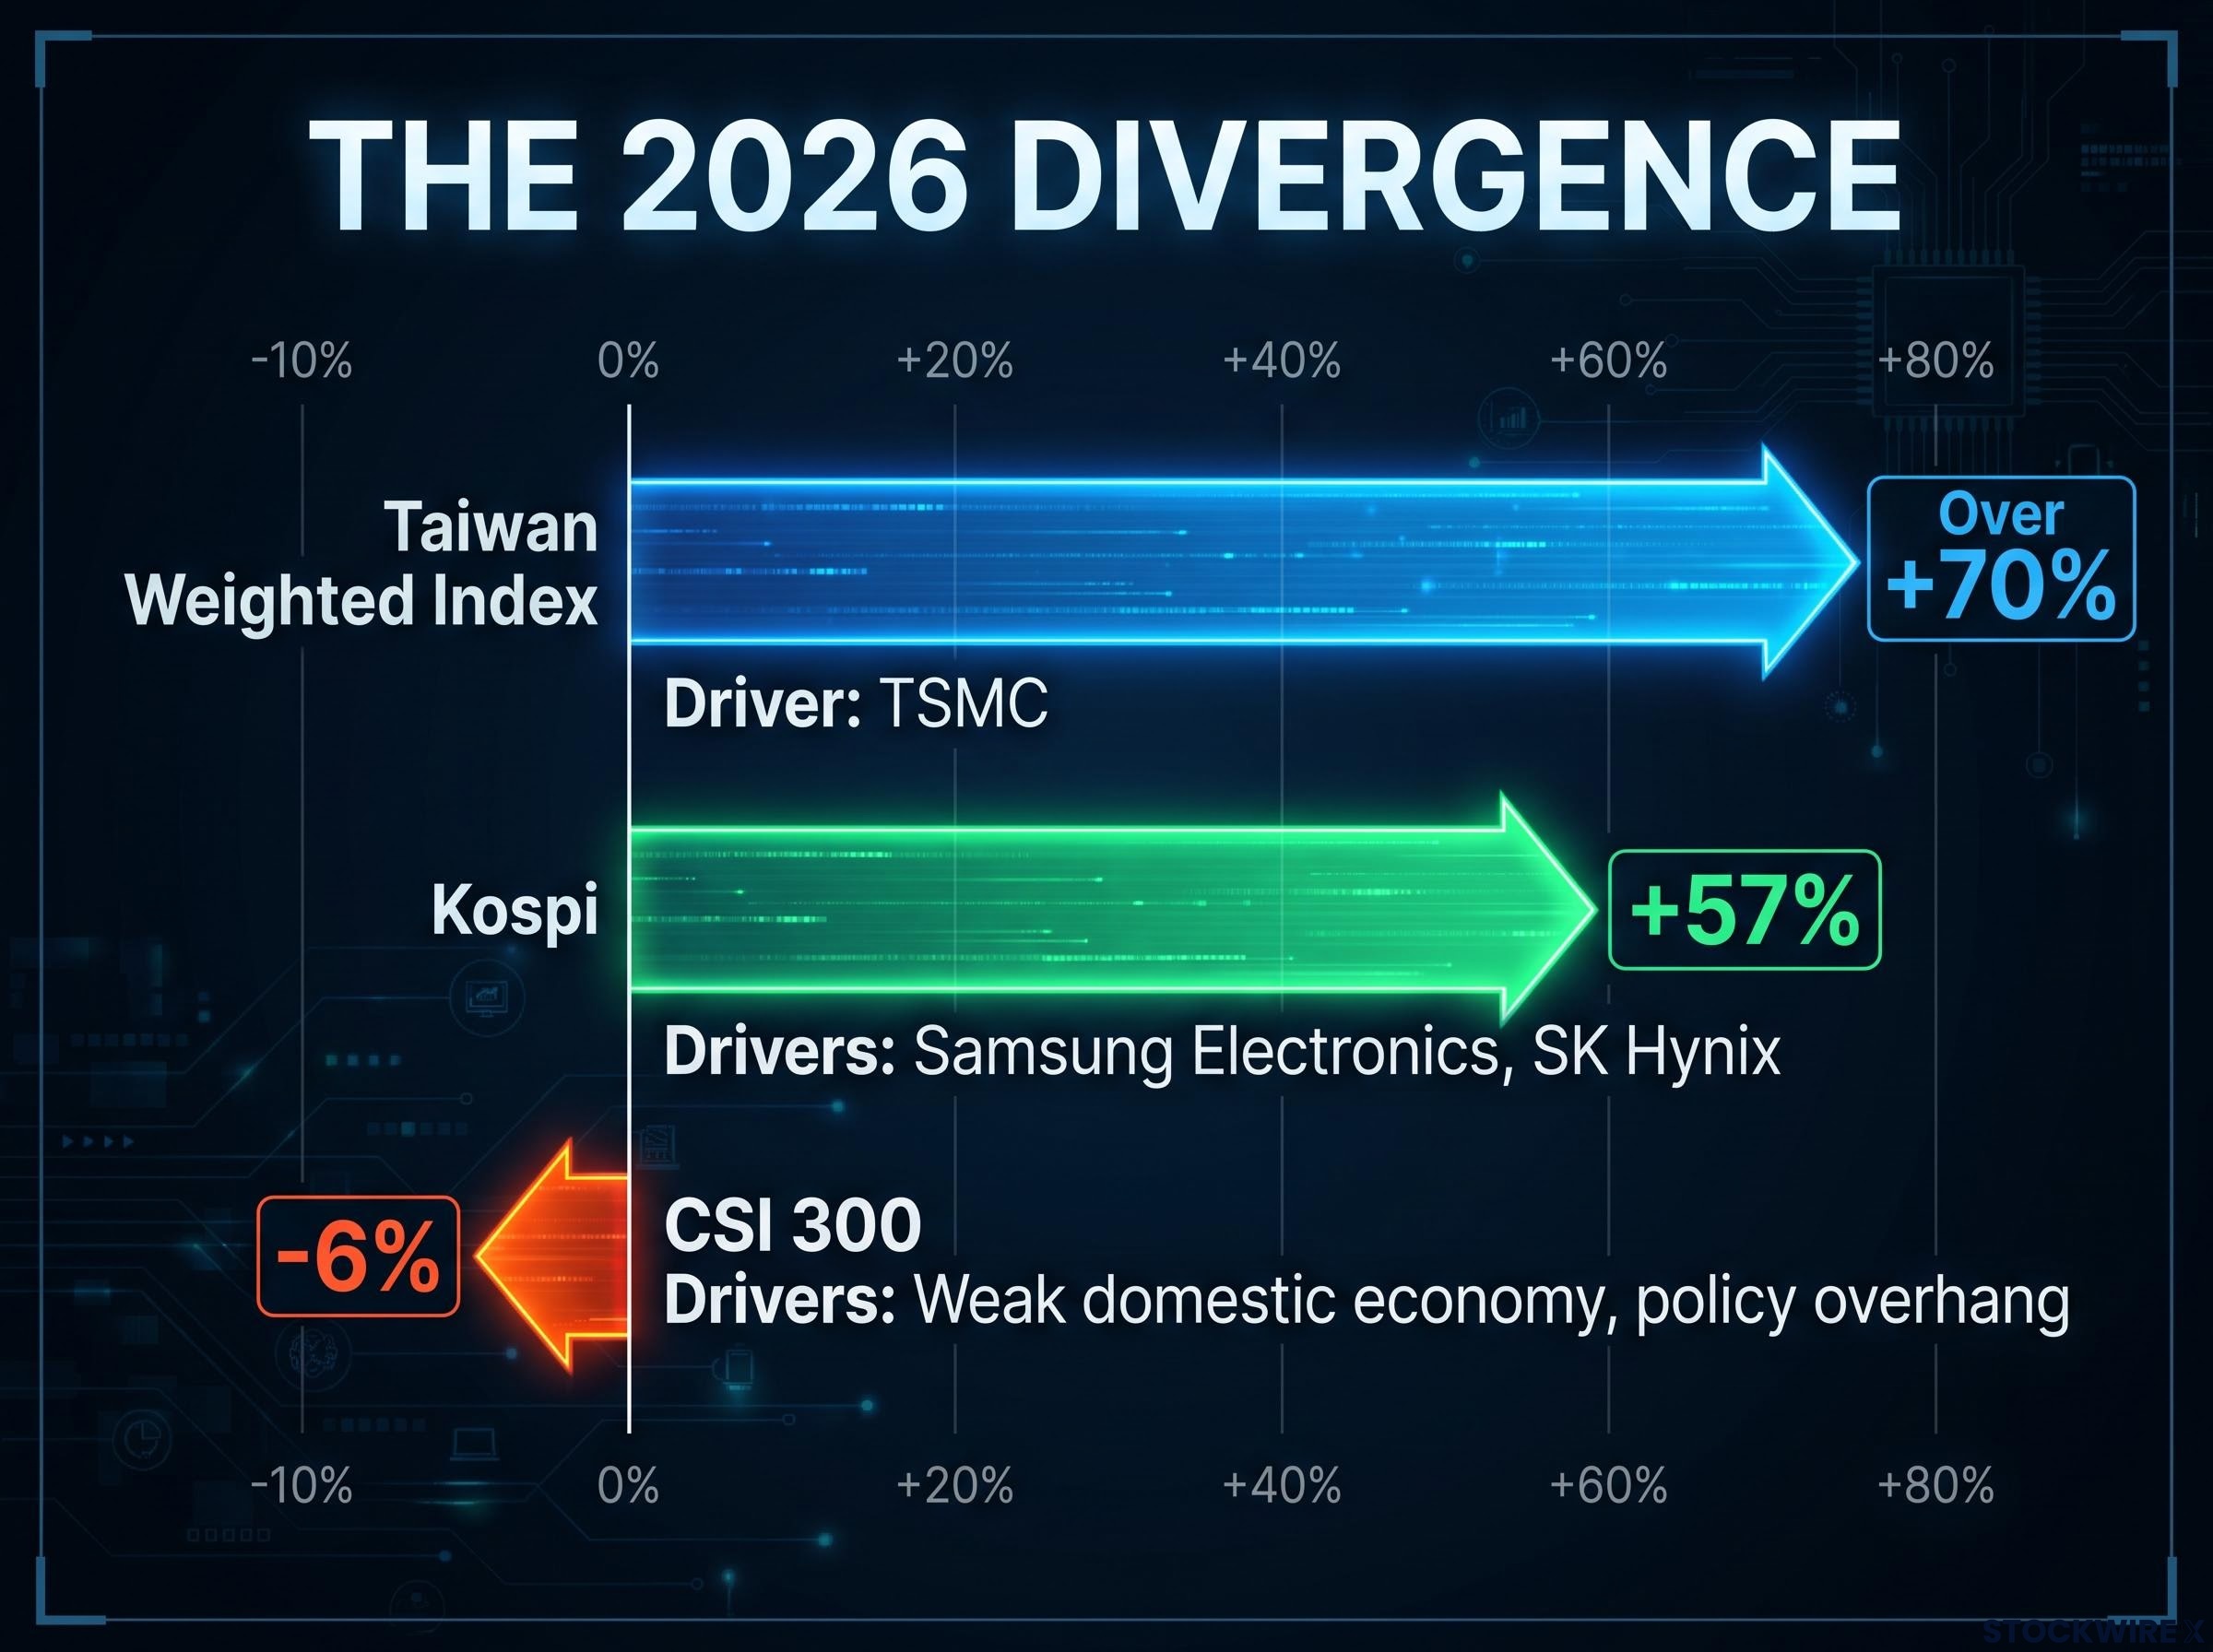
The exact Korea and Taiwan figures vary by measurement date. The Yardeni report via Investing.com put the Kospi up about 57% and Taiwan up over 70%, while later coverage described both as up “more than 65%“. AmInvest data as at 31 May 2026, a single-source figure, showed the CSI 300 up 5.66% and the Kospi up 101.13%, so China has swung from a mid-year gain into a loss.
| Index | 2026 YTD move | Dominant driver |
|---|---|---|
| CSI 300 (China) | Down almost 6% | Weak domestic economy, policy overhang |
| Kospi (South Korea) | About 57% (later cited as 65%+) | Samsung Electronics, SK Hynix |
| Weighted Index (Taiwan) | Over 70% (later cited as 65%+) | TSMC |
Yardeni’s three reasons build on one another rather than compete:
- Weak domestic economy: a drag on earnings confidence and consumer demand.
- Limited AI hardware exposure: the main benchmarks hold few chip makers.
- Regulatory and geopolitical uncertainty: a risk premium investors still demand.
The domestic economy and policy drag
China’s property downturn is now in its fifth year. Alongside deflation, soft consumption and youth unemployment, the slump has shrunk what households own and left local governments with far less money from selling land.
Regulators have begun a structural housing overhaul that phases out presale-linked mortgages and extends loan terms to 40 years, though local enforcement has historically been where past property reforms stalled.
Policy sits on top of that. Beijing’s interference with Ant Group’s planned listing left a regulatory memory among investors, and US-China tensions raise the prospect of limits on chip exports and investment.
Moonshot’s release shows Chinese AI progress is real. It has not reached the index, and that tells you to check what a benchmark holds before assuming it gives you AI exposure.
When big ASX news breaks, our subscribers know first
What do the main indices actually own?
A stock index is a basket of shares. Its return reflects what sits inside that basket, not where the headlines are.
That simple point explains most of the gap. Here is what each benchmark leans on:
- Kospi: dominated by Samsung Electronics and SK Hynix, memory chip makers tied to global AI infrastructure spending.
- Taiwan Weighted Index: heavily driven by TSMC, the contract chip maker that builds advanced AI processors.
- CSI 300 and MSCI China: weighted toward financials, industrials, consumer companies and traditional tech.
China is strongest in AI models, applications and cloud platforms. The companies making its hardware are mostly absent from the main benchmarks, held privately or listed offshore, and US export controls on advanced chips and equipment limit how far China can participate in high-end AI hardware.
The effect shows up day to day. A KSINQ market note from 30 July 2026, a single-source example, linked large Kospi swings to SK Hynix and Taiwan’s index moves to TSMC.
If you hold a broad China index expecting AI upside, you are mostly holding banks, industrials and consumer names. Judge its performance with that in mind.
The Kospi’s concentration in Samsung Electronics and SK Hynix cuts both ways: it drove a 29.5% rebound in under two weeks, but a single chipmaker earnings miss could reverse gains just as quickly.
Precedents for progress without returns
History offers illustrations, not proof. China’s own internet platforms grew rapidly in the late 2010s, yet crackdowns kept valuations below global peers. Europe produced strong engineering during the cloud era, but its indices lacked cloud leaders, and Japan’s component makers could not offset deflation and governance headwinds.
The lesson Technological progress can sit alongside years of equity underperformance when index composition and policy point the wrong way.
Why haven’t strong earnings lifted valuations?
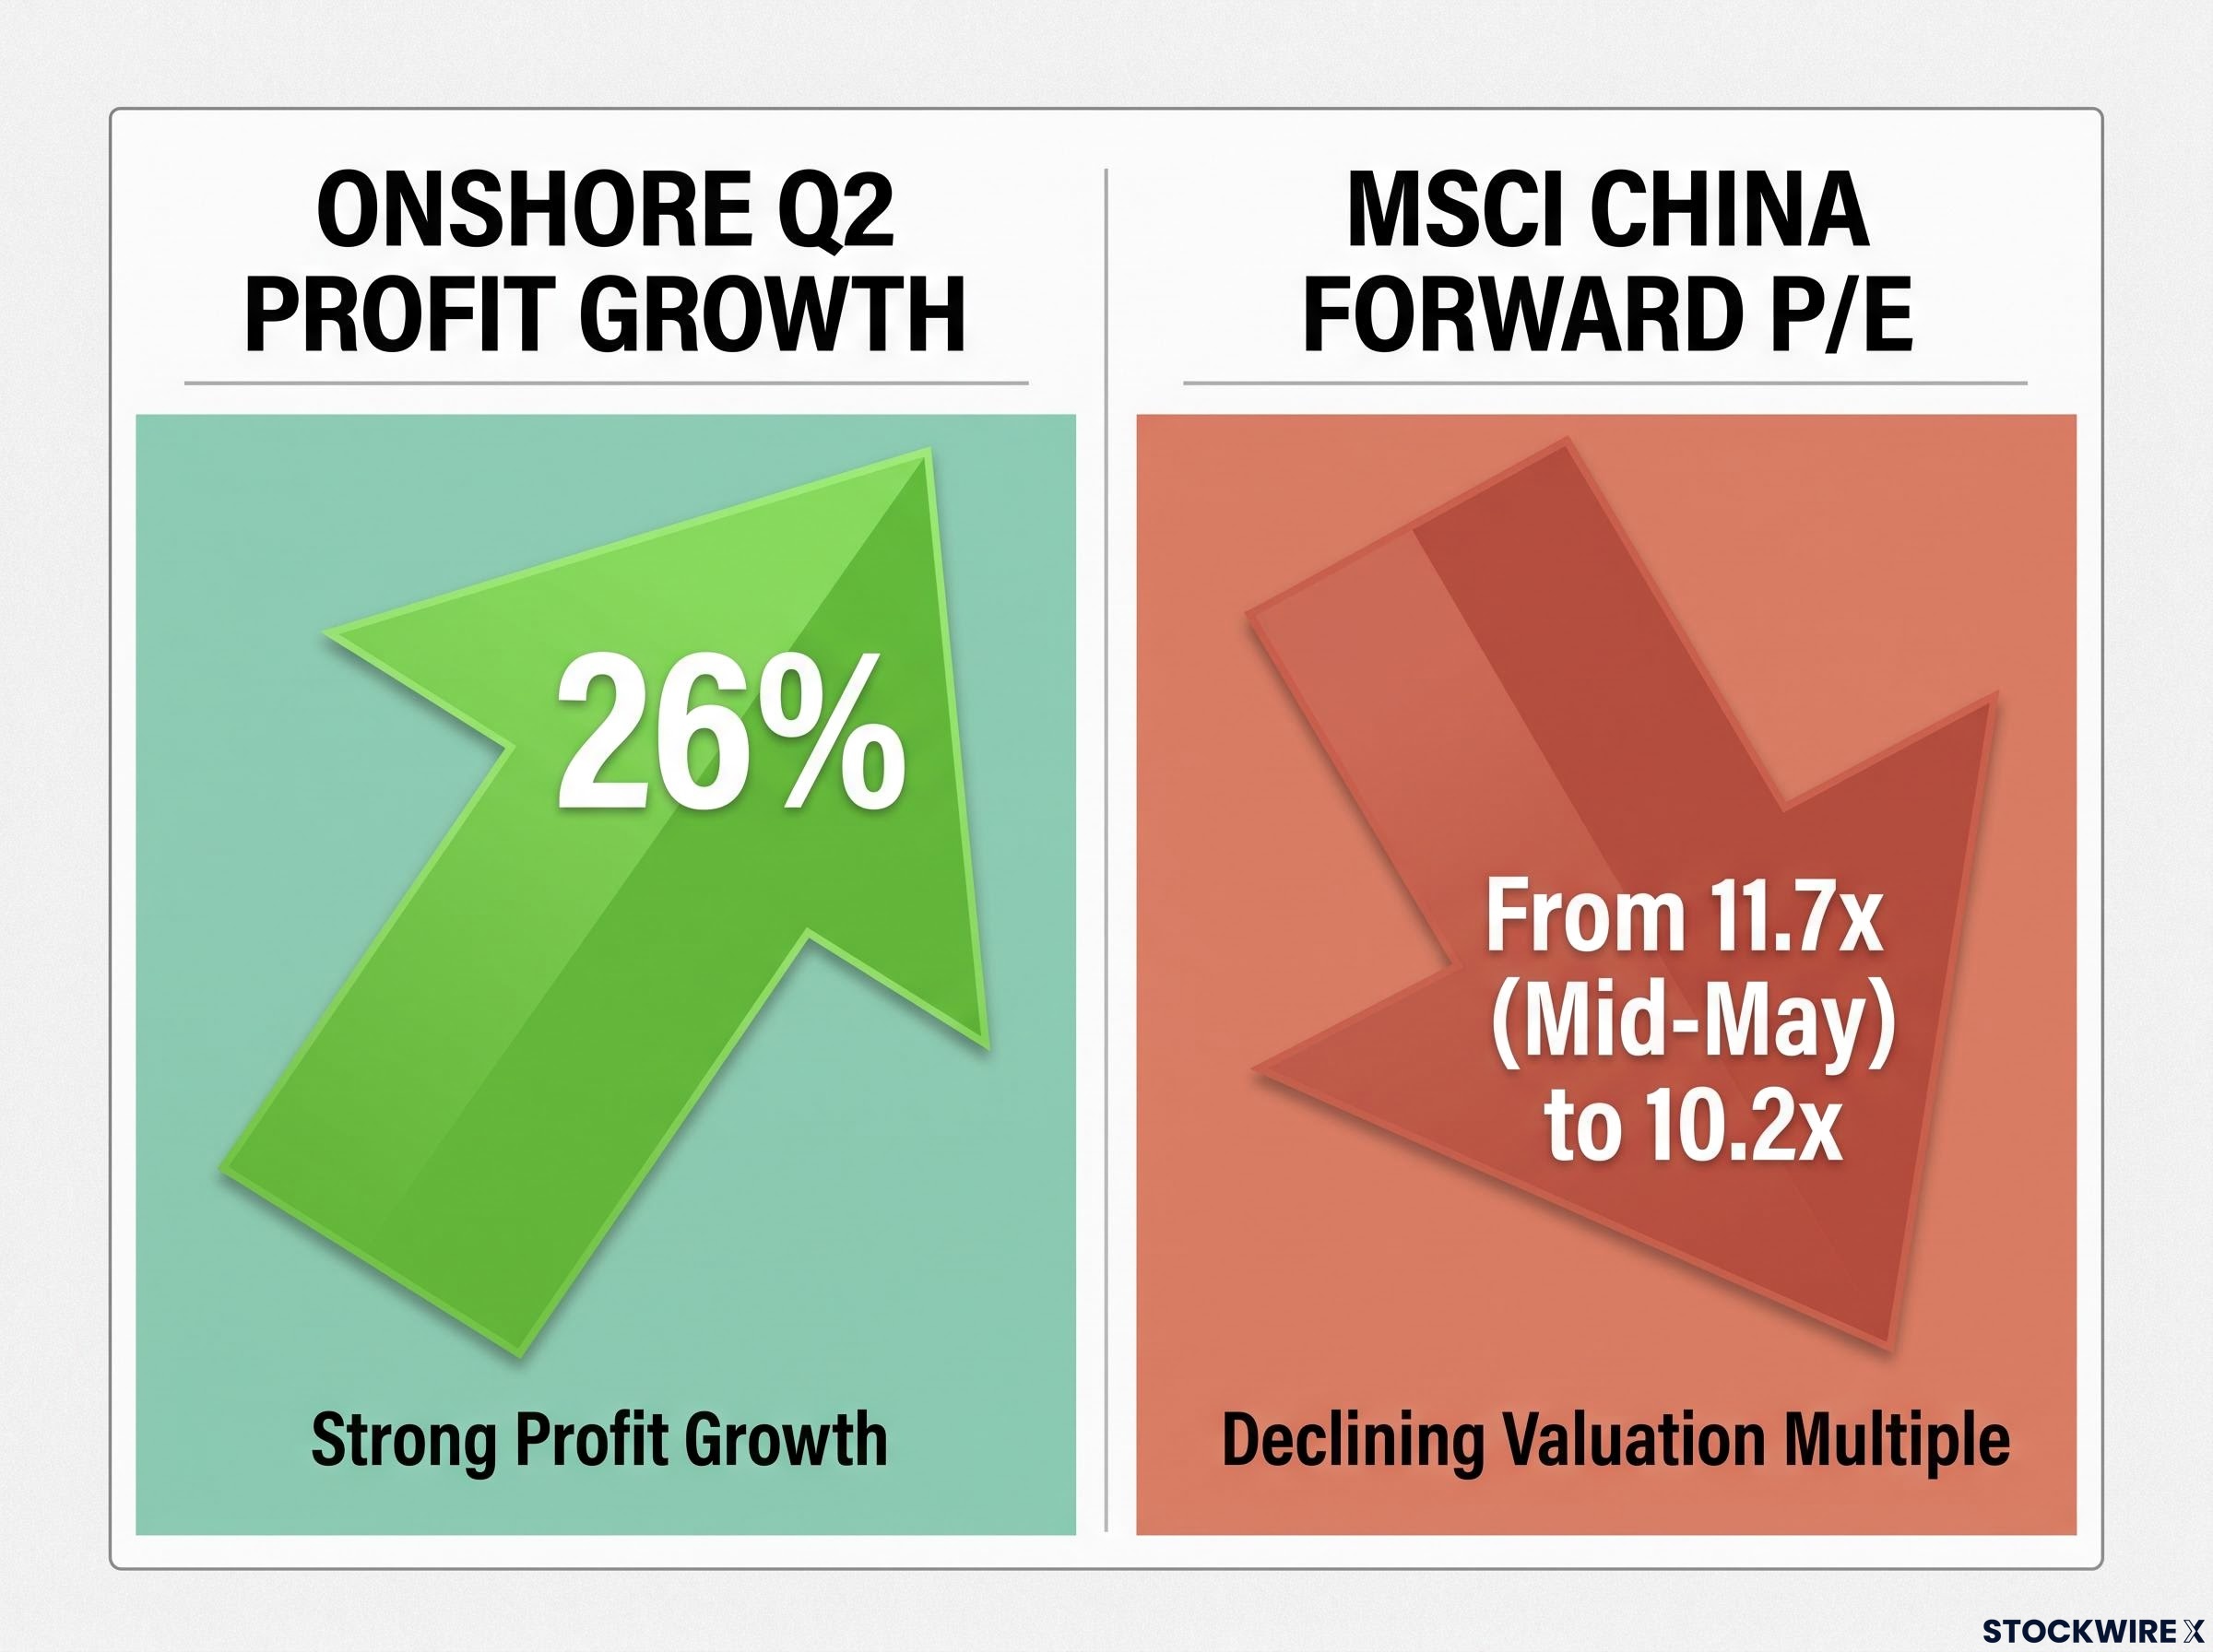
On profits alone, a rally should be under way. Onshore Chinese companies reported Q2 profit growth of nearly 26% year on year, the strongest quarterly gain in five years.
The CSI 300 is still down for the year. The multiple did the opposite of what earnings implied.
A forward price-to-earnings (P/E) ratio measures a company’s share price against its expected profits over the next 12 months. A lower figure means investors are paying less for each dollar of future earnings. MSCI China’s forward P/E fell from 11.7x in mid-May to 10.2x, with late-September data near 10.15x.
The paradox in two numbers Onshore profit growth near 26%. A forward multiple that compressed from 11.7x to 10.2x.
Valuation figures vary because strategists use different methods and dates. Several snapshots below have not been independently confirmed.
| Source | Measure | Figure | Date |
|---|---|---|---|
| Yardeni/Investing.com | MSCI China forward P/E | 10.2x (from 11.7x) | October 2026 |
| Goldman Sachs (unverified) | MSCI China / CSI 300 forward P/E | 10.4x / 13.2x | 4 September 2026 |
| Nomura/Morgan Stanley summary (unverified) | MSCI China vs MSCI Asia vs S&P 500 | About 12x / 15x / 22x | 9 October 2026 |
| Market data (unverified) | MSCI China Q2 earnings growth | About 16% | Q2 2026 |
Current forward P/Es for the Kospi and Taiwan were not found, though both trade at higher multiples reflecting their hardware exposure. Strong earnings with a falling multiple tells you the market is discounting something other than profits, and that discount, not the growth figure, is the real question.
Could China’s AI export exposure turn from quiet strength into risk?
China’s stock market missed the AI boom. Its economy did not.
Nomura’s estimate Chips, computers and similar products make up around half of the growth in China’s exports.
So China is tied to AI spending through trade rather than through its benchmarks. Capital expenditure (capex), the money companies spend on physical assets such as data centres and servers, drives that demand, and AI-related exports such as servers, accelerators and networking gear could be exposed if it normalises (an unverified assessment).
China’s K-shaped economic split helps explain the mismatch: semiconductor exports are surging while property investment and consumer spending weaken, so the headline economy and the export engine tell very different stories.
The chain of impact would run roughly like this:
- Global AI capex slows.
- Demand for AI-related exports softens.
- China’s economy takes a hit, while chip-heavy Korea and Taiwan see the sharpest market reaction.
That last step matters. If the gap narrows, it may be because Korea and Taiwan correct, not because China outperforms.
China’s relative lag does not insulate you from an AI downturn. If you are treating Chinese equities as a hedge against an AI-led correction, a narrower gap would not automatically be good news for those holdings.
Value opportunity or value trap: where do strategists land?
Strategists agree China is cheap. They disagree on why, and on how quickly that changes. Most figures below have not been independently confirmed.
| Strategist | Stance | Key figure | Basis |
|---|---|---|---|
| Yardeni Research | Cautious | CSI 300 down almost 6% | Hardware gap, weak economy, policy drag |
| Goldman Sachs | Constructive | About 14% 2026 profit growth | Onshore tech selloffs; valuations near 10x |
| JPMorgan Private Bank | Constructive | About 20 points behind MSCI Asia ex-Japan | Mean reversion; earnings about 13% (2026), 14% (2027) |
| Nomura | Modest upside | MSCI China up about 9% | Base case |
| Morgan Stanley | Modest upside | About 6% upside | Discount acknowledged |
JPMorgan describes its underperformance gap as one rarely exceeded in two decades. Yet the 6-9% forecasts from Nomura and Morgan Stanley tell you even upbeat houses see the discount closing slowly, so weigh those cheap multiples against a long wait.
The Chinese equities valuation discount is also visible against the US, where the S&P 500 trades near 21x forward earnings, roughly double the multiple on MSCI China; the question is whether that gap reflects mispricing or a warning.
Segment matters too. Onshore shares (A-shares, listed in mainland China) differ from offshore shares listed in places such as Hong Kong, and MSCI research suggests onshore outperformed offshore by 28 percentage points in H1 2026. Check which segment a view refers to.
Opportunity versus trap, side by side
The opportunity case:
- Multiples near 10x, below regional and US peers.
- The best onshore profit growth in five years.
- A rare underperformance gap that may revert.
The trap case:
- Property drag, deflation and weak consumption.
- Regulatory memory and US-China tensions.
- Constrained hardware exposure, and earnings that have not become returns.
The balance tips on whether earnings eventually force a re-rating or the discount proves structural. Forecasts are speculative and subject to change; past performance does not guarantee future results.
What the gap changes, and what it does not
China’s lag reflects what its indices own, a weak domestic economy and lingering policy risk. It is not a verdict on Chinese AI progress.
Cheap valuations and strong earnings are real, but neither has yet proved to be a catalyst. And export exposure cuts both ways, linking China to the same AI spending cycle it missed in the market.
Four variables will shape which case wins:
- Whether the property market stabilises.
- Regulatory and US-China developments.
- The pace of global AI capex.
- The onshore versus offshore earnings picture.
Your call rests on whether you believe the discount is temporary sentiment or lasting structure. Track these four variables before deciding.
This article is for informational purposes only and should not be considered financial advice. Investors should conduct their own research and consult with financial professionals before making investment decisions.