Semiconductor ETFs shed roughly 5% in a single session, and yet the options market never stopped charging investors more to bet on the way up than to protect against the way down. That is the signal worth reading.
The timing makes it stranger still. SOXX, the iShares Semiconductor ETF, is up between 68% and 73% year-to-date as of mid-September 2026, depending on the reference date; SMH, the VanEck Semiconductor ETF, is up between 52% and 58% over the same stretch. A sharp down day inside a run like that forces a real question: is the AI chip rally cracking, or is this the kind of pullback the options market has already priced as temporary? The answer sits in the skew data, and the unusual cross-asset backdrop on the day makes it worth reading with care.
Here is what the options data actually tells you about how investors are positioned in SOXX and SMH after a sharp decline, what it means for anyone weighing upside exposure through year-end, and where that read runs out of road.
When markets break down across every asset at once, what the options are really pricing
Start with the session itself, because it was not a normal one.
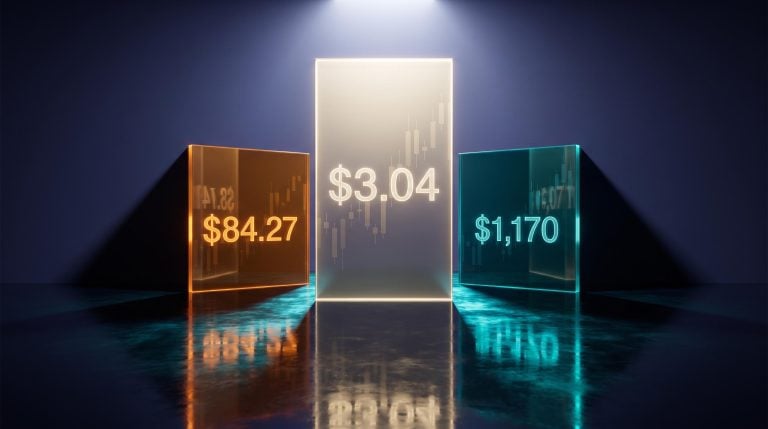
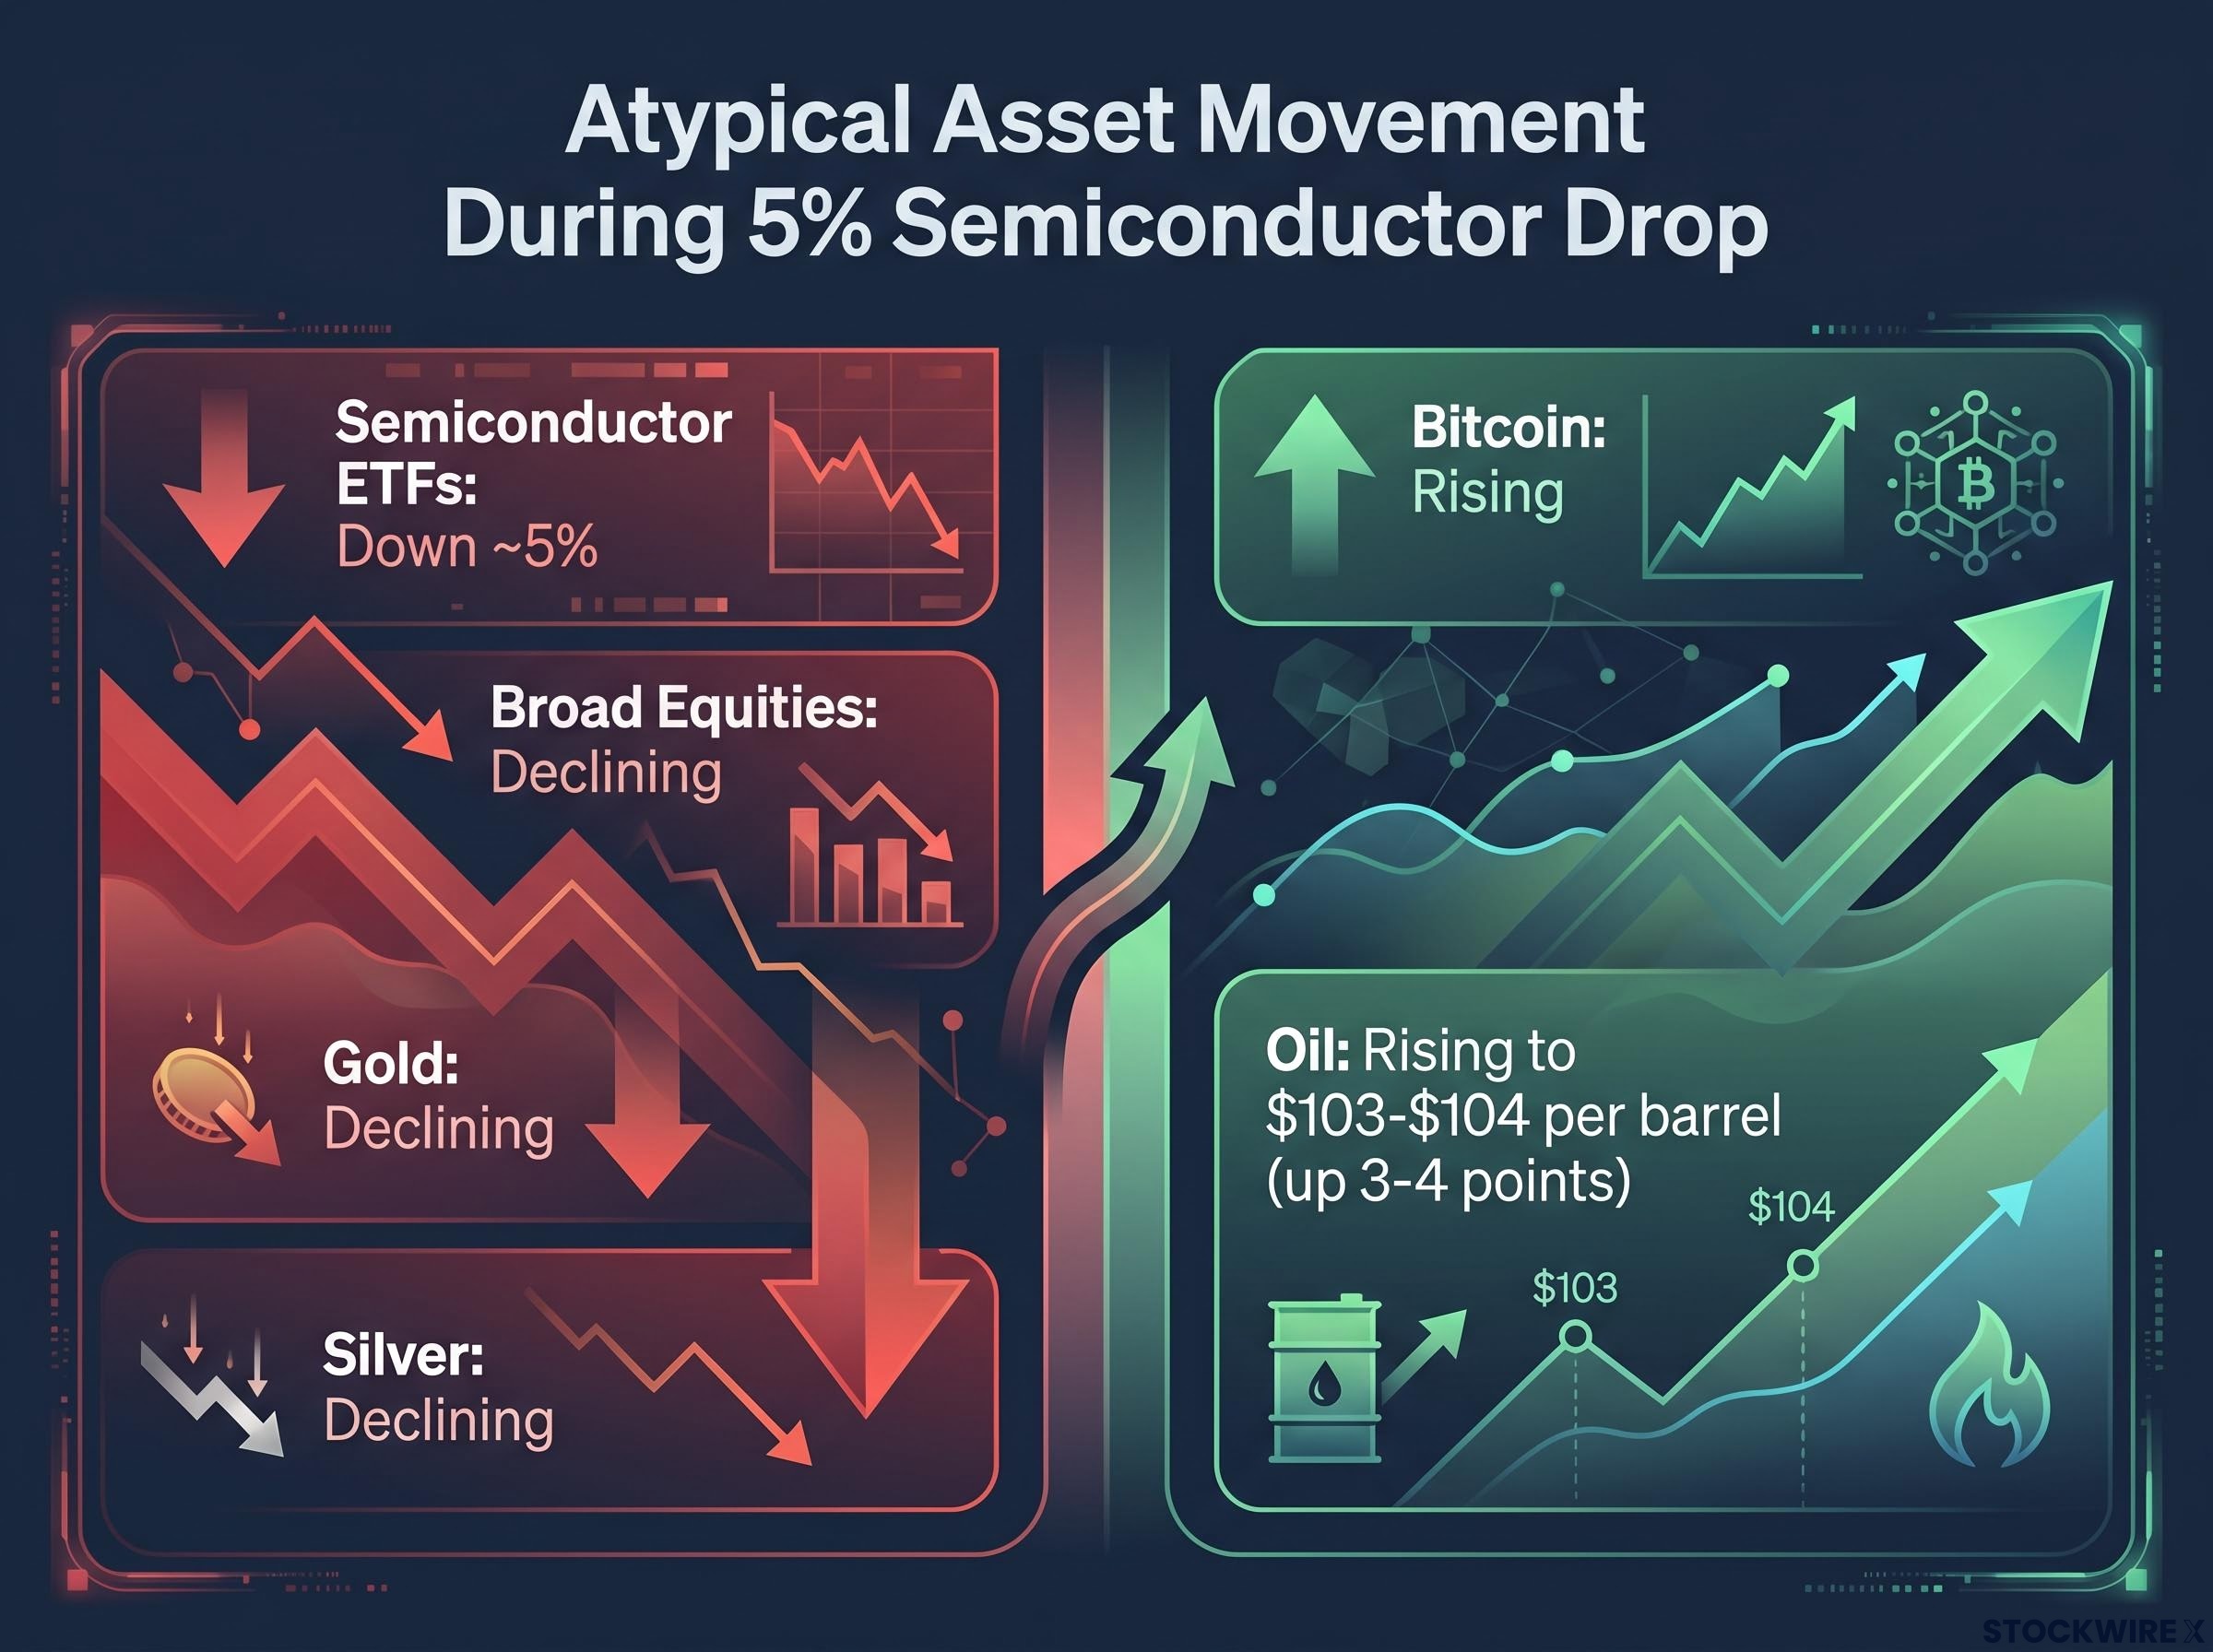
On the day the original analysis was conducted, semiconductor ETFs fell roughly 5% while broader equities were also declining, and several assets that usually move in opposite directions did not cooperate. Gold and silver both declined, conditions that would ordinarily give precious metals a bid. Bitcoin rose while equities sold off. Oil pushed up to around $103-$104 per barrel, gaining three to four points on the day.
Here is the configuration in full:
- Semiconductor ETFs down roughly 5%, with equities declining broadly
- Gold and silver both declining
- Bitcoin rising as equities fell
- Oil at approximately $103-$104 per barrel
When assets that normally diverge all move together, or move in combinations that make no clean sense, the usual risk-on versus risk-off framework stops explaining much. That is precisely when options markets become the sharper read on how a specific sector is positioned, because the noise in the broad tape drowns out the sector-level story.
SPX put positioning tells a contrasting story to the chip-specific skew: December SPX puts roughly 460-470 points out of the money are priced at a $2,600 premium over equivalent calls, a configuration that signals institutional hedgers are simultaneously buying broad downside protection while speculative demand in semiconductor names remains anchored on the call side.
Layered on top of that macro dislocation was something narrower: negative AI-related narratives circulating on social media that day, pressure aimed squarely at chip names rather than the wider market.
The distinction matters more than it looks. A 5% semiconductor decline inside a dislocated, multi-asset session carries different information than the same drop triggered by sector fundamentals such as a demand warning or an earnings miss. A macro-driven, atypical selloff tells you far less about the health of the AI chip thesis than a fundamentals-driven one would. That is exactly why the options pricing becomes so informative here: with the broad narrative scrambled, the skew shows you where positioned money is actually sitting.
When big ASX news breaks, our subscribers know first
What call skew actually means, and why chip ETFs show it so persistently
On a screen, call skew looks simple. Out-of-the-money call options are priced at a premium relative to equidistant out-of-the-money puts. That is the inverse of the usual equity pattern, where demand for downside protection makes puts the richer side of the book.
Three structural forces keep this configuration in place for SOXX and SMH specifically.
The first is concentration. Both funds lean heavily on a small set of AI leaders, primarily NVIDIA, and that concentration keeps demand for upside exposure sticky even when the broad market corrects.
The second is systematic call-buying. Investors chasing leveraged upside in a high-beta thematic sector buy calls persistently, and that steady flow tilts pricing toward the call side.
The third is dealer inventory. When dealers are structurally short calls because clients keep buying them, they mark calls richer relative to puts regardless of near-term price direction, simply to manage their own risk.
SpotGamma dealer hedging mechanics detail how continuous delta rebalancing by market makers amplifies the effect of persistent one-sided order flow, which explains why structural short-call positions in dealer books mechanically elevate call implied volatility independent of any directional view on the underlying.
The most telling evidence that this is structural rather than a mood reading came in late June 2026. According to derivatives commentary from GlobalMktObserv, SOXX fell -7.7% over the week ending 28 June 2026, one of the steepest weekly declines of the year, and call skew held throughout.
Volatility dispersion compounds the skew story: when a handful of AI names drive outsized index moves while broader components lag, index-level IV is structurally suppressed even as single-stock risk premiums stay elevated, which is precisely why SMH’s IV rank near the bottom of its yearly range does not mean semiconductor options are correctly priced for the concentration risk underneath.
GlobalMktObserv, June 2026 Investors were “aggressively positioned for US semiconductor upside,” with call demand near its most elevated levels of the year even as the ETF suffered one of its worst weeks.
That the skew survived a -7.7% week tells you something important: it is not a timing signal. It does not compress the moment sentiment softens. What it does give you is evidence of where long-duration, positioned money is anchored, which is a narrower but more durable claim.
Skew also varies meaningfully across AI-chip vehicles, so it is not a uniform feature of the theme. The table below shows how differently these products priced their tails in mid-2026.
| ETF | Skew measure | Implied volatility | Reference date |
|---|---|---|---|
| SOXX | 3-month put/call skew ~1.13 (down from ~1.32 peak) | 66.39% (call IV, weekly) | 28 June 2026 / 31 July 2026 |
| SMH | Pronounced call skew (calls richer than equidistant puts) | Not disclosed in research | Day of original analysis |
| CHPX | 25-delta skew -0.007 (roughly flat) | 56.6% (ATM) | 31 July 2026 |
One note on the SOXX figure: the GlobalMktObserv put/call ratio of 1.13 is expressed in a convention where a reading above 1.0 would normally suggest puts are richer. Yet the same commentary states plainly that calls were significantly more expensive than puts. The substantive finding, calls priced above equidistant puts, is consistent across every source, including the live-platform analysis. CHPX, the Global X AI Semiconductor and Quantum ETF, showed a 25-delta skew of roughly -0.007, essentially flat, which is the useful contrast: the pronounced call skew in SOXX and SMH is not automatic across the AI-chip space.
The specific SOXX and SMH options data from the 5% down session
The numbers from that session make the asymmetry concrete.
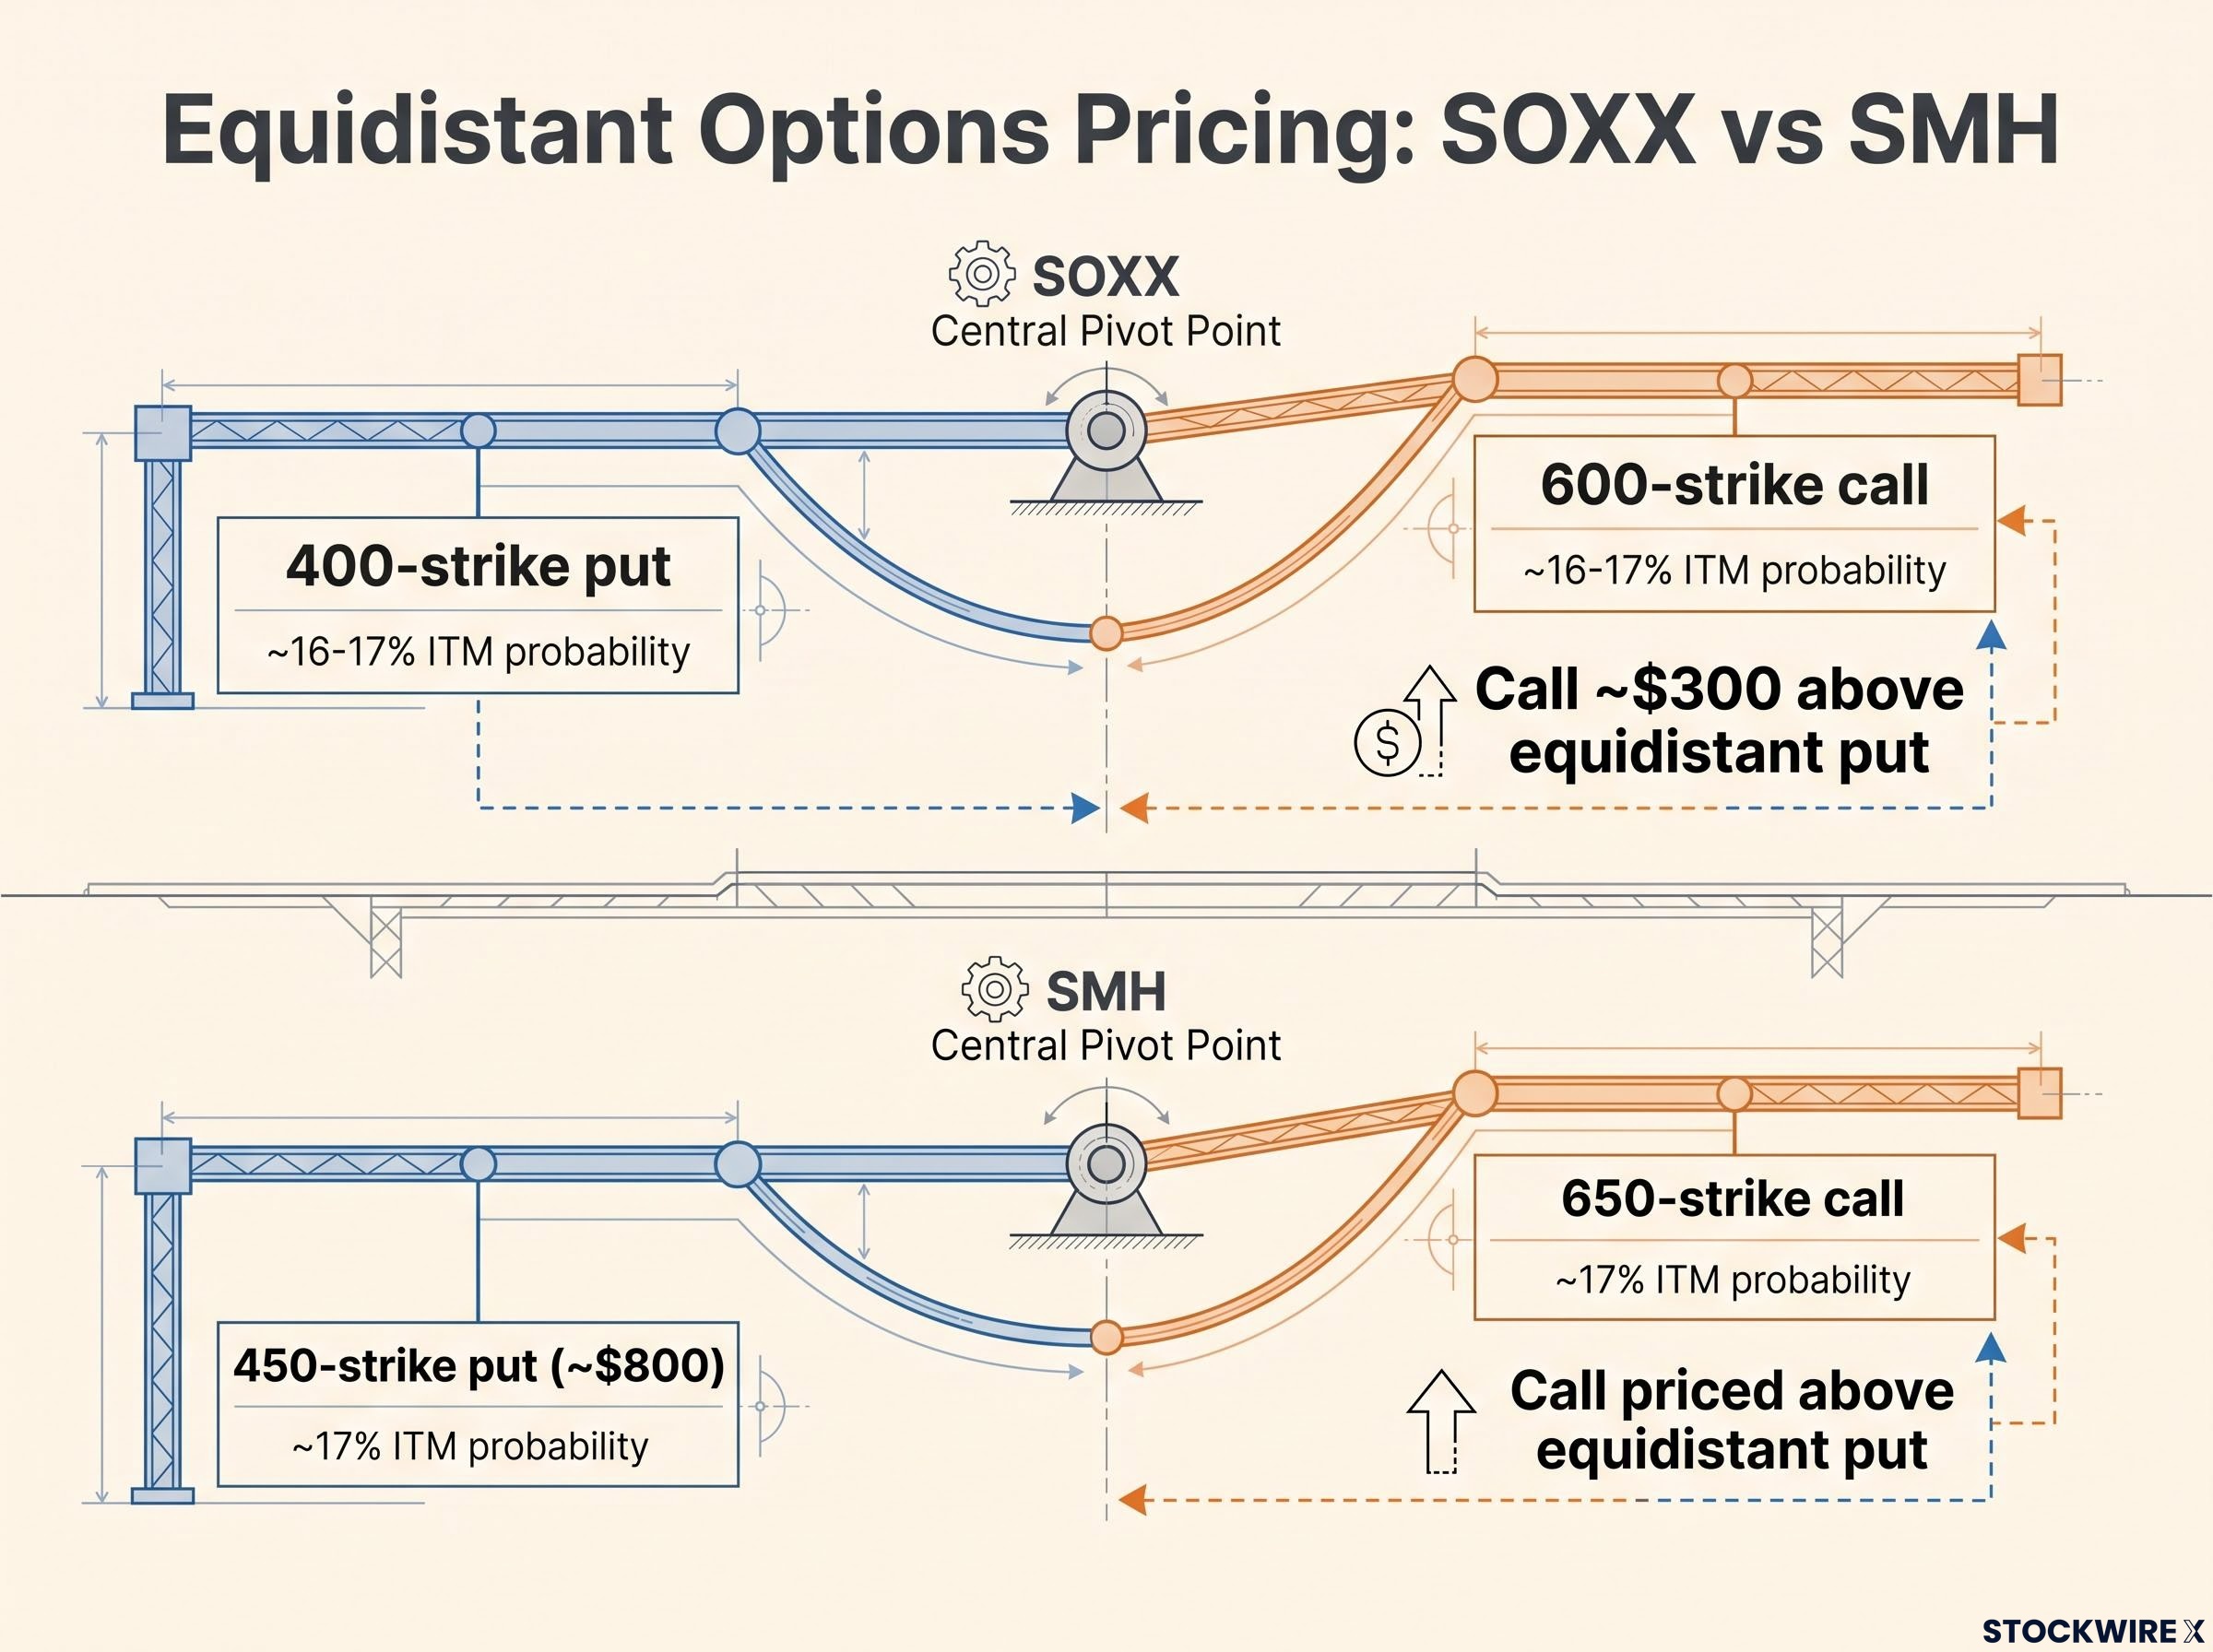
Take SOXX first. The 400-strike put, with roughly 95 days to December expiry, carried a 33% probability of touching the strike and a 16-17% probability of finishing in the money, placing it near one standard deviation below the then-current level. The equidistant 600-strike call was priced roughly $300 higher than that put.
That $300 gap is the skew, in dollars. It quantifies exactly how much more the market was charging to buy upside optionality than to buy equivalent downside protection at the same distance from spot. SOXX had previously reached a high of 655, a level the analysis judged unlikely to be retested by year-end.
SMH told a similar story from a different starting point, trading near 550 at the time. The 450-strike put and 650-strike call were each about 100 points out of the money, each with roughly 17% in-the-money probability. The 450-strike put was priced at approximately $800, and the equidistant call again sat above it. SMH’s prior pullback low sat near 505 from July, roughly 40 to 45 points below the analysis-session price.
| ETF | Put strike analysed | Call strike analysed | Premium differential | ITM probability |
|---|---|---|---|---|
| SOXX | 400 (put ~one SD below spot) | 600 | Call ~$300 above equidistant put | ~16-17% each |
| SMH | 450 (~$800) | 650 | Call priced above equidistant put | ~17% each |
Reading this kind of data follows a clear sequence:
- Locate equidistant out-of-the-money strikes, one put and one call the same distance from spot.
- Compare the two prices directly.
- Read the differential as the skew figure, the $300 in the SOXX case.
- Overlay the in-the-money probability to judge whether the strike is plausible by expiry.
SOXX exhibited slightly more call skew than SMH when comparing equidistant strikes. For anyone weighing these trades, that differential is the number that matters. It tells you whether the skew is worth acting on or simply worth knowing, and it separates a genuine positioning opportunity from the risk of paying up for enthusiasm you are already late to.
Four ways to read call skew, and what each implies for positioning
Call skew supports several readings, and some of them contradict each other. Here they are, ordered from most bullish to most skeptical.
- Bullish conviction. Elevated call premiums signal that investors believe the AI chip cycle is intact and pullbacks are temporary. Under this read, you treat the dip as a potential entry.
- Dealer-flow artifact. Skew reflects hedging and inventory management rather than any directional forecast, which means it is not a clean timing tool and you should discount its predictive value.
- Gamma and path-dependency. Heavy call open interest around round-number strikes forces dealers to hedge in ways that keep calls artificially rich, so part of the skew is mechanical structure, not sentiment.
- The risk read. Elevated call skew can sit alongside serious downside; if the AI narrative weakens or a key holding disappoints, skew can reverse hard as investors rotate into puts, so you size for that possibility rather than lean into it.
The late-June 2026 episode is the fullest data point available. SOXX fell -7.7% in the week to 28 June 2026, put/call skew held near 1.13, and both funds went on to extend their year-to-date gains through September, SOXX up 68-73% and SMH up 52-58% depending on reference date. That is one resolution pattern, not a universal template. Analysts caution that comparable skew configurations in other cycles have preceded extended volatility or sideways drift rather than clean recoveries.
SOXX put options have attracted institutional-level bearish positioning before: Scion Asset Management disclosed January 2027 puts at a strike of approximately $330, a roughly 37% decline bet that stands in direct opposition to the call-skew structure the market maintained through the same period.
The structural evidence tilts toward the more nuanced conclusion. Call skew is informative about where positioned money sits, but it is not a signal that the bottom is in.
What could flip the skew, and what to watch for
Four concrete triggers could compress the call premium quickly:
- An NVIDIA-specific shock, whether regulatory pressure, supply disruption, or demand normalisation, given the stock’s outsized weight in both funds.
- A macro or policy shift from the Federal Reserve, trade policy, or export controls.
- Deterioration in the AI narrative itself, driven by an earnings miss or regulatory action.
- Valuation compression, the standing risk in a sector that returned 169.68% (SOXX) and 135.91% (SMH) over the trailing year through mid-2026.
SOXX trailing-year return: 169.68% A performance runway this steep is real, but it also loads the sector with elevated mean-reversion risk.
Those trailing-year figures cut both ways. They confirm the demand story has substance, and they warn that the further a sector runs, the harder a correction can bite. Reading call skew as a green light without holding both truths at once is the most common mistake this data invites. Because skew regimes have historically shifted abruptly, sometimes within a single session, position sizing matters as much as the directional thesis.
What a 5% down day in a strong uptrend actually changes
Everything above points to one decision-relevant question. Does a 5% decline in SOXX or SMH, during a dislocated cross-asset session, change the calculus for investors weighing options exposure through year-end?
The honest answer is that it changes the arithmetic more than the thesis.
The original analysis framed the drop as a potential entry-point recalibration rather than a trend break, a reading the late-June precedent supports: a -7.7% weekly decline preceded continued outperformance through September 2026. Three conditions held together on the day:
The AI bull market runway debate shapes how much weight investors should place on call skew as a forward signal: Paul Tudor Jones estimated one to two years of runway remained in May 2026, framing current positioning as a risk horizon rather than an exit signal, a reading that sits uncomfortably close to the sustained hyperscaler capex commitments underpinning semiconductor revenue projections.
- Call skew remained elevated, so positioned money had not abandoned the upside.
- The underlying sat near but above prior support, with SMH around 550 versus its July low near 505, meaning a 5% decline did not erase the cushion.
- The AI demand thesis stayed intact in the options pricing despite the single-session selloff.
Here is the specific mechanical point. A lower underlying price shifts the whole probability distribution, which can make certain call strikes more attractively priced relative to their odds of finishing in the money. That is distinct from simply calling the dip a buying opportunity. The same $300 call premium over an equidistant put in SOXX may narrow in absolute terms once spot falls, softening the penalty for accessing upside convexity.
That is the specific, limited claim the data supports. Not a recommendation, but a clear statement of what changes and by how much: the strikes get cheaper, the skew persists, and the premium you pay for upside may loosen slightly.
Reading the skew clearly: what the data supports and what it leaves open
Pull it together and the core finding is narrow but useful. Call skew in SOXX and SMH after a 5% decline reflects structural investor positioning in the AI chip thesis. It is not a market consensus that the bottom is in, nor a guarantee that recovery is assured.
Two forward variables will decide whether the skew resolves bullishly: whether AI infrastructure demand stays durable through the year-end earnings cycle, and whether the sector avoids an NVIDIA-specific or macro-driven shock that compresses the call premium quickly.
The two-sided data anchors the point. A $300 call premium over an equidistant put in SOXX, and roughly 17% in-the-money probability on equidistant SMH strikes, tells you the market is pricing upside access at a premium but is not treating it as a certainty. Against year-to-date gains of 68-73% (SOXX) and 52-58% (SMH), that context matters.
Call skew tells you where positioning is anchored, not where price will go.
Investors who use this correctly will treat call skew as a positioning-context indicator, layer it against fundamentals and macro conditions, and size positions for the gap between structural bullishness and short-term path uncertainty. That is the difference between an informed input and a narrative you overweight.
This article is for informational purposes only and should not be considered financial advice. Investors should conduct their own research and consult with financial professionals before making investment decisions. Past performance does not guarantee future results. Financial projections are subject to market conditions and various risk factors, and statements about future outcomes are speculative and subject to change based on market developments.