On 16 September 2026, the Federal Reserve told the market the economy was in a stable place. On the same afternoon, several of the labour market indicators economists use to date recessions were sitting in territory that historically means one has already started.
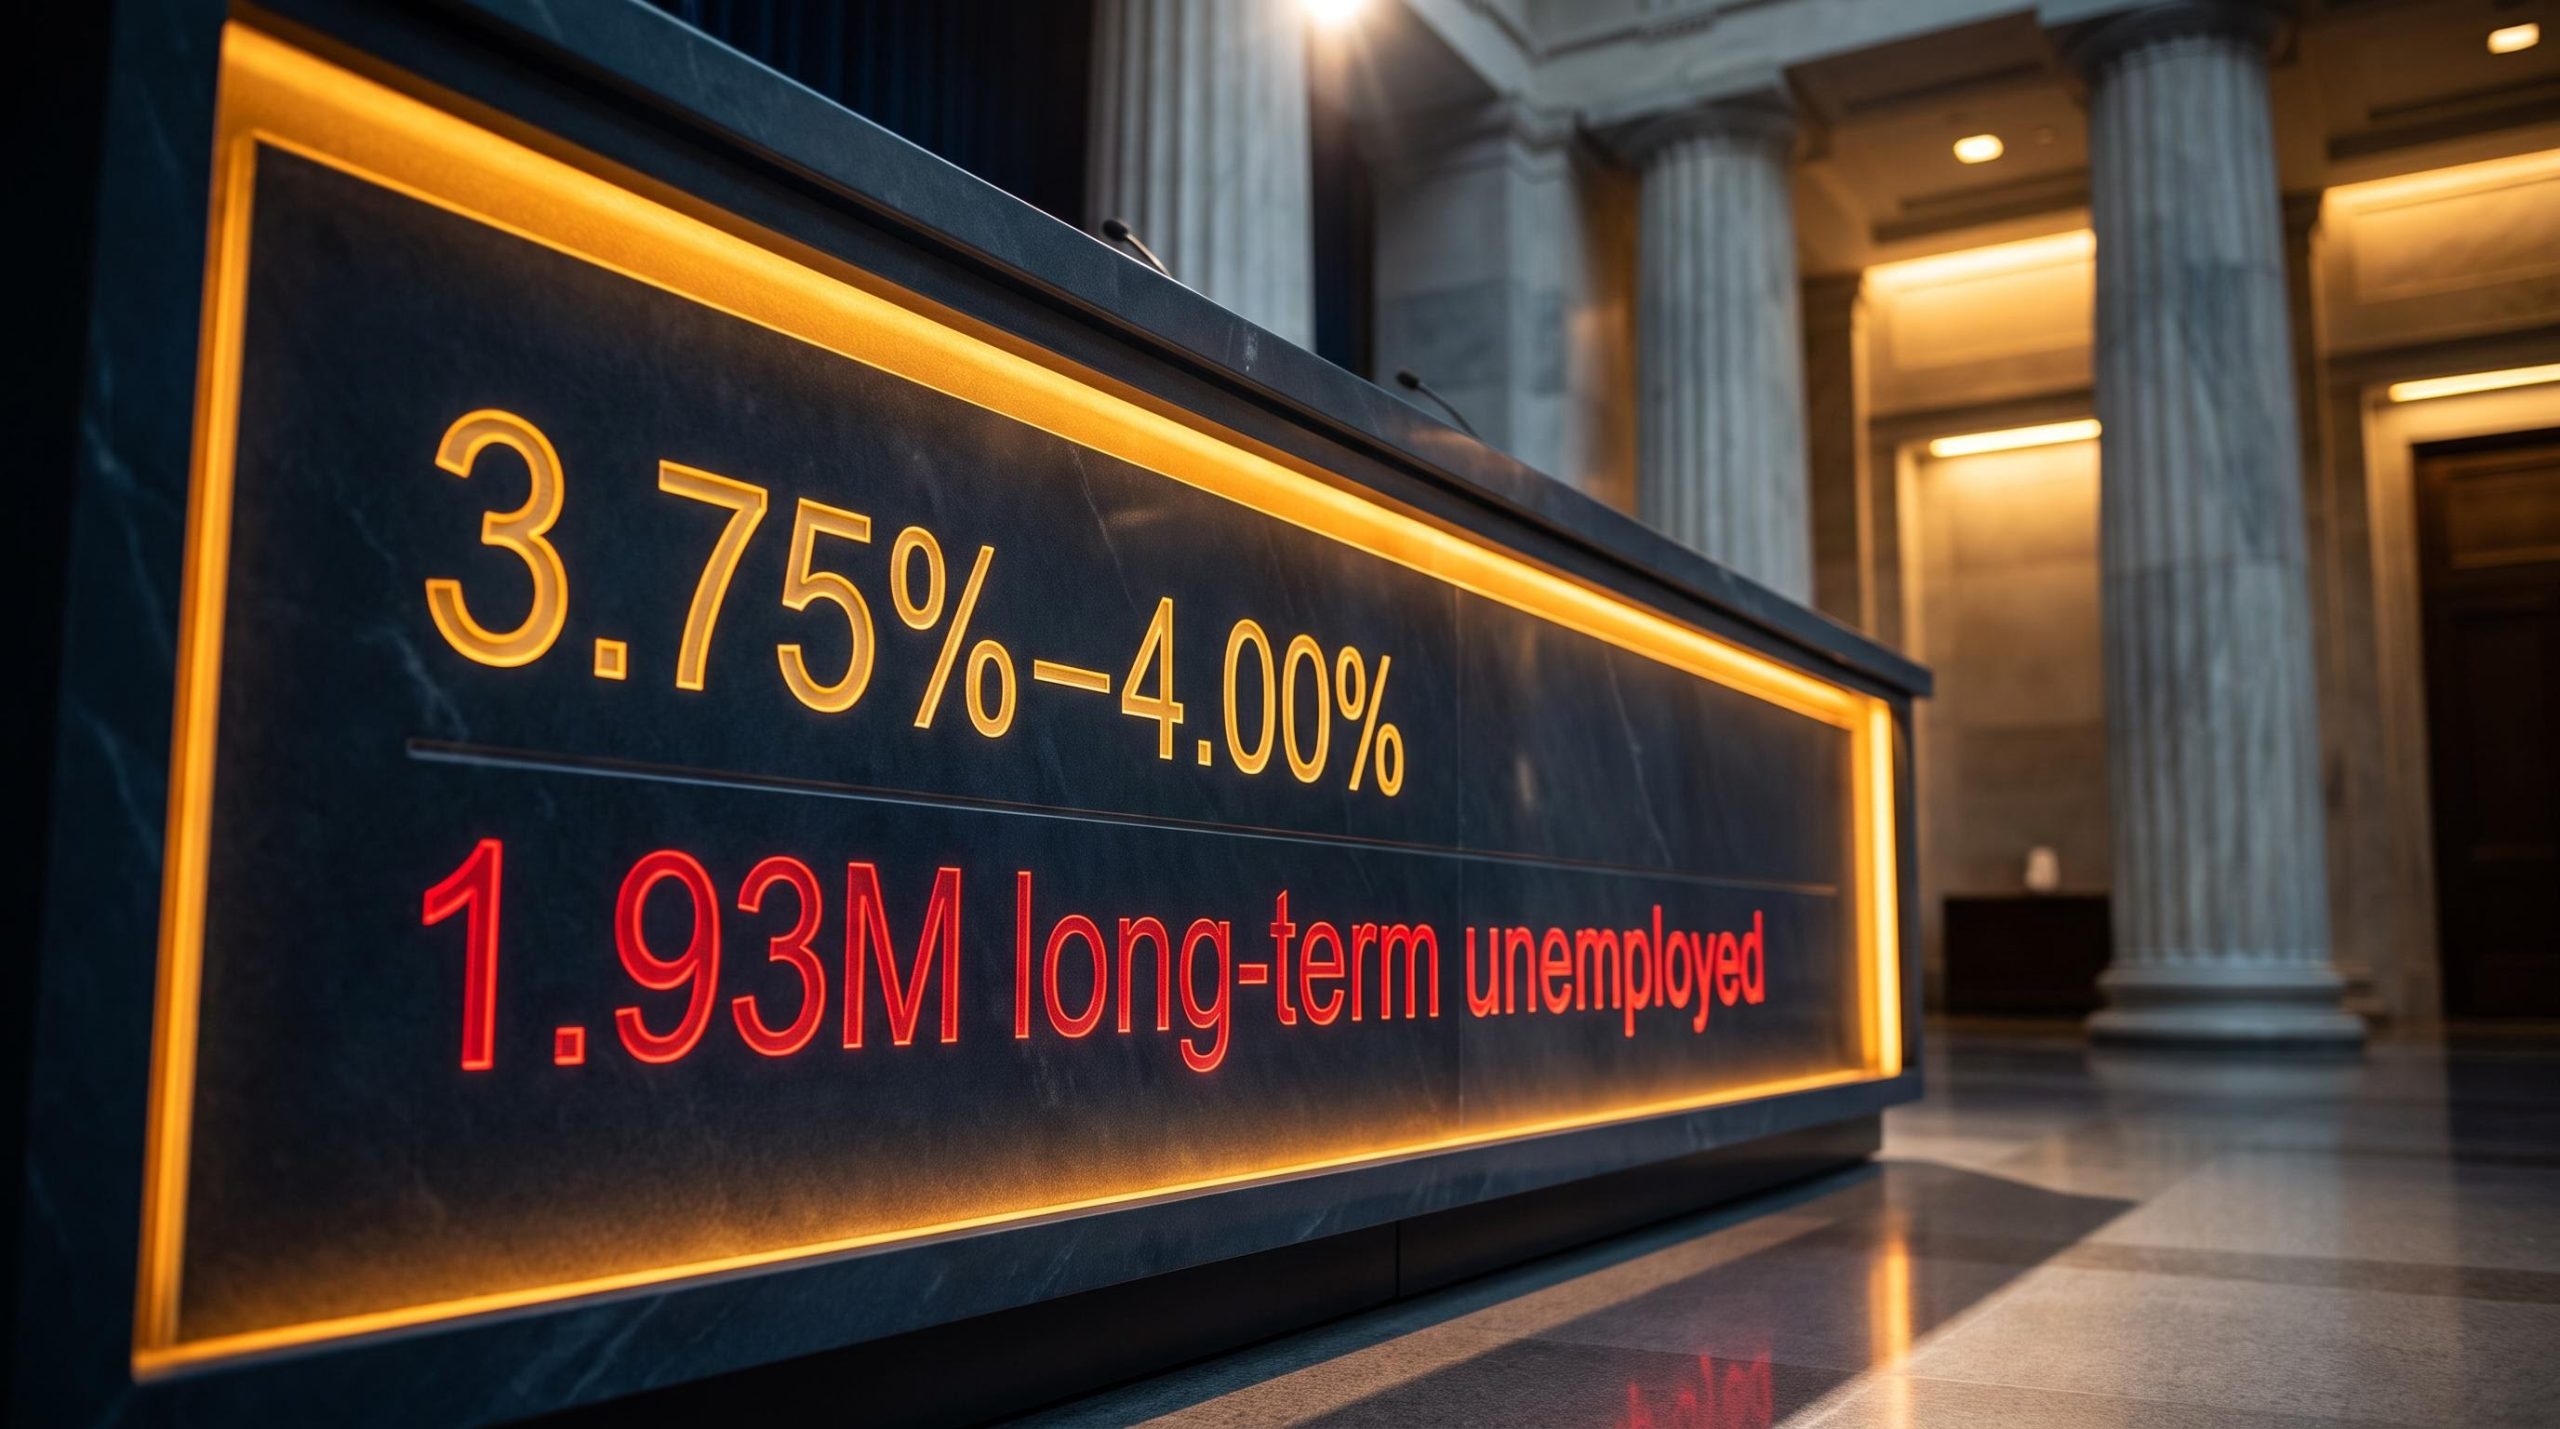
That contradiction is the story. The 25 basis point hike to a 3.75%-4.00% target range is not remarkable on its own. What matters is whether the Fed’s calm framing is a defensible read of the data or a narrative the institution is holding onto past the point the evidence supports it. With the 10-year Treasury yield near 5% and markets pricing three more hikes, that question carries real portfolio exposure for anyone holding duration or equities.
Here is what the data actually tells you about where the Fed stands and where the economy may be heading. This piece works through the official signal, the inflation numbers that are dirtier than they look, the labour market evidence being kept in the background, and the 2007 parallel that gives the whole picture its uncomfortable shape.
What the Fed actually signaled on September 16
The FOMC voted 12-0 to lift the federal funds target by 25 basis points to 3.75%-4.00%. Markets read the decision itself as dovish for the first hour or so. Then Fed chair Warsh stepped up to the microphone, and sentiment turned.
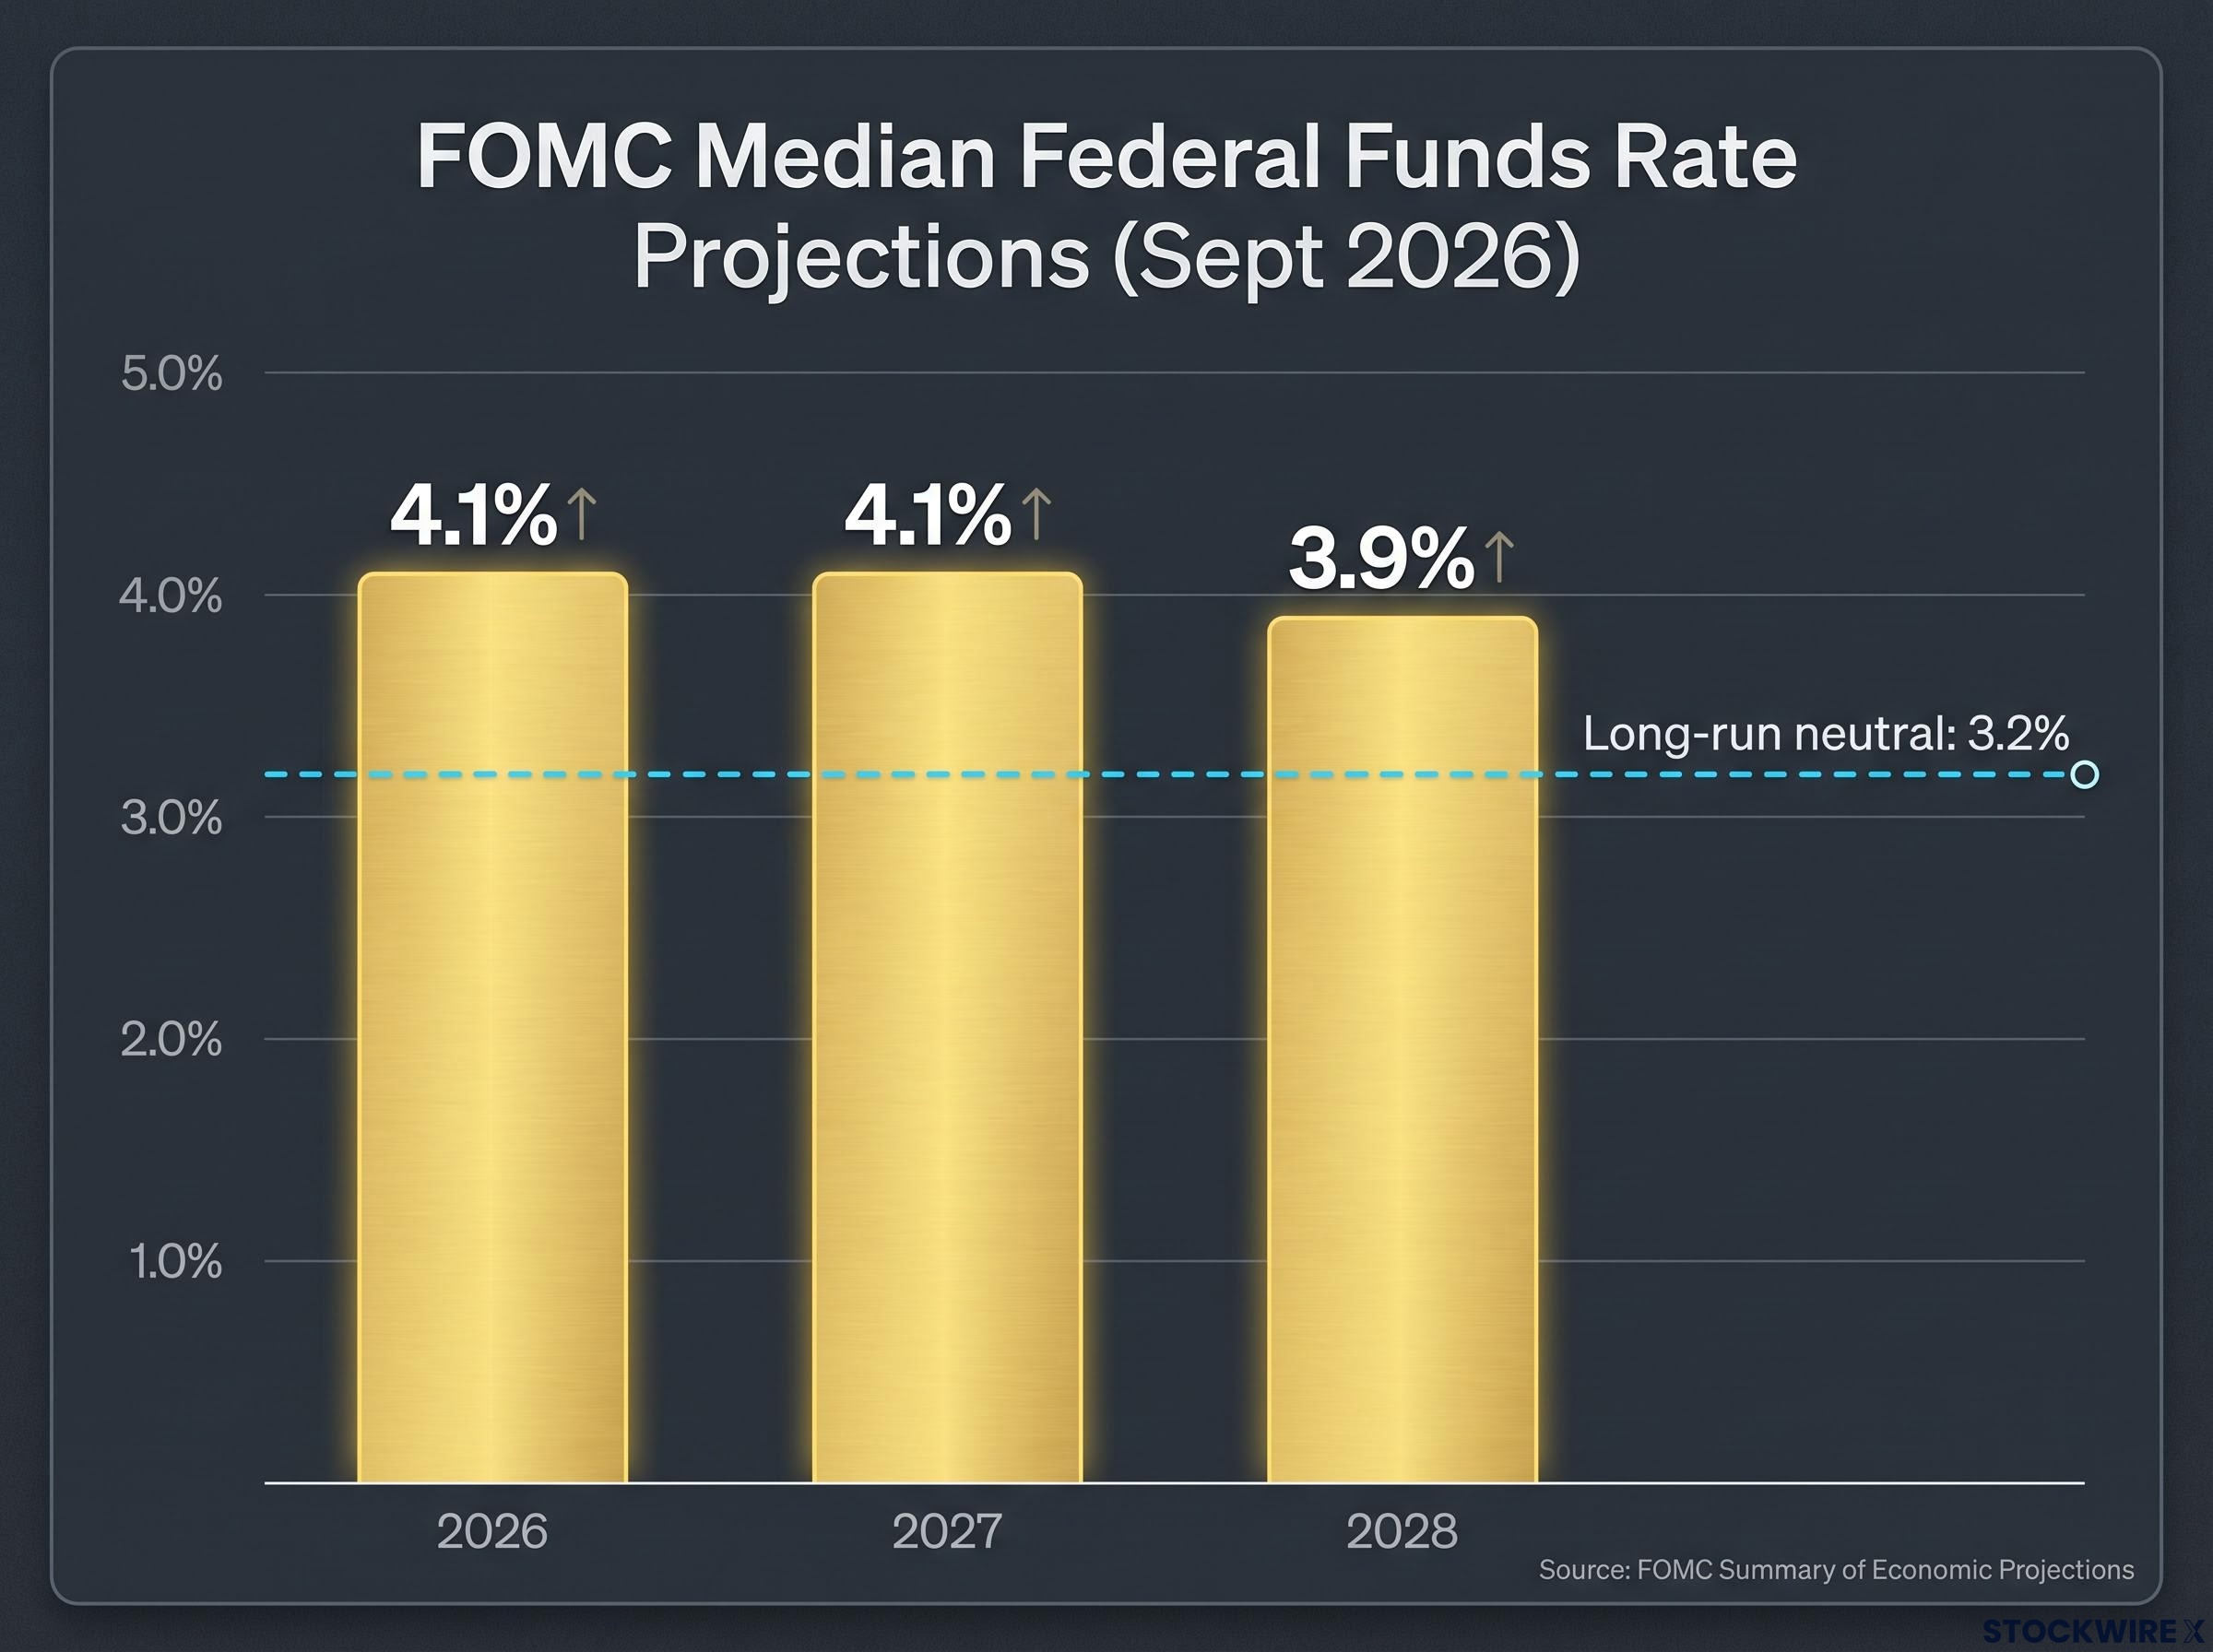
The updated Summary of Economic Projections (SEP) reset the median rate path higher. Participants now see the federal funds rate at 4.1% for both 2026 and 2027, up from 3.8% and 3.6% in the June projections. The long-run neutral rate, the level the Fed thinks is neither restrictive nor stimulative, sits at 3.2%.
The dot plot median carries more weight when you understand the voting mechanics behind it: the FOMC structure limits voting rights to 12 members at any meeting, meaning public hawkish commentary from non-voting regional presidents can shape sentiment without binding the actual decision.
| SEP median federal funds rate | 2026 | 2027 | 2028 | Long-run |
|---|---|---|---|---|
| September 2026 | 4.1% | 4.1% | 3.9% | 3.2% |
| June 2026 | 3.8% | 3.6% | Not directly comparable | 3.2% |
The dot plot the Fed is projecting A median of 4.1% for both 2026 and 2027. That is the path the committee is forecasting, not the path markets fully believe.
The press conference as a policy signal
Warsh ran the shortest press conference on record: 29 minutes. He stated a no-forward-guidance posture, then spent the session effectively communicating that more tightening is coming, an approach he had already previewed at Jackson Hole. The brevity itself read as hawkish. A chair confident in a pause tends to talk longer, not less.
He explicitly de-emphasised that day’s retail sales figures in favour of what he called underlying trends, a data-selective posture that lets the institution choose which prints define the narrative. He leaned on strong capital investment, particularly in AI, as a reason for confidence, and adopted a deliberately cool tone toward Treasury, trade, and fiscal policy, reasserting the Fed’s independence.
The gap between the stated no-guidance line and the actual message tells you the Fed is managing its optionality in public while signalling more tightening. For your positioning, that means pricing both the official path and the communication pattern, because the second is doing as much work as the first. Two-year Treasury yields at 4.73% show markets are already pricing three additional hikes, with one potentially landing in October before the election.
When big ASX news breaks, our subscribers know first
Why inflation data is less clean than it appears
Start with the trajectory, because it is genuinely encouraging. Core PCE, the Fed’s preferred inflation gauge that strips out food and energy, has fallen from roughly 4.7% to 3.3% year-over-year on the July 2026 data, with a monthly reading of +0.2%. FOMC members project it easing further to about 2.5% next year.
The breadth is improving too. The share of prices rising 3% or more, a metric Warsh cited directly at Jackson Hole, dropped from roughly 53% to below 50% in the most recent report.
The Jackson Hole metric The share of items rising 3% or more fell from roughly 53% to below 50%, the specific breadth measure the Fed chair singled out.
Now peel back a layer. Several of the recent upside surprises are temporary and mechanically set to reverse:
- An Airbnb policy change pushed platform fees onto renters, producing a one-off spike in the hotel component of CPI.
- A single wireless carrier price increase lifted a monthly reading that is expected to unwind.
- The Bureau of Economic Analysis (BEA) flagged that tying portfolio management fees to rising equity markets had overstated consumer demand in core PCE, a correction now in train.
Then look at the pending methodology revisions the BEA has already announced, which will move future readings in known directions:
The August 2026 CPI breakdown is where the transitory distortions become most visible: a gasoline spike from Middle East supply disruptions and a record single-month wireless services jump each inflated the headline reading while core CPI simultaneously fell to a five-year low of 2.4%.
- Computer peripheral pricing is being revised downward, a disinflationary adjustment.
- Legal fees, particularly bankruptcy attorney costs, will feed through more accurately from the Producer Price Index, an upside risk.
According to Danielle DiMartino Booth of Qi Research, the deeper signal is weakening corporate pricing power. Companies are increasingly unable to pass input costs to consumers, and real retail sales remain flat in volume terms, with nominal gains driven entirely by price rather than genuine demand growth.
Strip the transitory distortions out and the disinflationary trend is likely steeper than the headline suggests. That reframes the hike. If the Fed is tightening into a faster slowdown than its own models show, additional hikes start to look less like calibration and more like a possible policy error, and that is the lens to keep when the next inflation print lands.
The labor market data the Fed is not foregrounding
Headline unemployment held at 4.1% in the August 2026 BLS report, with 7.0 million people unemployed. The Fed’s July 2026 Monetary Policy Report described the labour market as stabilised, and FOMC projections keep the rate at 4.1% through 2029. Read only that line and everything looks fine.
It does not survive contact with the sub-surface data.
The long-term unemployed, those out of work for 27 weeks or more, reached 1.93 million in August, up from 1.771 million in July, and now make up 27.0% of all unemployed people. Job leavers, the voluntary switchers unemployed five weeks or less, stood at 914,000, roughly 13% of the unemployed, up from 793,000.
The recessionary crossover Long-term unemployed at 1.93 million now exceed job leavers at 914,000. Historically, when permanent job losses and long-term unemployment surpass voluntary switchers, the economy is conventionally treated as being in recession.
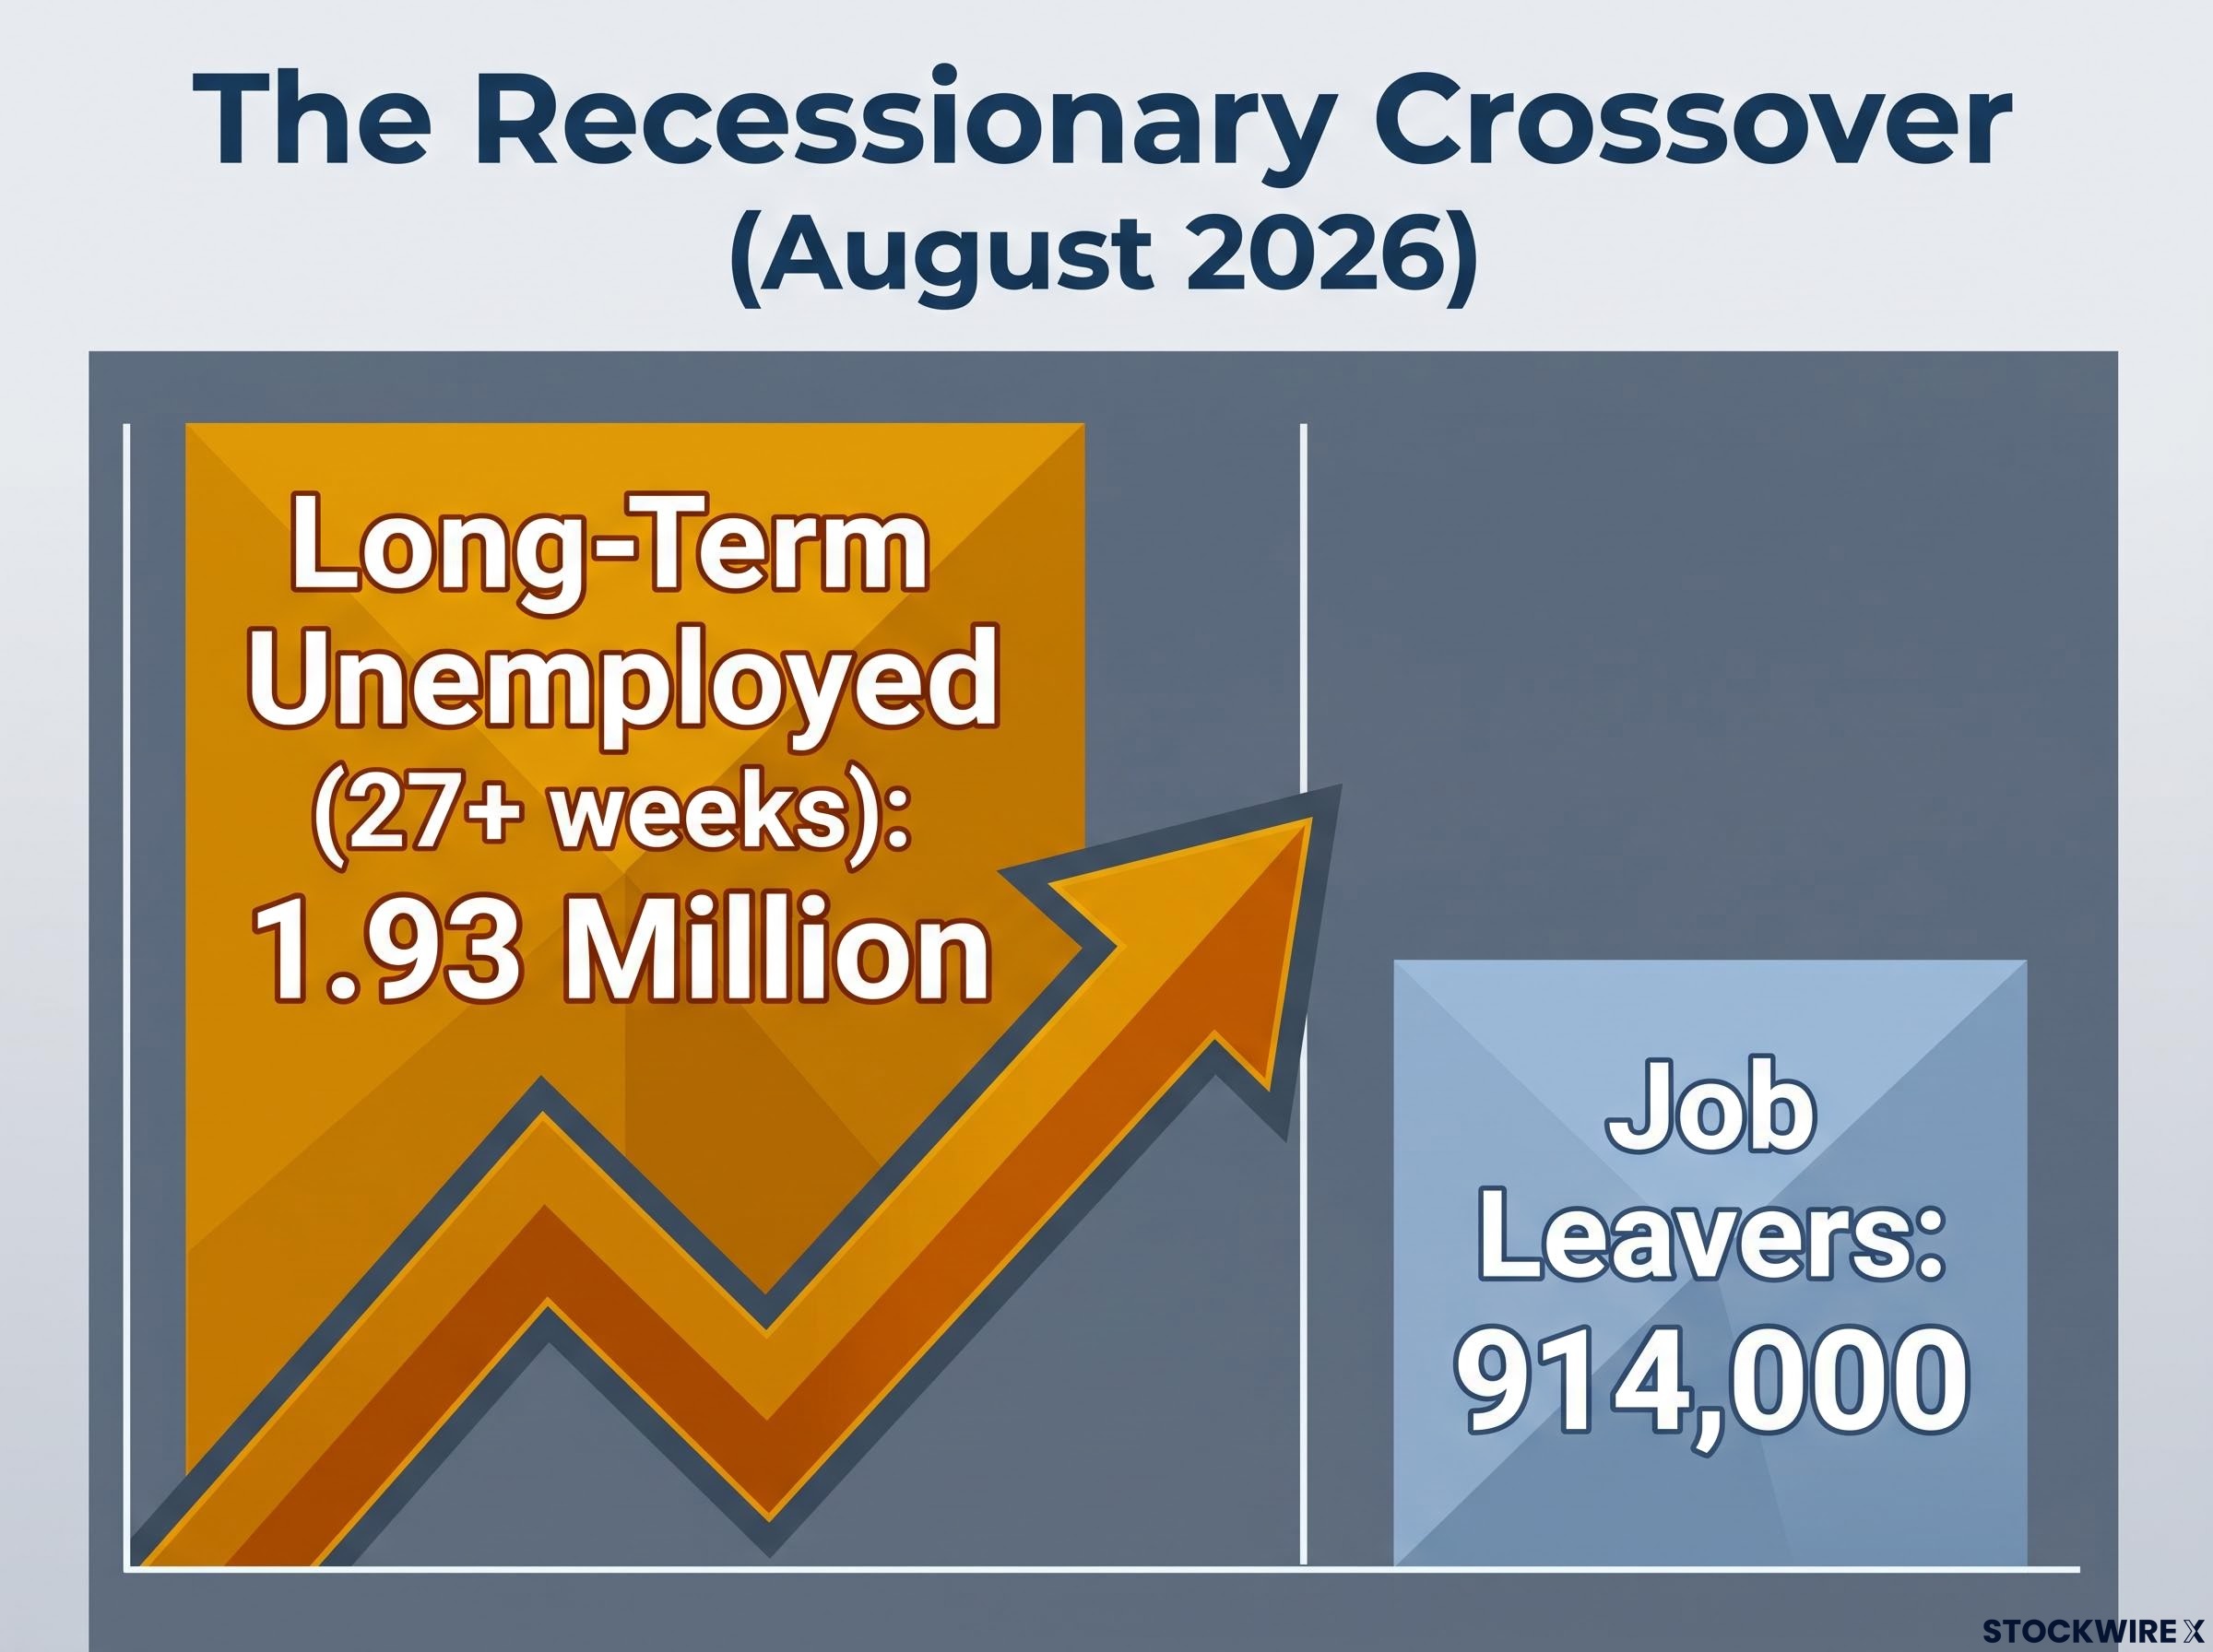
That ratio is not a lagging indicator waiting to confirm a downturn. It is the signal analysts use to date one, and it is already in recessionary territory by the historical standard. Set that against the Fed’s stabilised characterisation and the two readings do not reconcile.
The supporting indicators point the same way. The Sahm Rule, a recession-timing signal that triggers when unemployment rises far enough off its recent low, activated at a 4.3% reading. Broader underemployment, the U-6 rate, climbed to 7.8%. Median unemployment duration rose to 11.4 weeks, and 43% of the unemployed have been searching for at least 15 weeks, reported as the highest share in five years.
NBER research on the Sahm Rule examines its predictive reliability across multiple business cycles, finding the indicator’s trigger threshold has historically preceded official recession dating by a margin that makes real-time activation a credible signal rather than a lagging confirmation.
| Indicator | Current | Prior month | Signal |
|---|---|---|---|
| Long-term unemployed (27+ weeks) | 1.93M (27.0%) | 1.771M | Rising |
| Job leavers | 914,000 (~13%) | 793,000 | Below long-term unemployed |
| U-6 underemployment | 7.8% | Not stated | Elevated |
| Median unemployment duration | 11.4 weeks | Not stated | Lengthening |
| Sahm Rule | Triggered at 4.3% | Not stated | Active |
For anyone using the headline unemployment rate as shorthand for economic health, this is a material re-rating of recession risk. The indicators above are the ones that historically move first. The headline rate is the one that moves last.
Seasonal adjustment distortions compounding the picture
The reliability problem runs deeper still. The BLS uses concurrent seasonal adjustment, which weights the current and prior two years heavily. That recency bias means the algorithm can treat pandemic-era outliers and unusual weather as the new normal. Scotiabank Economics has noted that pandemic data produced some of the weakest July adjustment factors on record.
The clearest example: restaurant and bar hiring showed a spurious 59,000 jump in the month right after the World Cup wrapped up, a statistical artifact fully expected to be revised away. Brookings and Dallas Fed research document similar misadjustments from shifting school calendars and weather.
The implication for you is straightforward. Headline payroll prints that look healthy may be materially overstated before revision, which weakens the very data the Fed is citing to justify its confidence. That matters against a low bar: Goldman Sachs pegs breakeven job growth near 70,000 a month, while Peterson Institute and St. Louis Fed estimates adjusted for demographics and migration put it as low as 32,000-50,000.
The 2007 parallel and what it implies for portfolio positioning
Look back at 2007 and the structural echo is hard to ignore. The Fed held the funds rate at 5.25% for over a year as PCE inflation fell to roughly 1.9% by August 2007, keeping financial conditions tight even as the labour market quietly softened. The recession began that December.
The 2007 setup Declining core inflation, an elevated policy rate, and higher-for-longer language, the same combination that immediately preceded the December 2007 recession.
This is not the same as saying a recession is here. It is saying the current mix of falling core PCE and a policy rate held near 4% through 2027 rhymes with a pattern that has ended badly before. The expert community is split on what to do about it:
The mechanism running beneath the 2007 parallel is what Milton Friedman described as long and variable lags: policy tightening that feels calibrated at the time of the hike continues transmitting into the real economy for 12-18 months, which is precisely why a rate held restrictive through 2027 compounds risk even without additional moves.
- Hawkish camp: Bank of America forecasts three more 25 basis point hikes and a terminal rate of 4.25%-4.50%. A September Reuters poll found a majority of economists expecting at least one more hike by the end of March.
- Pause camp: Goldman Sachs, Oxford Economics, and Morgan Stanley favour holding to let the lagged effects of prior tightening transmit, wary of accidental overtightening. Commentary in The Hill suggested a rate near 4.5% could risk financial instability, and Fed Governor Michelle Bowman has signalled a preference for keeping policy powder dry.
Here is the point often missed. With the rate at 3.75%-4.00% and the long-run neutral estimate at 3.2%, policy is already restrictive. As core PCE keeps falling, the real restrictiveness rises passively, even without another hike. That is worth factoring into duration and equity risk now, not after the next move.
Three concrete events will decide whether this cycle holds its trajectory or forces a recalibration:
- The three non-farm payroll reports before the December FOMC, watched against the adjusted 32,000-50,000 breakeven rather than the headline print.
- The October rate decision, complicated by its timing just before the election, with one hike currently priced in.
- The next core PCE release, and whether it stabilises near 2.5% or keeps undershooting.
Where the weight of evidence actually sits
Put the four pieces together and the conclusion is difficult to soften. The Fed’s calm framing does not square with labour market indicators that historically precede recessions, and the inflation distortions suggest the disinflationary path is steeper than the projected rate path reflects. Core PCE at 3.3% and falling, long-term unemployed at 1.93 million exceeding job leavers at 914,000, a triggered Sahm Rule, U-6 at 7.8%, a dot plot median of 4.1% through 2027, and neutral at 3.2% do not describe a Goldilocks economy.
The Fed’s scenario can still prove correct. It holds under specific, checkable conditions:
- AI-driven capital investment, which Warsh cited without attaching a figure, generates genuine demand rather than displacing labour.
- Payroll data survives revision at levels well above the adjusted breakeven.
- Core PCE stabilises at or above 2.5% rather than undershooting.
If those hold, the pause camp is wrong and the additional hikes are calibrated. If they do not, the tightening compounds into a slowdown the Fed’s own models are late to register. Goldman Sachs has already lifted its 12-month recession probability to 25%.
Goldman Sachs lifting its 12-month recession probability to 25% puts the market squarely into amber-light positioning territory, a zone where the operationally correct response is neither defensive liquidation nor complacent inaction but a deliberate tilt toward resilience with defined trigger levels for escalation.
Three data releases that will clarify the picture before December
The three upcoming non-farm payroll reports are the most important near-term inputs. For each, watch three things: the headline number against the 32,000-50,000 adjusted breakeven, the long-term unemployed ratio relative to job leavers, and whether the expected revision to that 59,000 restaurant and bar anomaly actually materialises.
The portfolio-level considerations the recessionary-signal case implies:
- Duration extension: rising passive restrictiveness supports the case for taking on longer-dated exposure as growth risk builds.
- Defensive sector positioning: sub-surface labour weakness argues for tilting toward more resilient sectors ahead of confirmation.
- Recession probability re-rating: the next three data cycles are the window in which the market either confirms or discards the current soft-landing assumption.
You are now positioned to judge whether the next hikes represent calibrated policy or compounding risk, with specific goalposts rather than an abstract worry.
This article is for informational purposes only and should not be considered financial advice. Investors should conduct their own research and consult with financial professionals before making investment decisions.
Past performance does not guarantee future results. Financial projections are subject to market conditions and various risk factors, and forward-looking scenarios described here are speculative and subject to change based on incoming data and Fed policy decisions.