The S&P 500 looks calm. Daily moves have been modest. The index sits near recent highs after a post-earnings surge, and spot VIX is not flashing anything alarming.
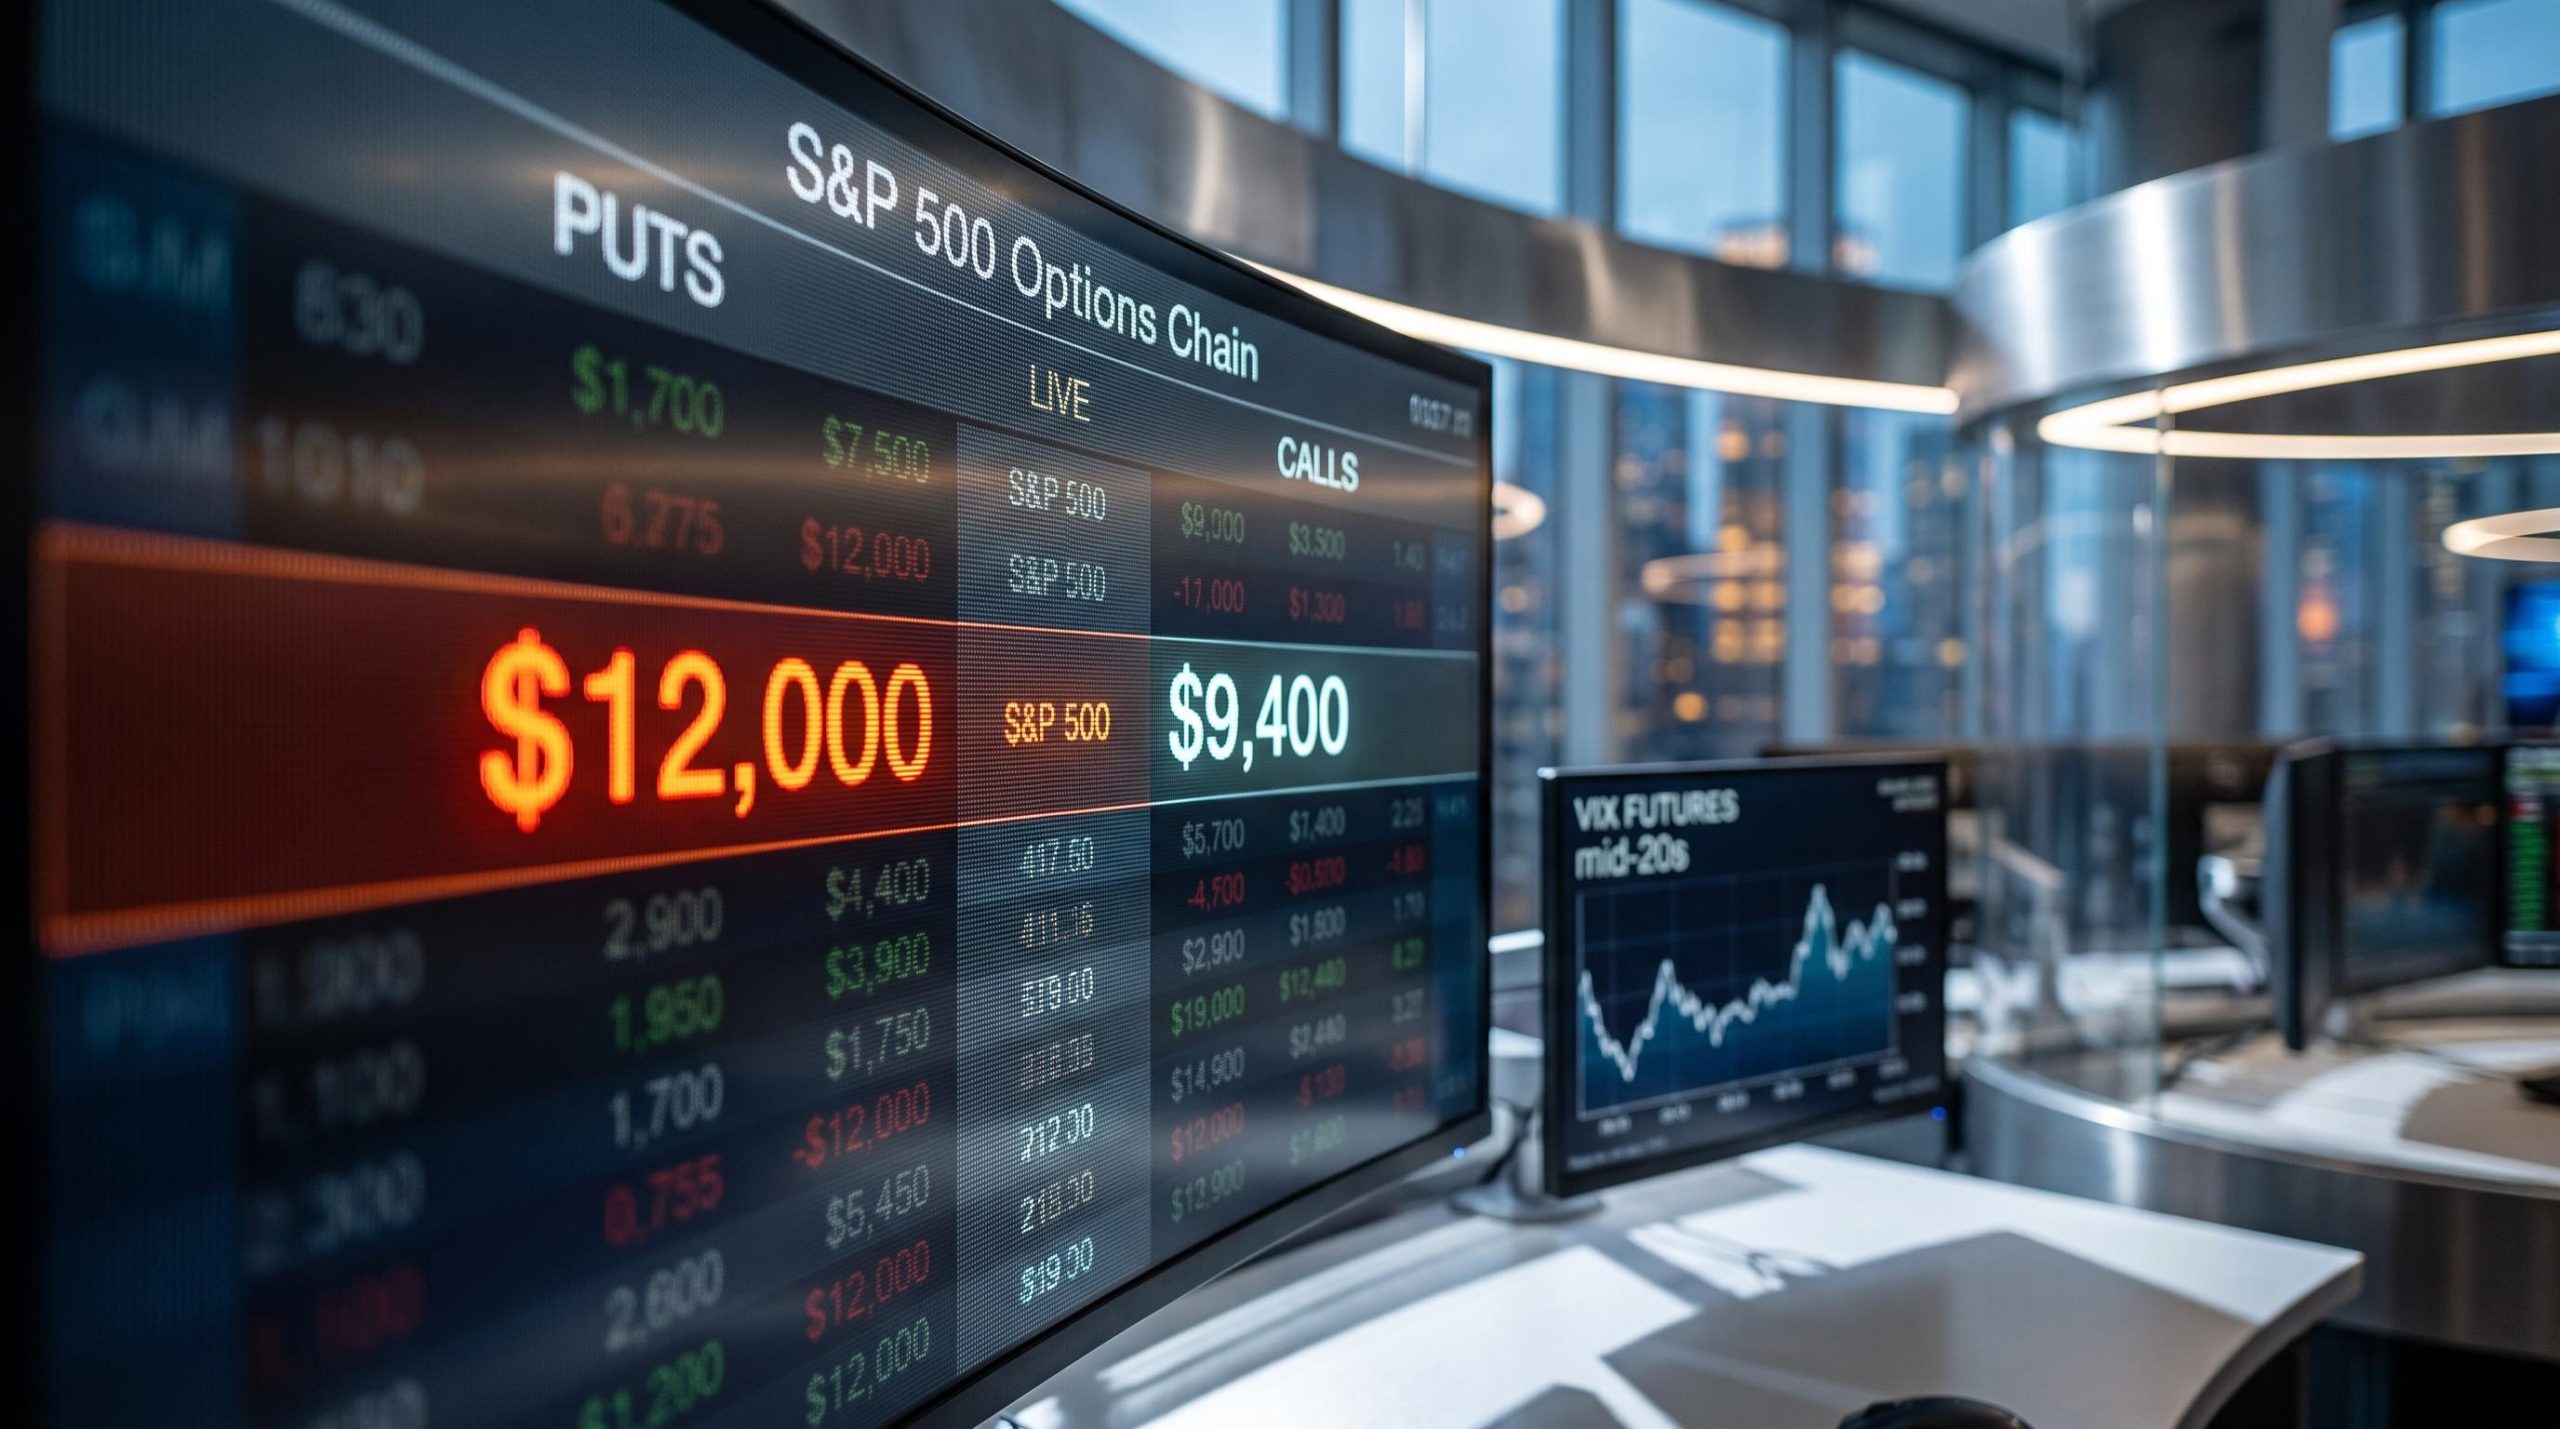
But underneath that headline reading, something does not quite fit. December SPX puts, approximately 460-470 points out of the money, are priced at roughly $12,000. An equivalently distant call costs about $9,400. That $2,600 gap is the options market telling you it is paying a meaningful premium for downside protection, even while the surface stays quiet.
Here is what that tension actually means for your positioning heading into the fall. This piece breaks down three specific instruments: put skew, VIX futures term structure, and market breadth data. Together they form a monitoring toolkit that tells you whether the market’s apparent calm is well-founded or borrowed, and what to do about it before the September-November volatility window arrives.
Why the surface calm in equities may be misleading right now
A casual observer scanning index levels would see a market that recently surged and has held its gains. When Meta, Microsoft, Apple, and Amazon reported earnings, the S&P 500 added roughly 300 points across four sessions, a move that appeared confident and broad-based.
What made it structurally fragile, though, is that the index vaulted through a price zone that had never been tested as support. Because no prior trading activity established buyers at those levels on the way up, any reversal back through that range would find little to slow it down, leaving roughly 300 points of open air before price reaches the June SPX low at approximately 7,235, the next meaningful support reference.
The gap zone problem: what happens when price has no support beneath it
When price jumps through a range without pausing to build a base, that zone offers no defence on the way back down. Buyers who would ordinarily step in at familiar price levels simply were not active there, so a retracement finds no natural floor until it reaches territory where genuine two-way trading previously occurred. That dynamic places the 300-point gap squarely between current levels and the June low at roughly 7,235, which stands as the next credible structural anchor.
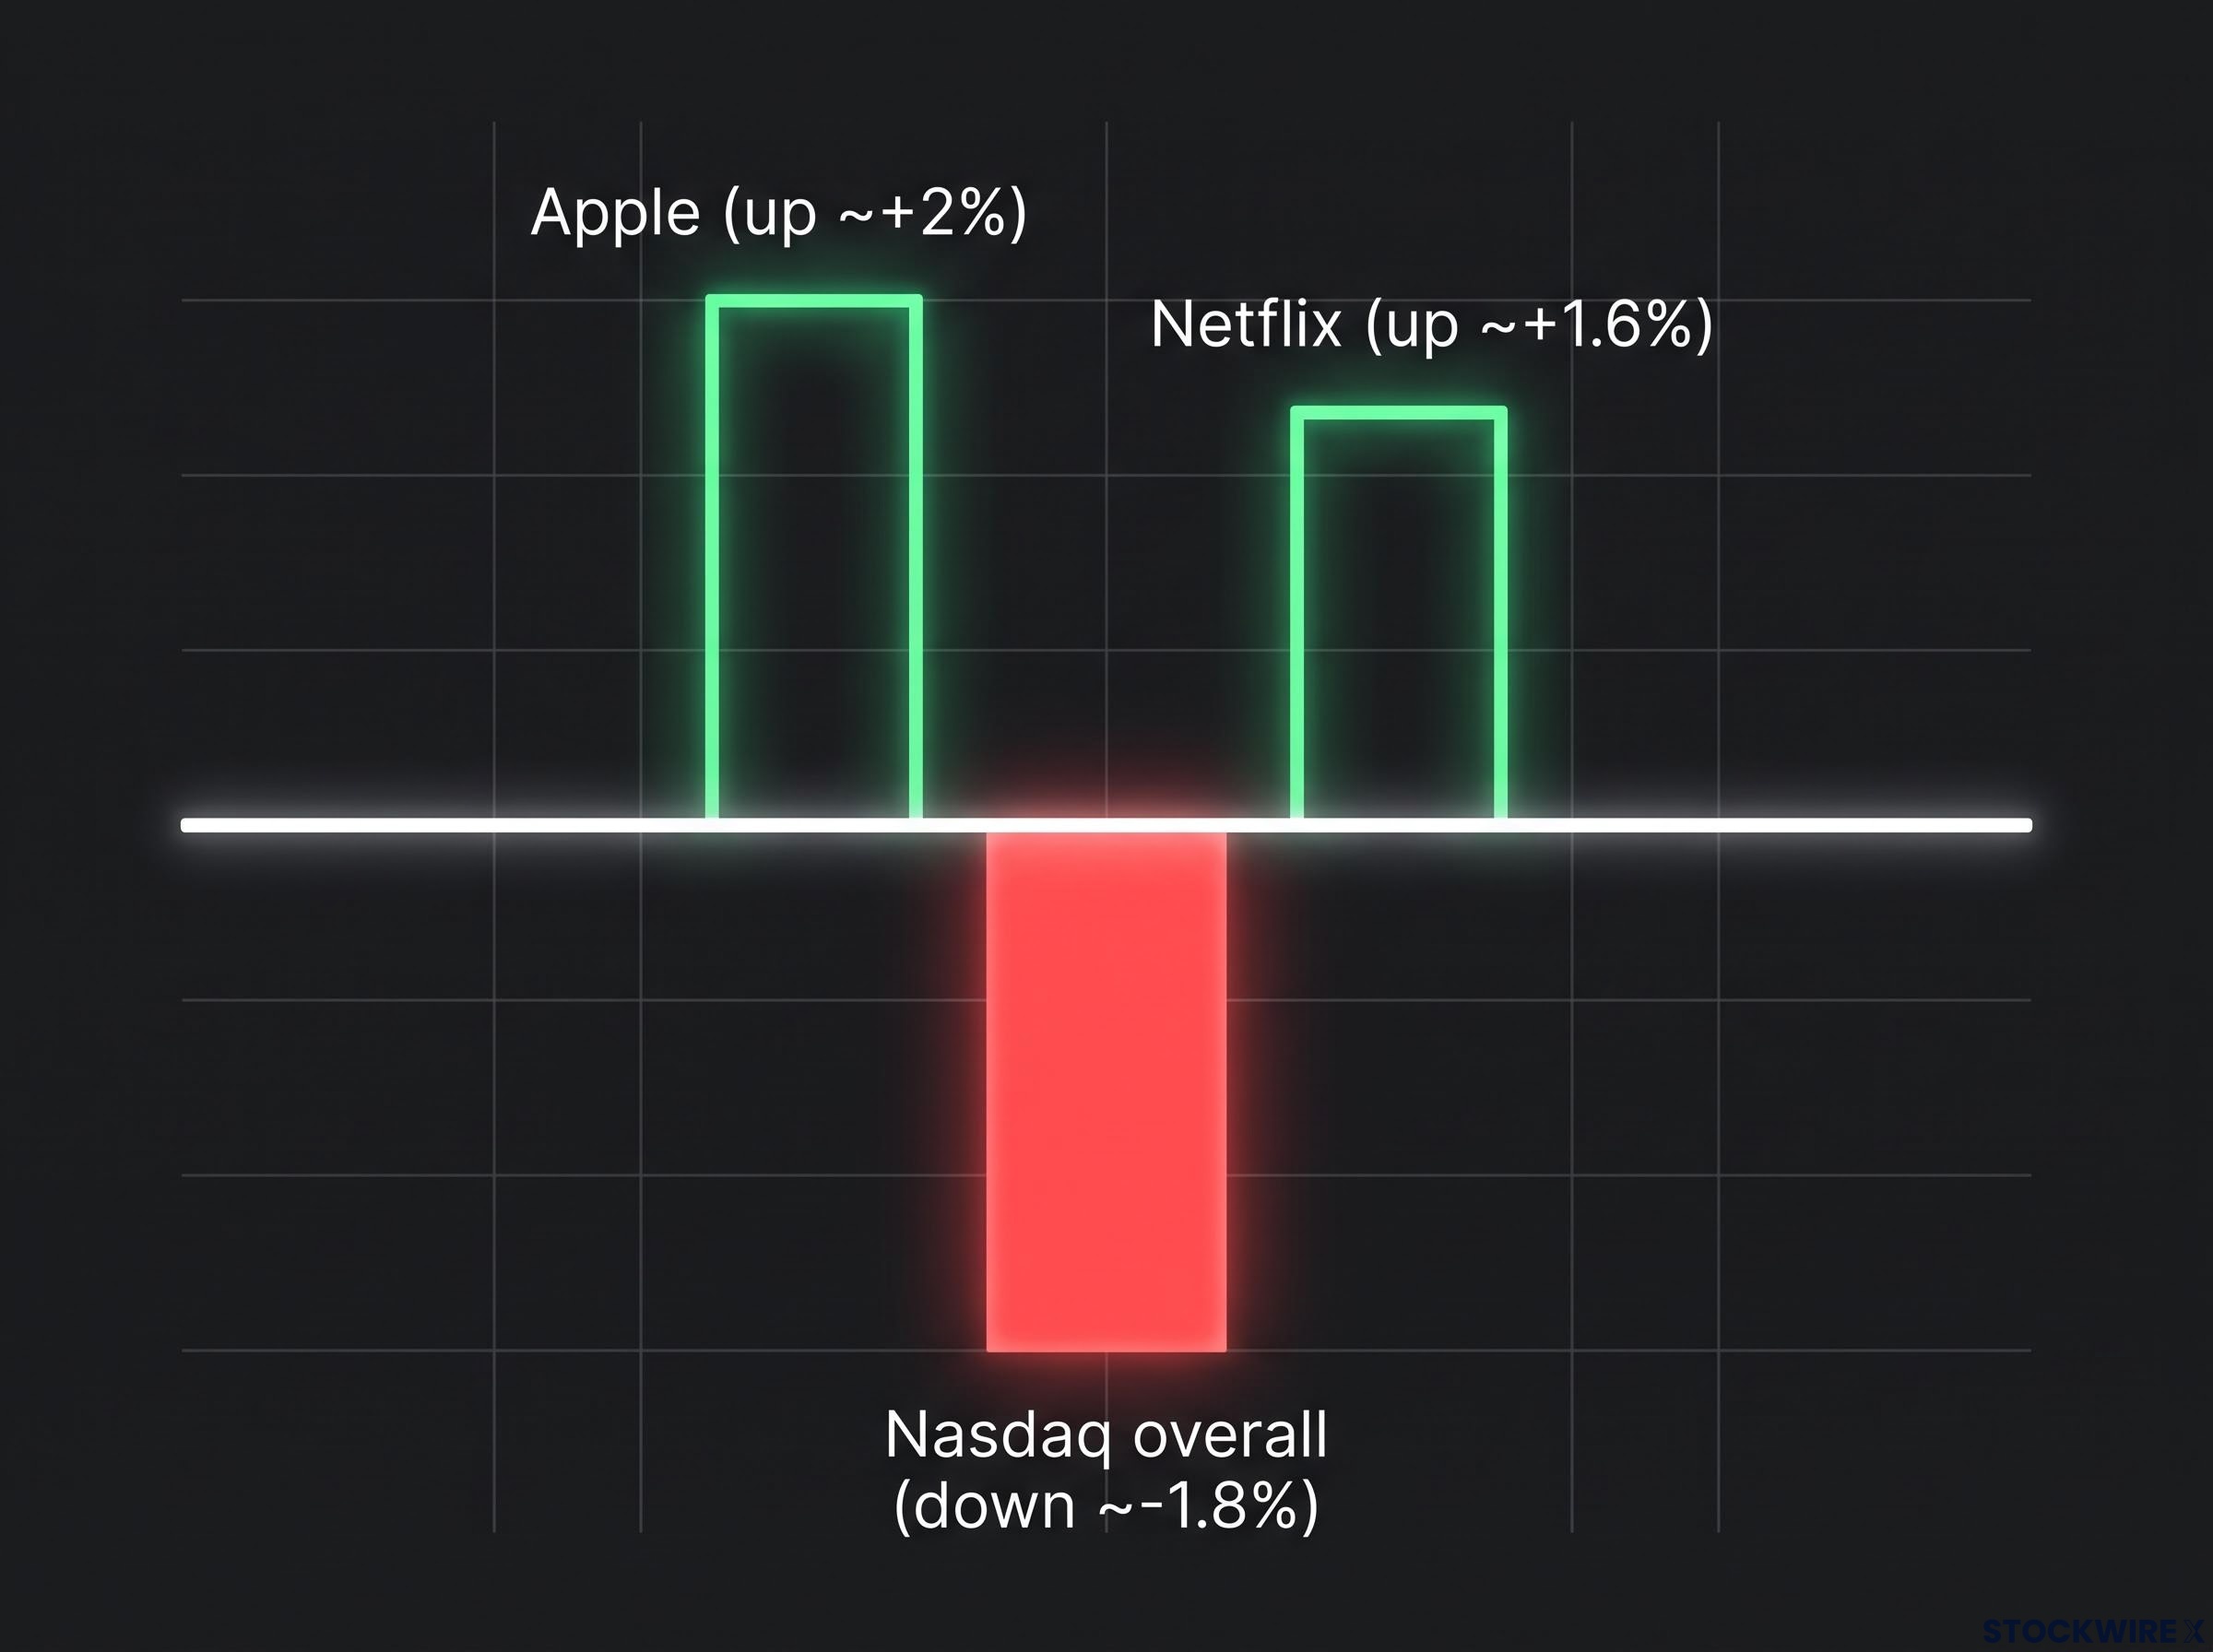
The breadth picture sharpens this concern. On the day of analysis, the headline numbers told two very different stories depending on where you looked:
- Apple: up approximately +2%
- Netflix: up approximately +1.6%
- Nasdaq overall: down approximately -1.8%
With chips and much of the broader market selling off, it was a handful of large-cap names absorbing all the index-level damage and then some. Strip those names out and the picture looked considerably weaker. Index-level readings were holding up not because participation was healthy, but because a small cluster of heavyweights was doing the lifting. When that cluster loses momentum or joins the selling, the gap zone below has very little underneath it to break the fall.
When big ASX news breaks, our subscribers know first
Why downside puts deliver outsized returns during the stress events they are designed for
Most investors think of options as directional bets. You buy a put if you think the market is going down. That framing misses the structural reason institutional risk managers use downside puts specifically: their payoff is not linear, it is convex, meaning the return accelerates as the scenario worsens rather than growing at a constant rate.
A long put position in a selloff benefits from two simultaneous effects, and understanding their sequence is what separates a directional bet from an asymmetric hedge:
- Intrinsic value increases as the index falls below the put’s strike price. This is the straightforward part: the further the market drops, the more the put is worth.
- Implied volatility expands on downside strikes as fear spikes, adding a “vega plus skew” kicker. During stress, the market does not just fall; it reprices the cost of protection itself, and that repricing amplifies the value of puts you already hold.
This second effect is where the convexity lives, and it is why puts are structurally different from simply shorting the index.
Why convexity matters more than direction alone
Convexity means the payoff curve bends in your favour. A short futures position gains one dollar for every dollar the index falls; a put gains that dollar plus the additional premium from volatility expansion on its strike. The worse the scenario gets, the wider that gap becomes.
This is precisely the property that makes downside puts the preferred hedging instrument for professional risk managers. The insurance becomes more valuable at the exact moment you need it most. Existing downside hedges are expected to increase further in value if a selloff develops, meaning skew is not just a signal to read; it is an amplifying mechanism for those already positioned. For a finance-literate investor weighing portfolio protection options, that convex payoff profile changes the cost-benefit calculus materially compared to linear hedging approaches.
What put skew is and why its current level is a signal worth reading
Put skew refers to the persistent condition in equity index options where out-of-the-money (OTM) puts trade at higher implied volatility than equivalently out-of-the-money calls. Implied volatility is the market’s estimate of how much a stock or index will move, expressed as a percentage and embedded in the price of the option. Higher implied volatility means a more expensive option.
Implied volatility is the market’s estimate of how much a stock or index will move, expressed as a percentage and embedded in the price of the option; implied volatility is extracted by reverse-engineering option pricing models from live market prices, making it a real-time measure of collective expectation rather than a backward-looking statistic.
Skew exists for two structural reasons. First, there is persistent institutional demand for crash protection: pension funds, endowments, and risk-managed portfolios systematically buy downside puts. Second, equity indices empirically fall faster than they rise, which means downside options carry more risk for sellers, who demand higher premiums to compensate.
Skew is always present in SPX options. What varies is its magnitude. When the gap between downside put pricing and upside call pricing widens beyond historical norms, it signals that professional capital is paying up for protection more aggressively than usual.
The current reading from the December options cycle makes this concrete:
| Option | Distance from current level | Price | Implied skew premium |
|---|---|---|---|
| December SPX put | ~460-470 points OTM | ~$12,000 | Higher IV on downside strike |
| December SPX call | ~460-470 points OTM | ~$9,400 | Lower IV despite rate-driven call premium |
The $2,600 gap is notable on its own, but what sharpens the picture further is how the current rate environment fits in. Higher interest rates mechanically lift call prices relative to puts, which means calls already carry a structural advantage on the upside of the chain. Even with that rate-driven tailwind pushing call premiums higher, downside puts are still commanding a considerably larger price tag at the same distance from spot.
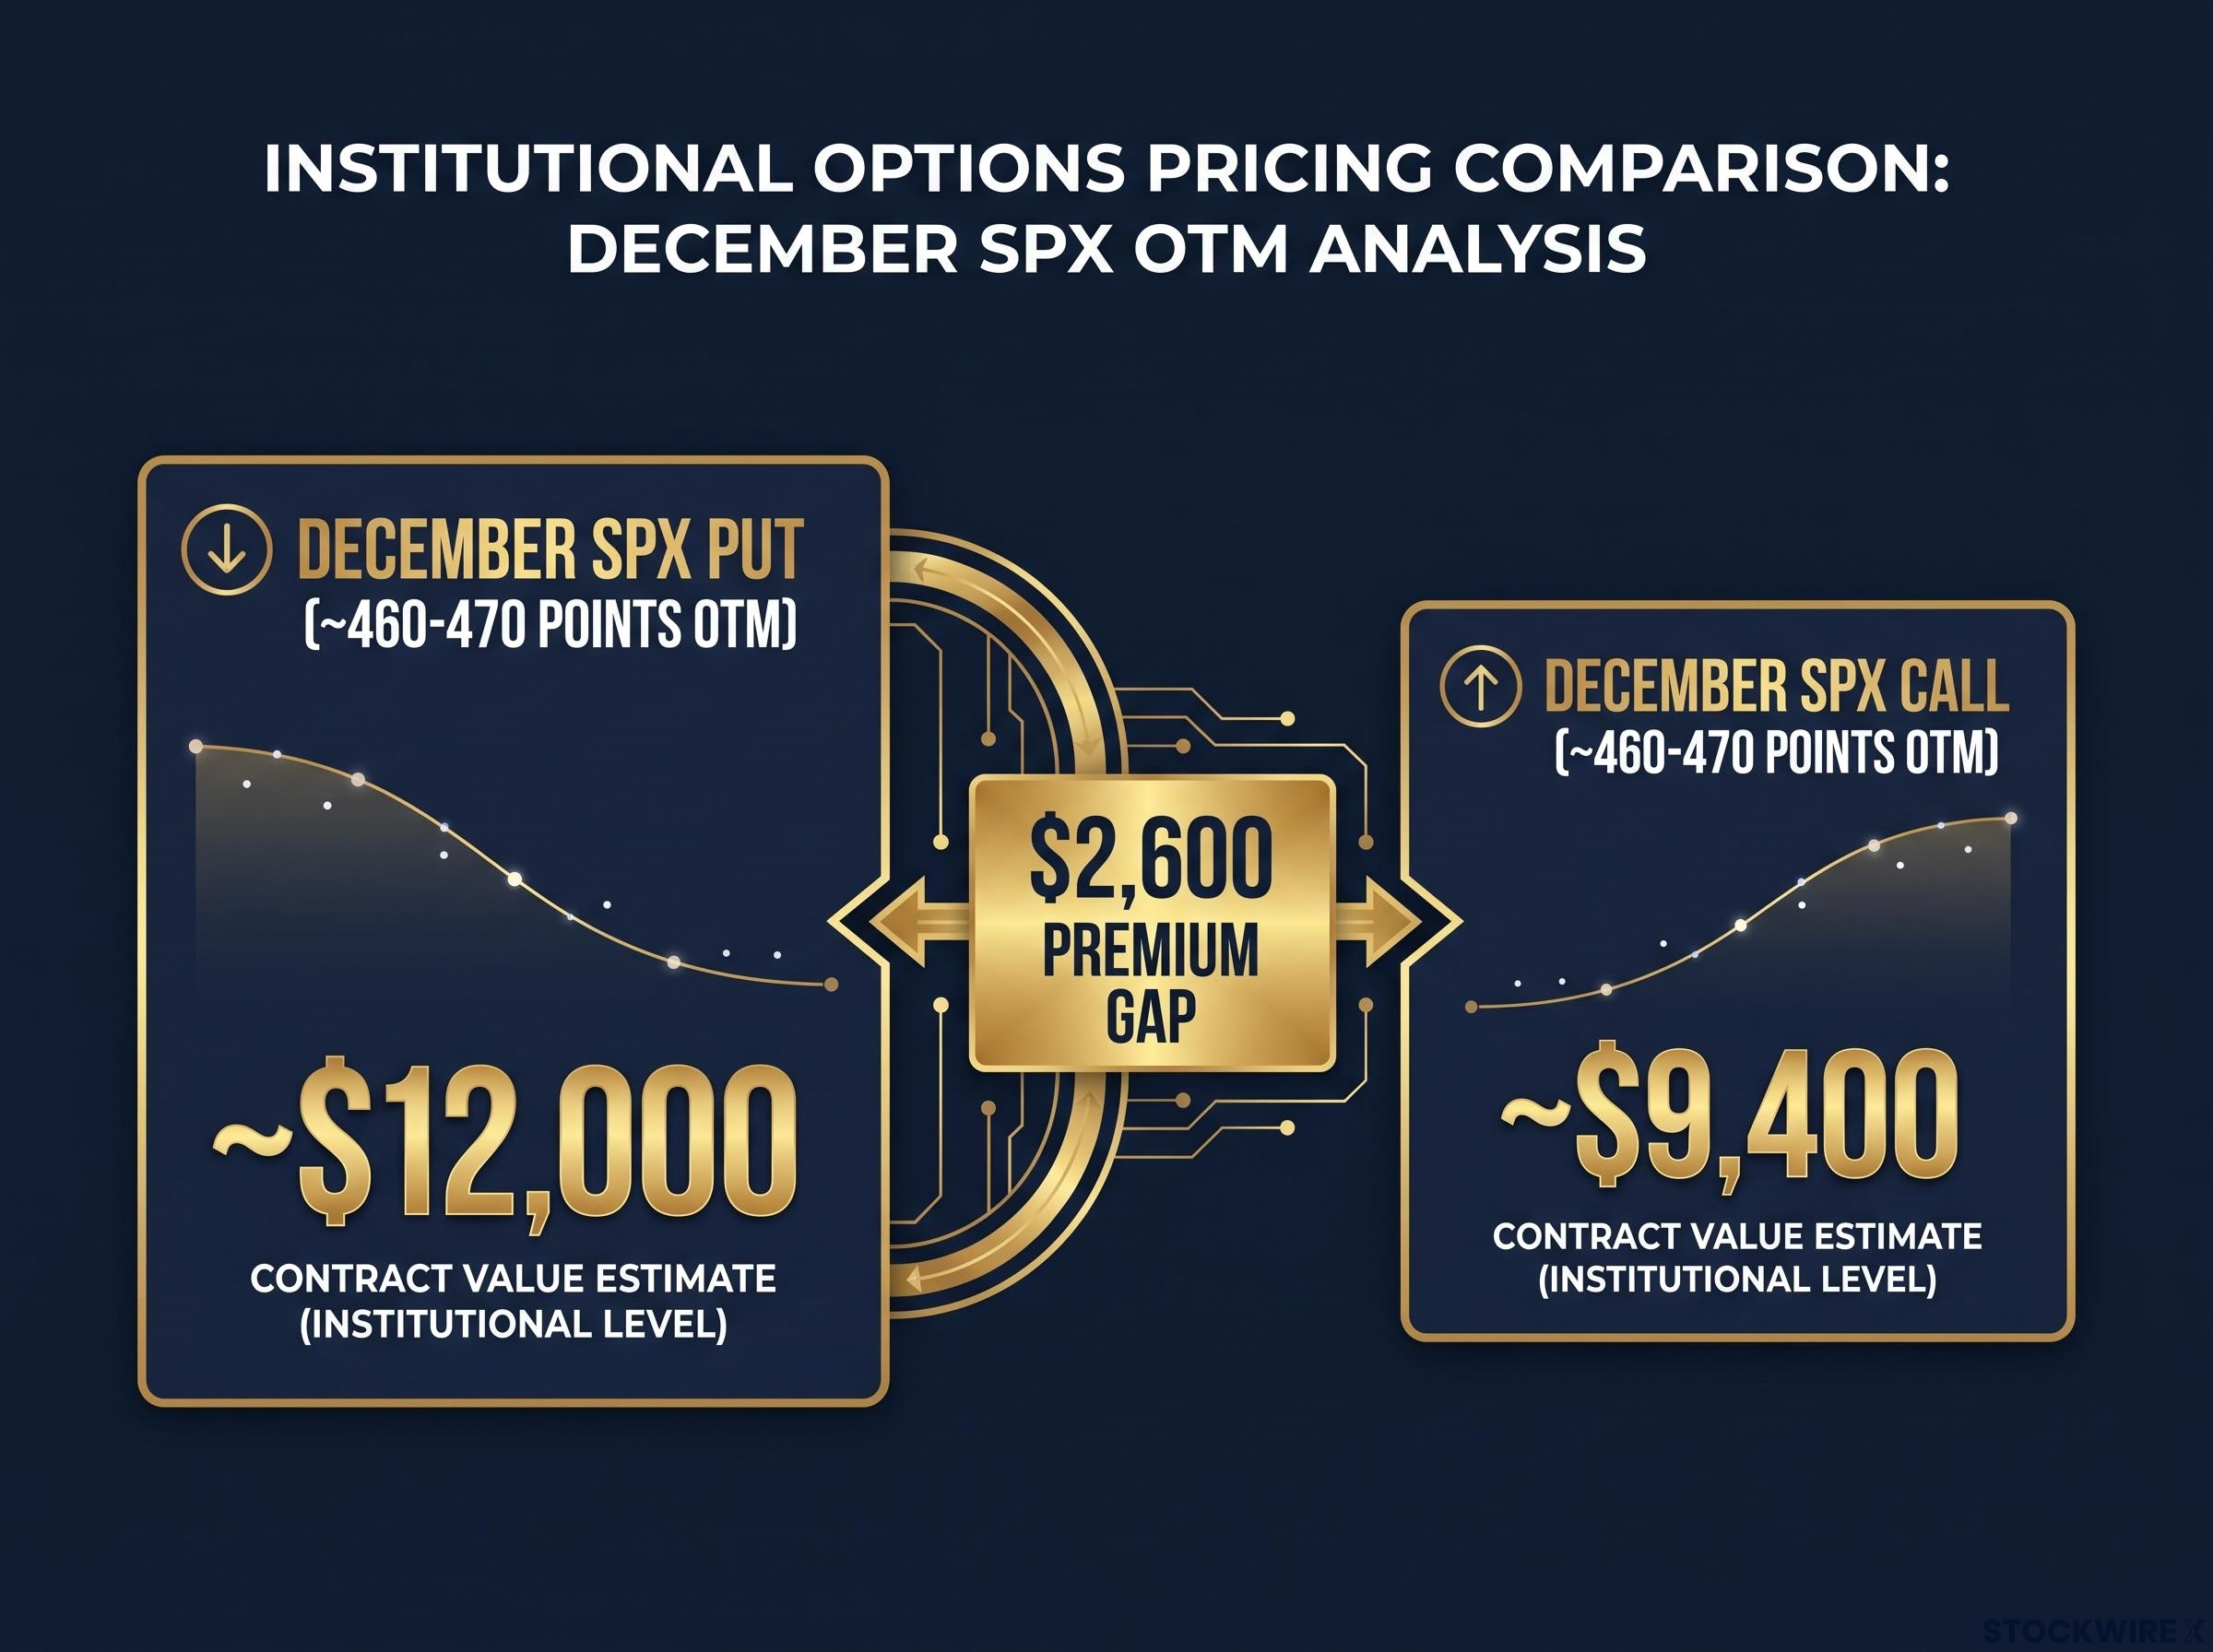
OTM puts are more expensive than equivalent OTM calls, even after adjusting for the rate premium that structurally benefits calls. The raw skew is more pronounced than the nominal dollar difference alone suggests.
What this $2,600 differential is telling you is where institutional risk perception sits right now. Professional hedgers are not passively buying protection; they are paying a non-trivial premium for it. That is a concrete, checkable signal you can monitor independently rather than relying on commentary or headlines.
How the VIX futures curve maps the market’s forward volatility expectations
Spot VIX, the number most investors check, measures 30-day implied volatility on SPX options as of right now. It is a real-time snapshot: what the options market expects the index to do over the next month. VIX futures are a different instrument. They encode the market’s expectation of where VIX will be at specific future expiry dates, giving you a forward-looking view of volatility rather than a present-tense one.
The Cboe VIX methodology specifies that spot VIX is derived from a weighted strip of SPX options spanning the full range of strikes, which is why the index responds so directly to changes in put skew and the relative pricing of downside versus upside contracts.
The distinction matters because the two can tell very different stories at the same time.
| Instrument | What it measures | Current signal |
|---|---|---|
| Spot VIX | 30-day implied volatility (real-time snapshot) | Relatively calm; near-term fear is muted |
| VIX futures (fall-dated) | Expected volatility at specific future expiry dates | Priced in the mid-20s through year-end |
Near-term VIX sits well below where fall-dated futures contracts are trading, with contracts through year-end clustered in the mid-20s. The result is a steeply upward-sloping term structure: the front of the curve signals limited immediate fear, while the back end signals that markets anticipate a meaningfully more turbulent environment by autumn.
The implied versus realised volatility gap reached a notable extreme in 2026, with implied volatility running above 23% while realised volatility stayed below 14%, a disparity that confirms the market’s surface calm is not a reflection of actual daily price movement but of a structural mismatch between what options markets are pricing and what equities are actually delivering.
Spot VIX is calm, but fall-dated futures in the mid-20s signal that the market has already priced an elevated-volatility regime for the September-November window.
The conditions most likely to drive spot VIX up to meet those forward levels involve persistent downside pressure in equities with no meaningful bounces, a situation where realised volatility accelerates and closes the gap that currently exists between front-month calm and back-month caution. The midterm election cycle sits squarely inside this window, adding a concrete macro calendar event to a period that futures markets are already pricing as elevated.
What this means for you is straightforward: if you are not thinking about your fall risk exposure now, you are behind the pricing that professional volatility traders have already established. VIX futures in the mid-20s are the forward marker to watch in coming weeks as confirmation or disconfirmation of the thesis.
How fall seasonality fits into this picture without becoming a crutch
Historical seasonal patterns for U.S. equities show a consistent tendency toward weakness and elevated volatility during the fall months:
- September is historically the weakest month for U.S. equities on average
- October has been associated with several major historical drawdown events
- The September-November window broadly tends to see higher VIX readings and softer S&P 500 performance
These are averages, not predictions. Seasonality does not tell you that the market will sell off in any given year. What it does tell you is when the conditions for a selloff have historically been most favourable.
Seasonal equity patterns for U.S. markets show September is historically the weakest calendar month on average, but the full century of S&P 500 data also reveals that the May-October window has never averaged a negative return, a nuance that reframes seasonality as a risk-weighting input rather than a directional trigger.
Today’s subdued volatility backdrop, characterised by tight intraday ranges and below-average realised moves, is actually a familiar precursor to the kind of sharp volatility expansions that autumn periods can produce. Historically, it is precisely from these quiet, compressed environments that sudden spikes tend to launch, since low realised volatility suppresses hedging activity and leaves positioning poorly prepared for an acceleration. The midterm election cycle adds a known macro date sitting directly inside the fall window that futures pricing has already flagged.
Using seasonality as a planning signal, not a market call
The distinction matters. A market timing call says “sell in September.” A risk management planning signal says “have your protection, liquidity buffers, and drawdown plan in place before September arrives.” Seasonality supports the second application, not the first.
What makes the current setup more notable than seasonality alone is the convergence: put skew, VIX futures, and seasonal patterns are all pointing toward the same fall window. No single signal is a guarantee. Three independent signals corroborating the same view is a condition worth responding to.
Three signals, one coherent picture: what to take away before fall arrives
The three analytical threads covered in this piece, each drawing on different data, converge on a consistent message:
| Signal | What it says | Practical implication |
|---|---|---|
| Elevated put skew (~$12,000 vs ~$9,400 December options) | Professional hedgers are paying a significant premium for downside protection | Institutional risk perception is elevated; monitor skew magnitude |
| VIX futures in the mid-20s for fall | The market expects a higher-volatility regime for September-November | Forward volatility pricing is already elevated; preparation should precede it |
| Narrow mega-cap breadth (two stocks up, Nasdaq down ~1.8%) | Index stability is concentrated in a handful of names | Headline index levels may overstate portfolio resilience |
Individually, each signal warrants attention. Collectively, they describe a market that is quietly hedging fall downside risk at an elevated rate, not panicking, but preparing. The options market is cautious: it is assigning meaningful probability to a fall drawdown and volatility spike, but it is not pricing a certain crash. Your response should match that calibration.
Beta-weighted position sizing converts each holding into market-risk equivalent dollars, making hidden concentration risks visible before a drawdown occurs rather than after; a 50/50 dollar split between a high-beta technology position and a low-beta defensive can embed a 90/10 risk split that looks balanced on a brokerage statement but behaves nothing like one during a selloff.
The practical risk management framework that follows from this reading involves three considerations:
- Drawdown tolerance: can your current positions survive a 10-15% equity decline without forcing sales at the worst time? The absence of that stress test in a compressed-volatility environment is precisely when it tends to matter most.
- Concentration risk: if your portfolio is heavy in the mega-cap names driving index stability, you may carry more hidden directional risk than allocation percentages imply. The Nasdaq breadth divergence (two stocks masking a 1.8% broad decline) illustrates exactly how that risk can be invisible until it is not.
- Liquidity planning: having cash or liquid alternatives available during the fall window gives you optionality, both to absorb volatility and to act on opportunities that drawdowns create.
The convergence of three independent signals on the same fall risk window tells you this is a moment to audit your risk management posture while volatility is still relatively cheap and optionality is available, rather than after the conditions the options market is pricing have already arrived.
What a cautious-but-not-panicked options market means for your fall positioning
The options market is not pricing a certain crash. It is pricing an elevated probability that the September-November window will be bumpier than the current surface calm suggests. Aligning with that view does not mean selling everything; it means having a plan in place now, not after the fact.
The three instruments covered here, put skew, VIX term structure, and breadth data, are not one-time reads. They are a monitoring toolkit you can return to over the coming weeks. Watch the VIX futures mid-20s pricing as a confirmation or disconfirmation marker. Track the June SPX low at approximately 7,235 as the specific downside reference if the post-earnings gap zone gives way.
The cost of being prepared for a higher-volatility fall and being wrong is modest. The cost of being unprepared and being right is significant.
That asymmetry is the framing that should guide your response. The signals are not alarming. They are informative. And the window they point to is weeks away, not months.
This article is for informational purposes only and should not be considered financial advice. Investors should conduct their own research and consult with financial professionals before making investment decisions. Past performance does not guarantee future results. Financial projections are subject to market conditions and various risk factors.