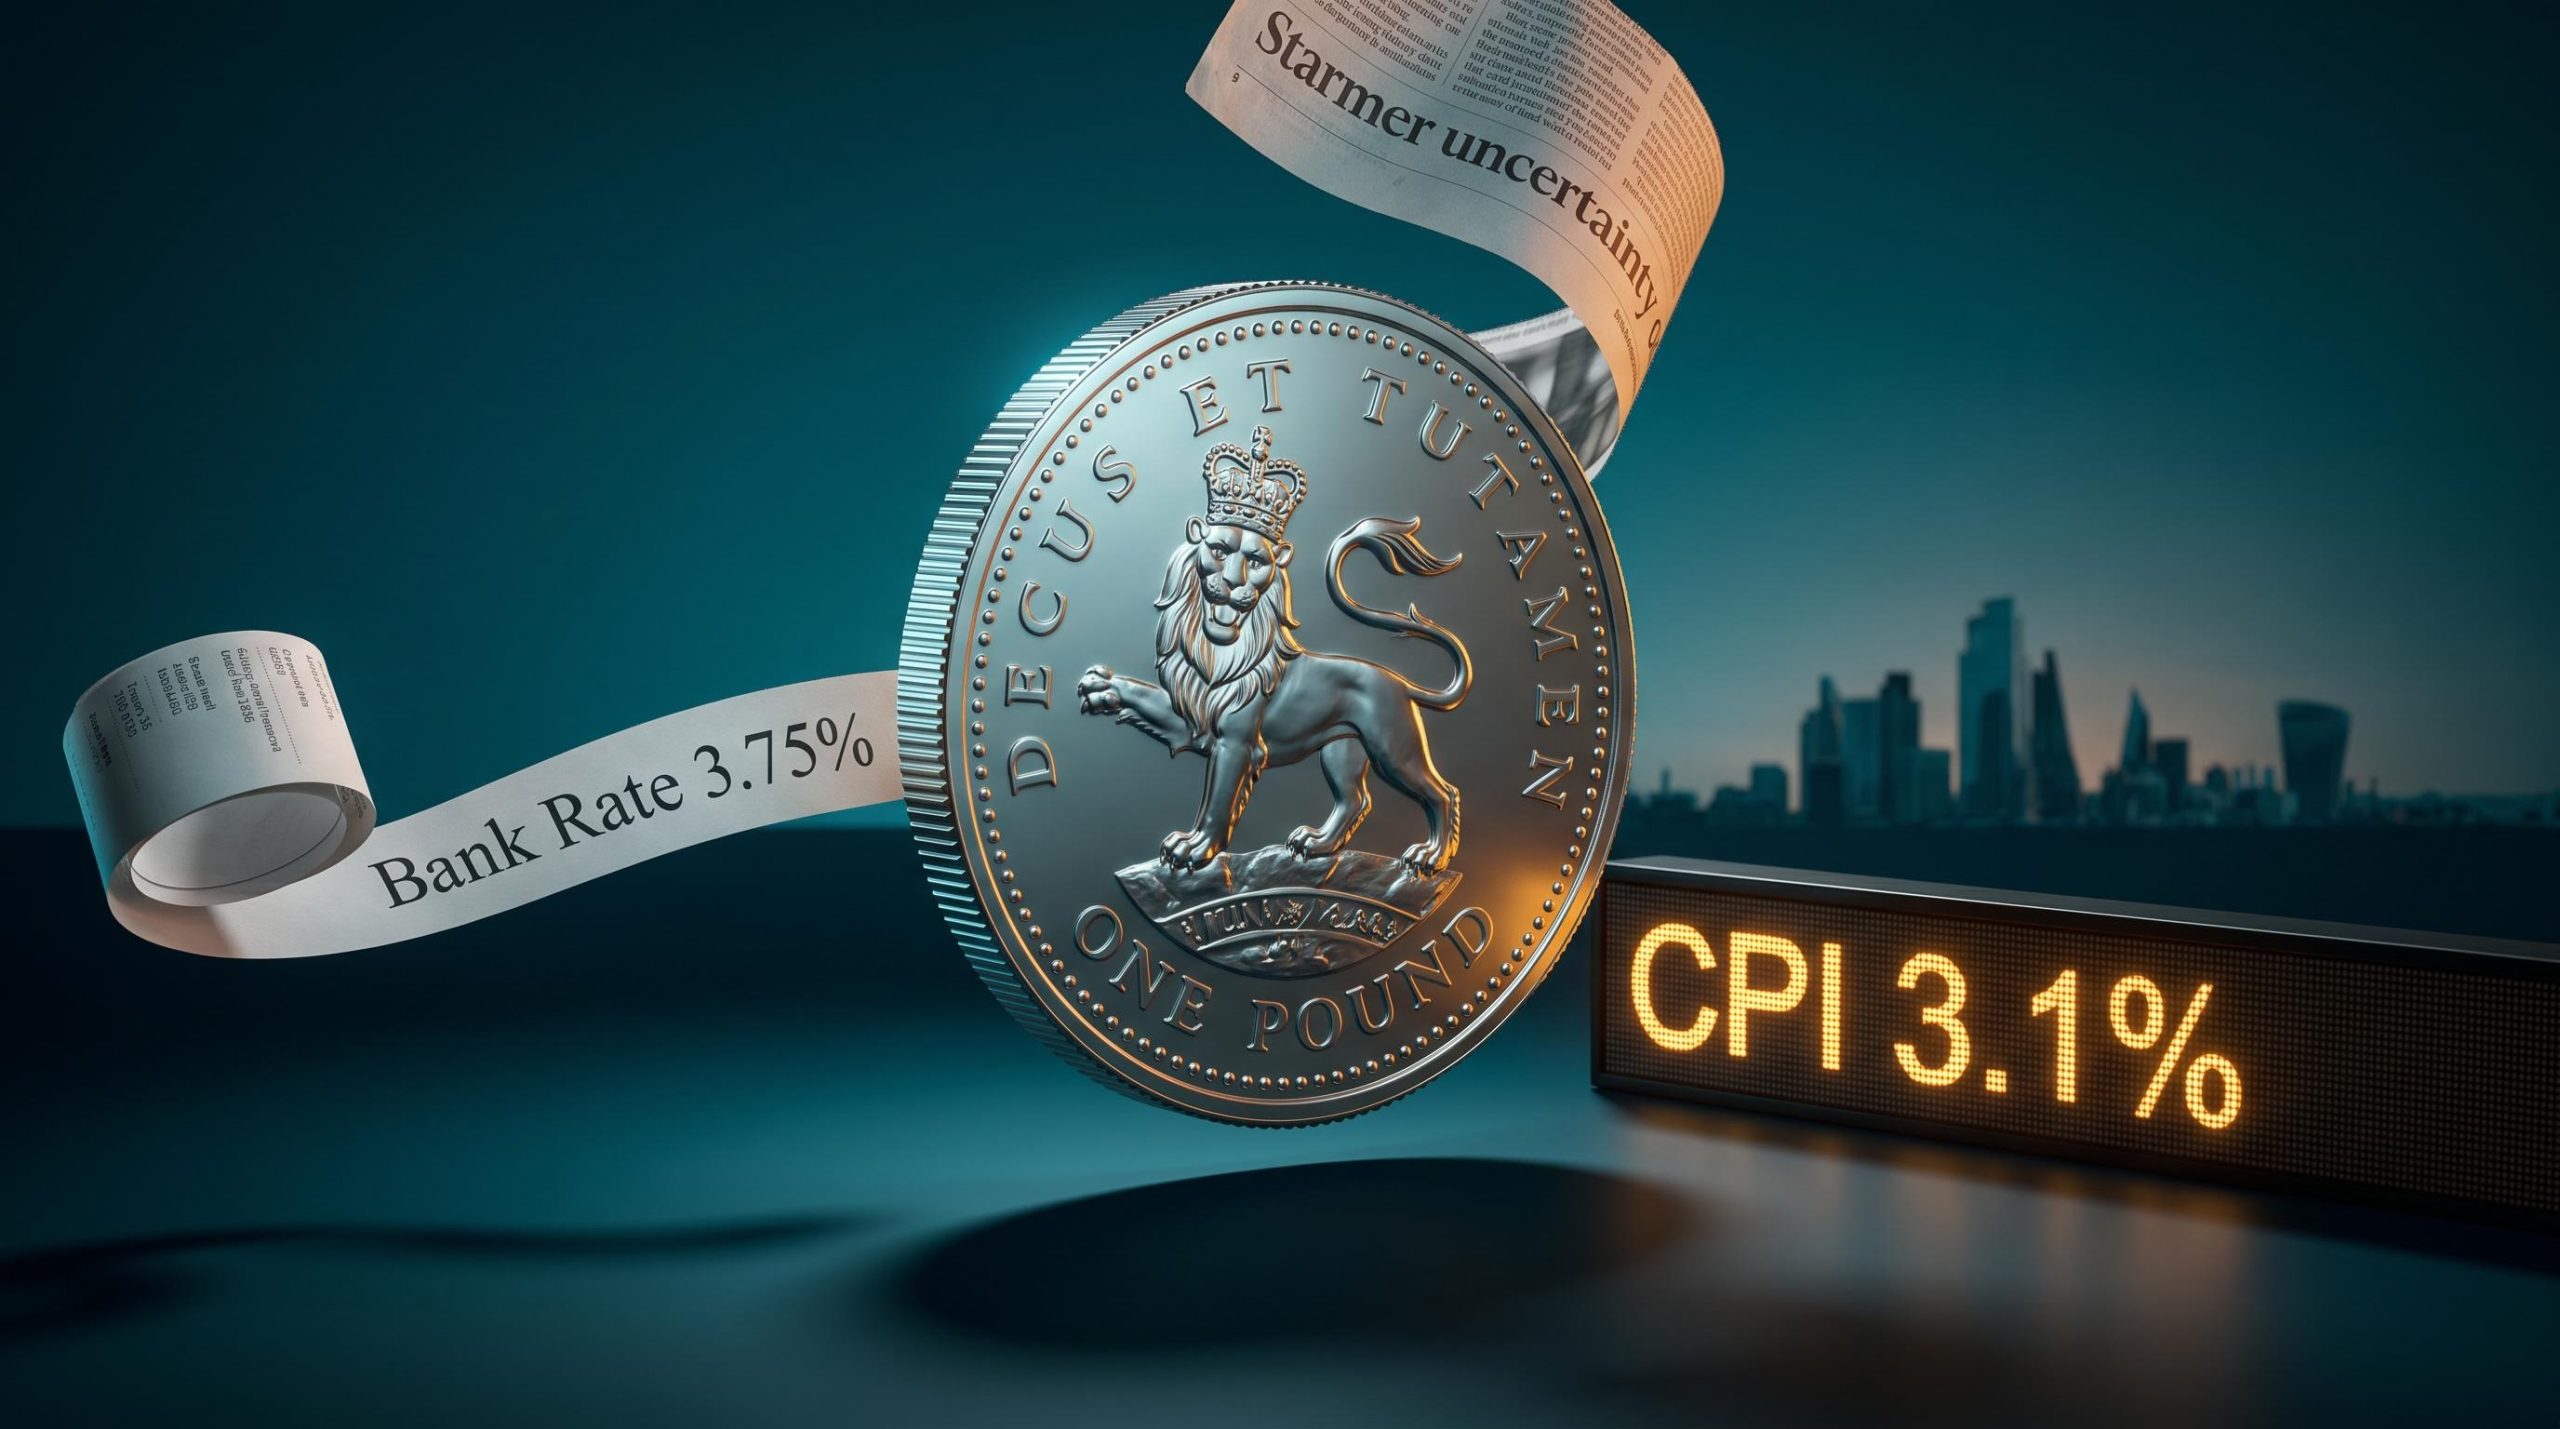
The pound is often thought of as a sturdy relic, the world’s oldest currency, quietly holding its value while flashier assets swing around it. That picture is wrong.
Sterling sits at the centre of a market that turns over roughly $630 billion every single day, and its price moves on a live feed of inflation prints, central bank votes, and political rumour. It is anything but static.
Right now, in September 2026, the pound is being pulled in several directions at once. Inflation is running hotter than the Bank of England would like, retail sales are wobbling, and global central banks are drifting apart on policy. Each of these creates daily friction in sterling’s price.
So what moves the British Pound, and how do you read those forces before they show up in the headlines? This breakdown gives you a reusable framework for decoding the core inputs behind sterling, so you can anticipate currency moves rather than scramble to explain them after the fact.
The fundamental architecture of sterling
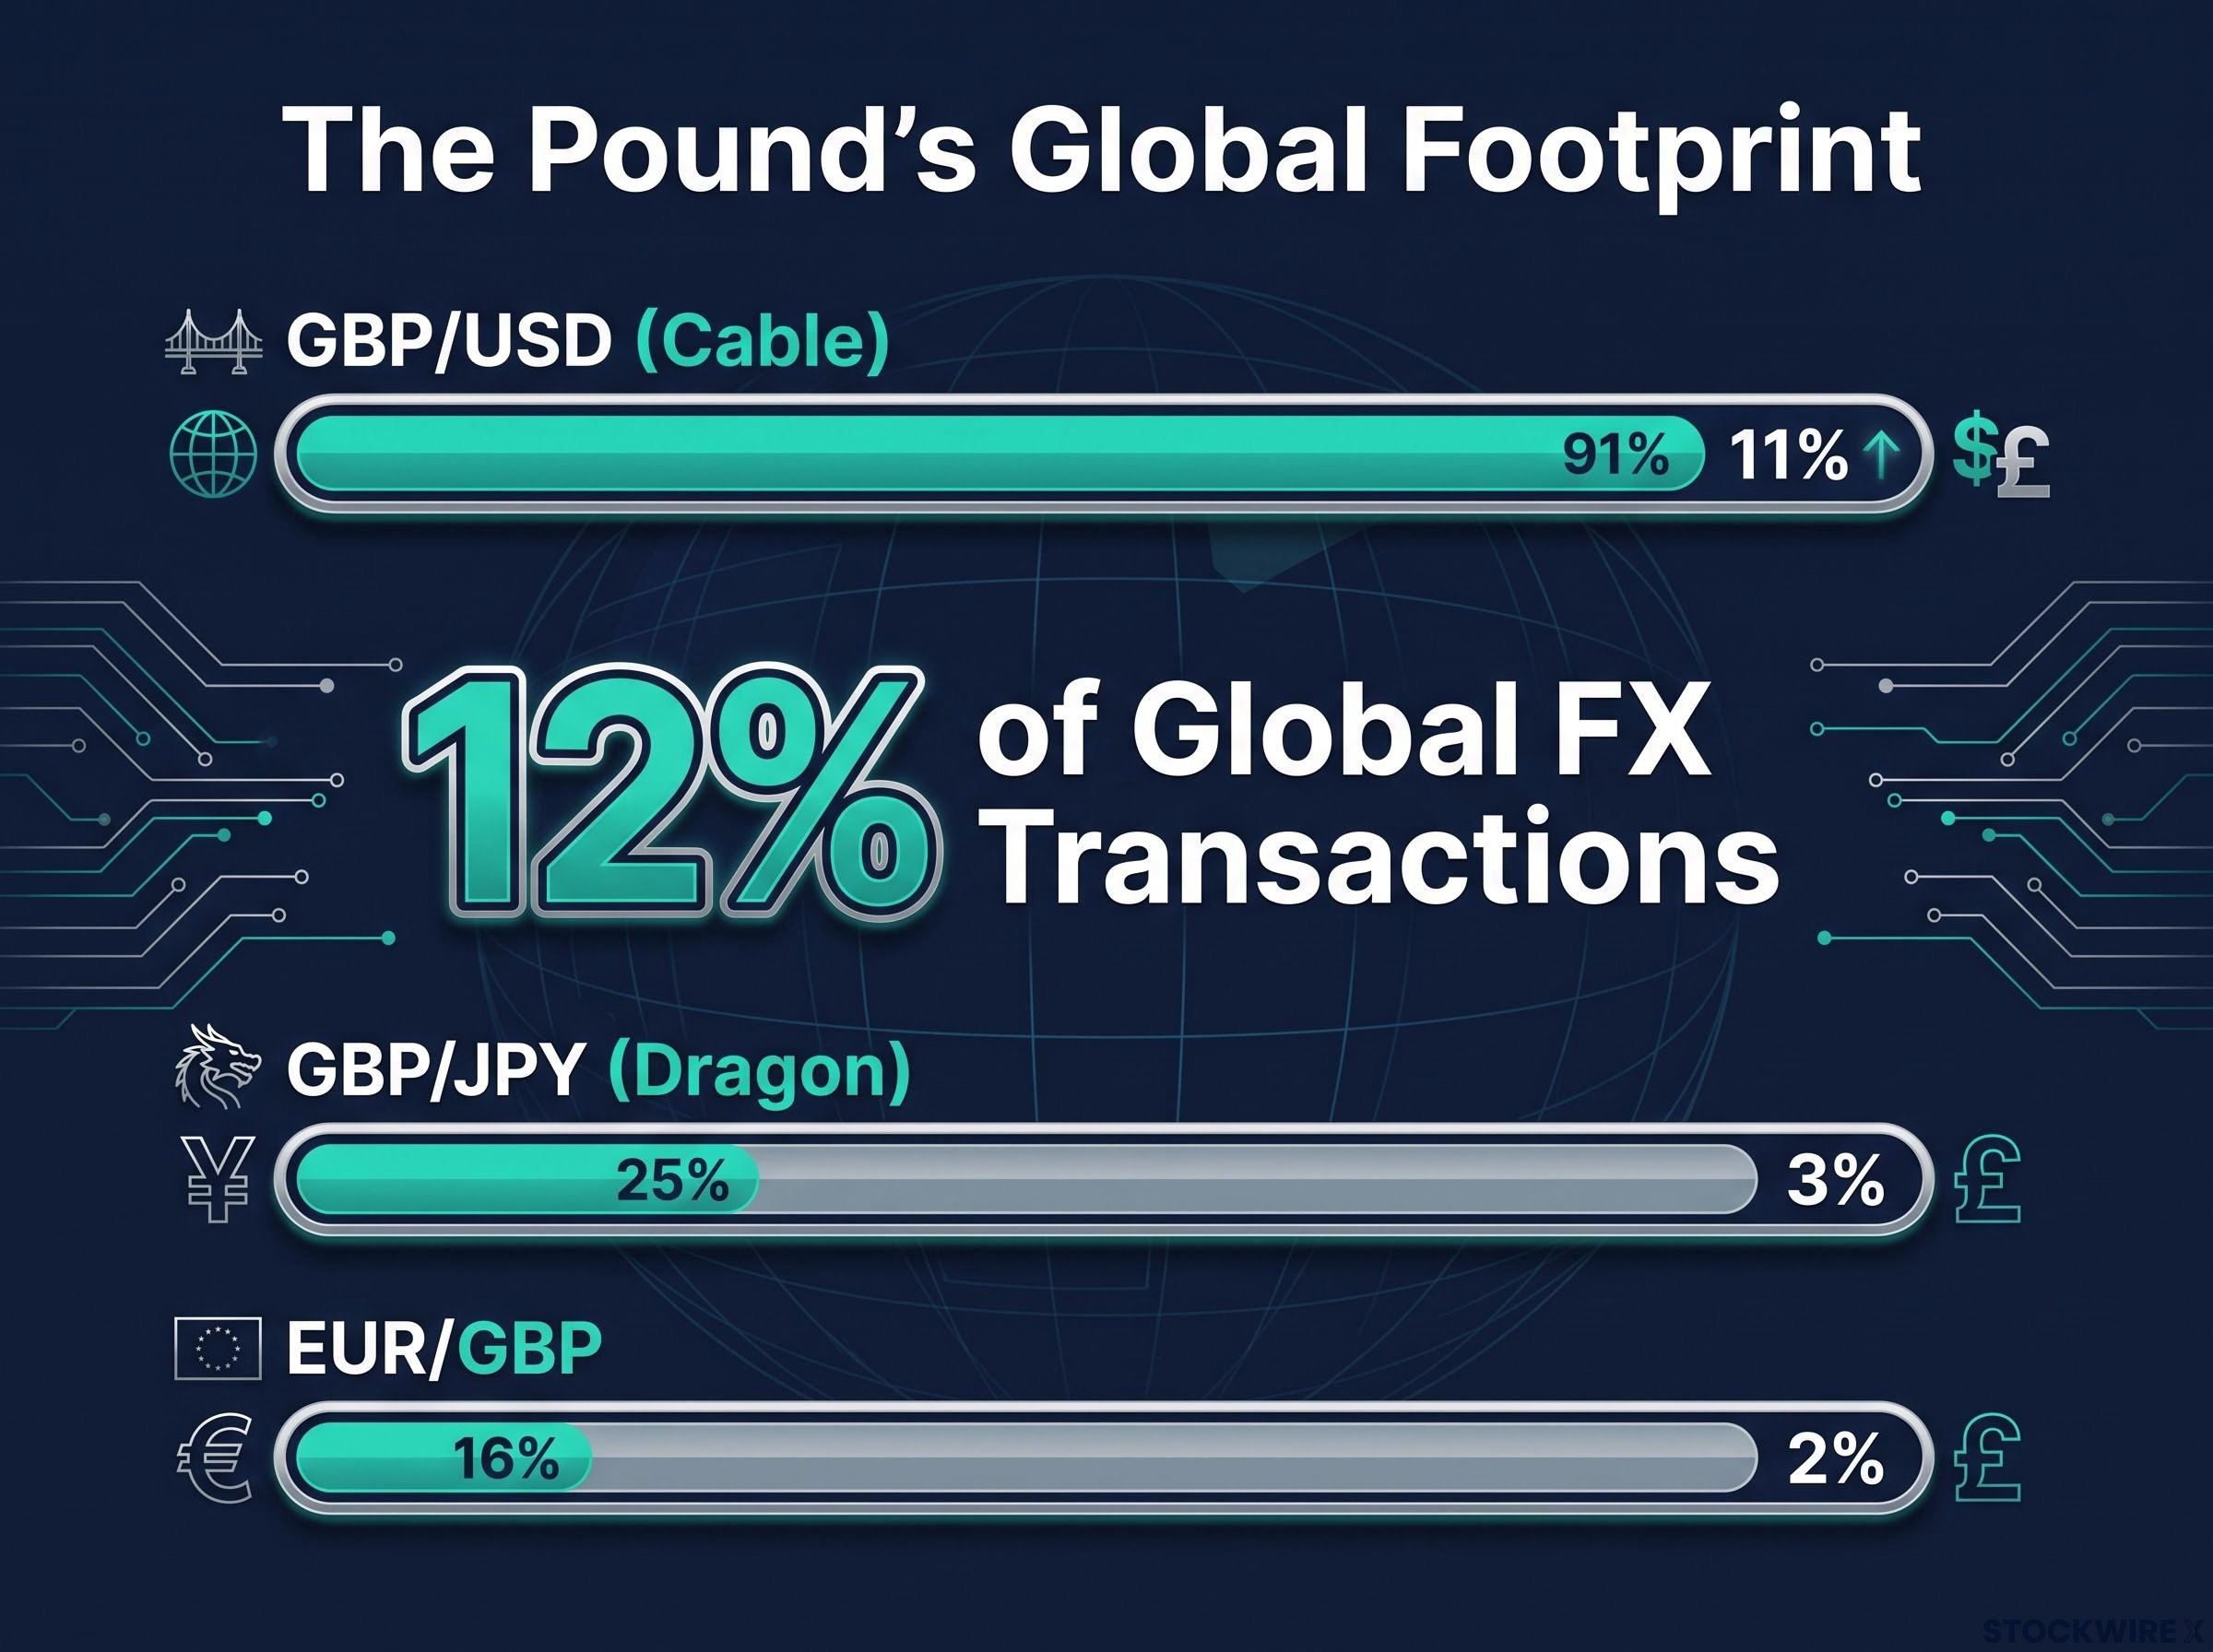
Before you can read sterling’s daily swings, you need to understand why it matters at all. The pound is the fourth most actively traded currency on the planet, accounting for 12% of all foreign exchange transactions globally. That is a heavyweight position for an economy of the UK’s size, and it means sterling is always in the mix when global capital moves.
Most of that activity concentrates in a handful of currency pairs. Here is how the major sterling crosses break down by share of total FX market activity:
- GBP/USD (nicknamed “Cable”): 11% of FX market activity
- GBP/JPY (nicknamed “Dragon”): 3% of FX market activity
- EUR/GBP: 2% of FX market activity
That the pound trades most heavily against the US dollar is the single most important thing to internalise. When you see sterling quoted, you are usually seeing it measured against the dollar, which means US economic conditions act as a permanent counterweight to UK fundamentals. A strong pound day can simply be a weak dollar day, and vice versa.
Underneath the trading volume sits the real economy. The value of any currency comes down to demand for it, and two forces shape that baseline demand.
The first is the trade balance. When the UK exports more than it imports, foreign buyers must acquire pounds to pay for British goods and services, generating supportive inflows.
The second, and often larger, force is demand for UK assets. When overseas investors want to hold British government bonds or equities, they buy pounds to do it. When they lose their appetite, they sell.
This is the plumbing that makes sterling so twitchy. Because foreign investors are constantly reassessing whether UK assets are worth holding, the pound reacts aggressively to any domestic surprise that changes that calculation. Grasping this baseline is what lets you separate a genuine structural shift in the currency from short-lived market noise.
When big ASX news breaks, our subscribers know first
Bank of England policy and the inflation premium
If trade and capital flows set the floor, interest rates set the tempo. The single biggest engine behind sterling’s value is what the Bank of England (BoE) does with its official interest rate, because higher rates reward anyone holding pounds with a better return on their cash.
The three BoE policy tools that directly shape sterling’s value, base rate adjustments, quantitative easing, and quantitative tightening, each transmit to the currency through different mechanisms, and the balance sheet dynamics are often underweighted by traders focused solely on the headline rate.
The current official Bank Rate sits at 3.75%, the lowest level since February 2023 and held there for a sixth consecutive meeting. On its face, that looks like a central bank leaning towards easier policy. The detail tells a more contested story.
At the meeting ending 29 July 2026, the Monetary Policy Committee (MPC) voted 6-3 to hold, with three members actively pushing for a rise to 4%. That is a committee visibly split, not a settled dovish consensus.
The reason for the split is inflation that refuses to fall into line. According to the Office for National Statistics bulletin released on 16 September 2026, headline Consumer Prices Index (CPI) inflation rose 3.1% in the year to August 2026, up from 2.9% in July. The broader CPIH measure, which includes owner occupiers’ housing costs, came in at 3.3%.
Both figures sit well above the BoE’s official 2.0% target. That gap is the whole story.
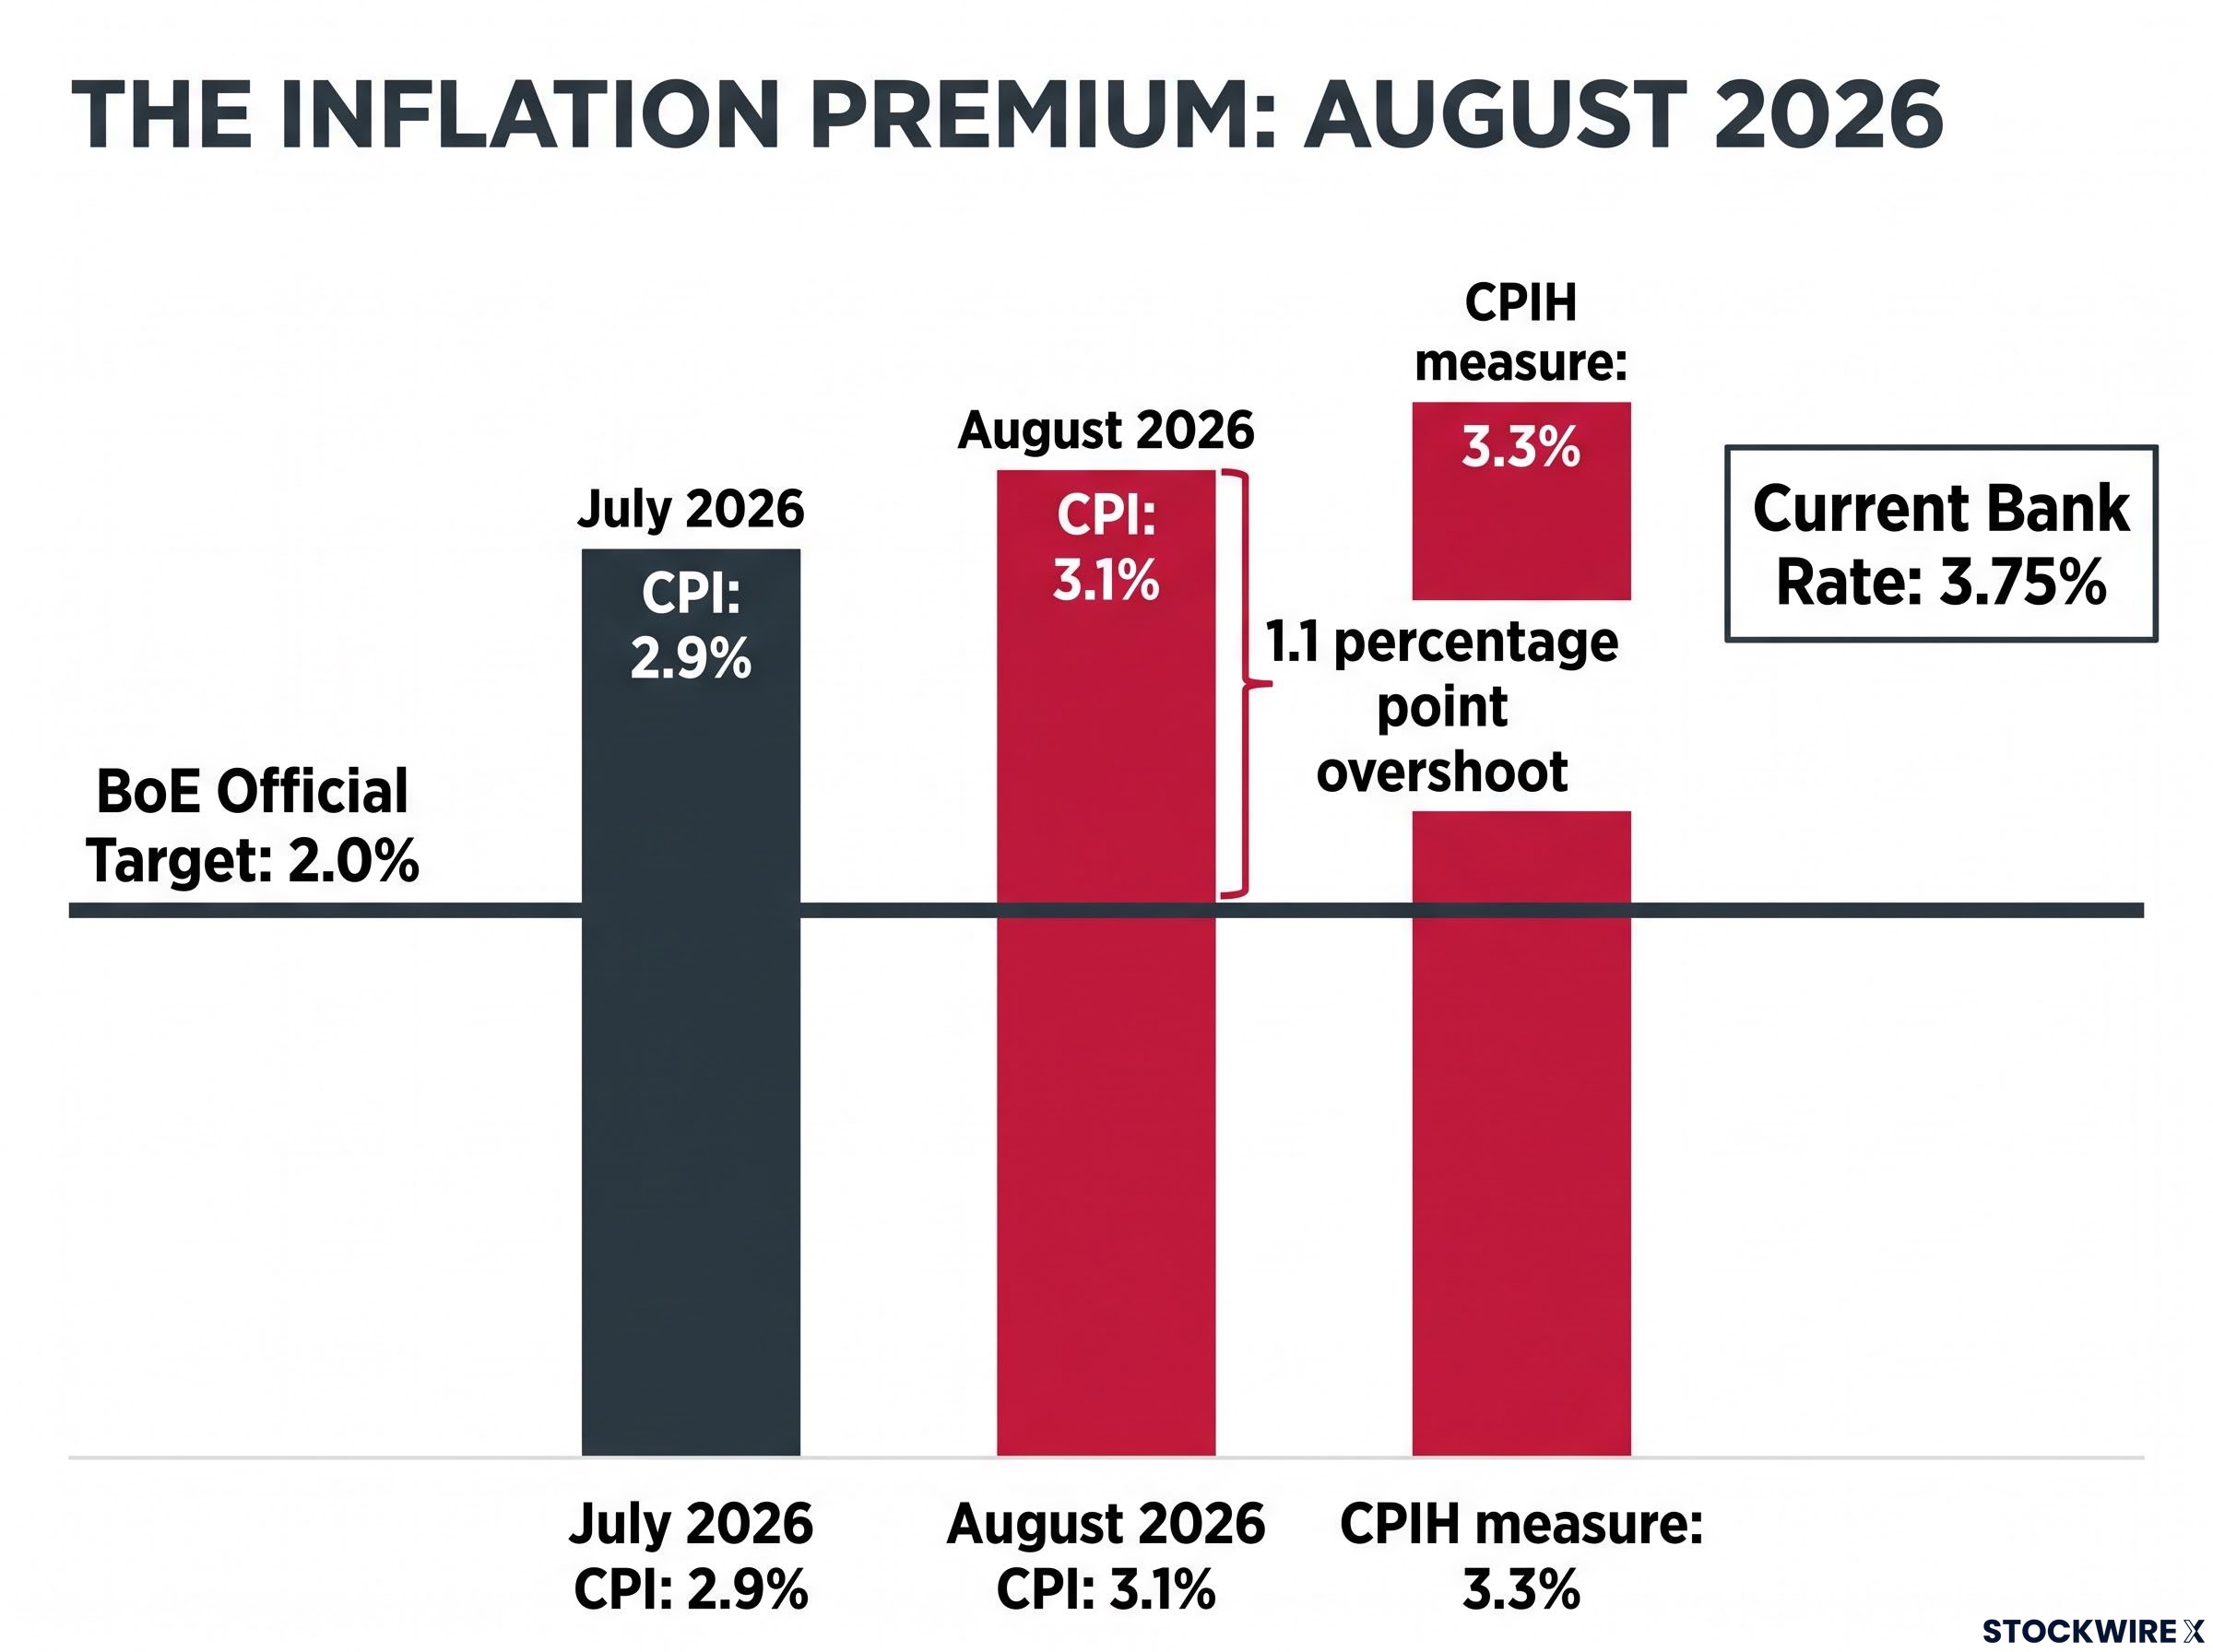
When inflation runs above target, the central bank has every reason to keep policy restrictive for longer, and that supports the currency’s yield appeal. For you, the read is simple: as long as that 1.1 percentage point overshoot persists, the case for near-term rate cuts weakens, and sterling keeps its interest rate advantage over currencies whose central banks are cutting freely.
The Bank itself has flagged the risk. In June 2026, BoE Chief Economist Huw Pill pointed to the danger that hitting the target would prove harder than hoped.
“Upside risks to achieving the inflation target have increased due to global supply chain issues and commodity impacts stemming from Gulf events,” Pill noted in his June 2026 commentary.
That kind of language matters because markets trade the words as much as the data. Following recent MPC communications, traders have pared back their bets on how quickly rates might fall.
How markets price policy divergence
Currencies do not move on one country’s rates alone. They move on the gap between them, known as the yield differential, which is simply the difference in returns an investor can earn holding one currency’s assets versus another’s.
The pound’s fate is tied to how BoE policy compares with the US Federal Reserve and the European Central Bank. If the Fed holds firm while the BoE is forced to cut, that differential narrows and sterling loses appeal.
Right now the positioning is unusual. Market pricing fully discounts a 25-basis-point hike by February 2027, which runs against the broader global trend towards easing. That leaves sterling exposed in both directions: supportive if the hike materialises, but vulnerable to a sharp fall if soft data forces the Bank to abandon the idea.
How high-frequency data and PMIs reshape expectations
Rate decisions arrive once a month. The data that shapes them arrives almost daily, and this is where sterling does most of its intraday moving.
The most watched of these releases are the Purchasing Managers’ Index (PMI) surveys. A PMI is a monthly survey of business managers asking whether output, orders, and hiring are rising or falling, and it works as an early proxy for economic growth long before official GDP figures land. A reading above 50 signals expansion; below 50 signals contraction.
PMI false signals occur in roughly 30-40% of cases across advanced economies, according to research from the ECB and Bank of England, which matters for sterling traders because a sub-50 flash reading can trigger an immediate algorithmic selloff even when underlying GDP growth later proves positive.
The August 2026 Flash UK Composite PMI came in at 52.5, a level generally consistent with around 0.3% quarterly GDP growth. That is modest expansion, enough to keep the Bank’s restrictive stance credible but not enough to remove the risk of a downgrade.
Because these flash surveys are the earliest reliable read on growth, you should treat them as the leading indicator for whether the BoE holds its ground or pivots to looser policy. When the numbers disappoint, traders move fast.
Here is how that repricing has played out in recent episodes:
- PMI disappointment, 24 July 2025: Preliminary surveys showed weaker-than-expected UK services activity and warned of rising job losses. Sterling dropped 0.3% against the dollar almost immediately and slipped against the euro as UK momentum looked poor next to the Eurozone.
- BoE communication, 18 June 2026: The Bank held rates but lowered its inflation forecasts. Markets read that as a signal of gradual disinflation, cut their rate hike bets, and sent the pound down 0.6% to $1.3207, its weakest in over two months.
- Sentiment repricing, 27 August 2026: Ahead of the Jackson Hole conference, investors trimmed their BoE tightening expectations to just 24.7 basis points for the rest of the year. Sterling hit a one-week low against both the dollar and euro, with no fresh BoE data released at all.
That last example is the one to sit with. The pound fell purely because expectations shifted, which tells you the currency trades on the anticipated policy path, not just the confirmed one.
Other releases feed the same machine. Forecasts point to a 0.2% month-on-month decline in August 2026 retail sales, a second consecutive contraction, while the GfK consumer confidence index has been sitting at -14. Weak consumer data chips away at the growth narrative, and a weaker growth narrative means a softer pound. Recognising which releases trigger institutional trading algorithms is what keeps you from being blindsided by a sudden intraday swing.
Structural valuation and the political risk discount
Step back from the daily data and a bigger question emerges: is the pound actually cheap or expensive? The honest answer is that it depends entirely on which model you trust, and the experts flatly disagree.
At one end, the Big Mac Index, a light-hearted purchasing power comparison run by The Economist, has typically found sterling 5-15% undervalued against the US dollar, implying a fair value near £0.78 per dollar. At the other, Goldman Sachs, using its GSDEER valuation model, has called the pound the most structurally overvalued currency in the entire G10.
Here is how the major assessments stack up:
| Model / Institution | Assessment | Primary rationale |
|---|---|---|
| Big Mac Index | Undervalued (5-15%) | Purchasing power parity implies fair value near £0.78 per dollar |
| Goldman Sachs (GSDEER) | Overvalued | Most structurally overvalued currency in the G10; policy divergence risk |
| Societe Generale | Overvalued | “Painfully overvalued” versus purchasing power parity |
| Morningstar | Modestly undervalued | Cheap against the dollar, but held back by political tail risks |
The reason these models can point in opposite directions is that they measure different things and ignore the anchor dragging on the pound: the UK’s twin deficits. The country runs both a budget deficit and a current account deficit, and NatWest has cautioned that these structural gaps, alongside weak productivity, keep sterling from trading up to any theoretical fair value.
Fiscal credibility and sterling are linked through the gilt market rather than the headline deficit number: when bond investors lose confidence in the debt path, the sell-off in long-dated gilts raises borrowing costs and weakens the pound simultaneously, a dynamic the 2022 mini-budget illustrated at speed.
Then there is politics, which can override every model overnight. Sterling is unusually sensitive here because a large share of UK government bonds is held by foreign investors, and they can head for the exit fast when fiscal discipline looks shaky.
In June 2026, the pound traded near its low for the year amid uncertainty over the future of Prime Minister Keir Starmer, driven entirely by fears that a successor might loosen fiscal rules. No economic data moved it. Political narrative did.
The takeaway for you is a matter of sequencing. Valuation models give you a useful long-term anchor, but they should never be your sole basis for a trade when political and fiscal risks are running hot, because those risks can trigger capital flight that no fair-value chart will warn you about. Through September 2026, spot GBP/USD has hovered broadly in the 1.33 to 1.36 range, a band that reflects exactly this tug-of-war between cheap-on-paper and risky-in-practice.
Navigating the next currency catalyst
Pull the framework together and sterling’s direction comes down to a constant three-way tug-of-war: BoE rate expectations, the real-time economic data that shapes them, and the structural and political risk premiums that can override everything else. No single force wins permanently. The balance shifts week to week.
The next major test is already on the calendar. The MPC’s rate announcement on 5 November 2026 will show whether the committee’s inflation worries or its growth concerns are winning, and the pound will move on the verdict and the language around it.
The GBP/USD outlook heading into the 5 November MPC meeting is shaped by a compressed technical range and a wide bank forecast dispersion, with Goldman Sachs targeting a decline to 1.3250 on structural grounds while Scotiabank projects a recovery to roughly 1.37 by year-end, and the deciding variable is whether the BoE’s hold is read as a prelude to easing or a credible inflation-fighting stance.
Your early warning system is the run of data before that meeting. Watch the interplay between the next flash PMIs and inflation prints closely, because that combination will tell you which way the BoE is leaning long before the decision lands.
This article is for informational purposes only and should not be considered financial advice. Investors should conduct their own research and consult with financial professionals before making investment decisions.
Past performance does not guarantee future results. Financial projections are subject to market conditions and various risk factors, and forward-looking statements are speculative and subject to change based on market developments.