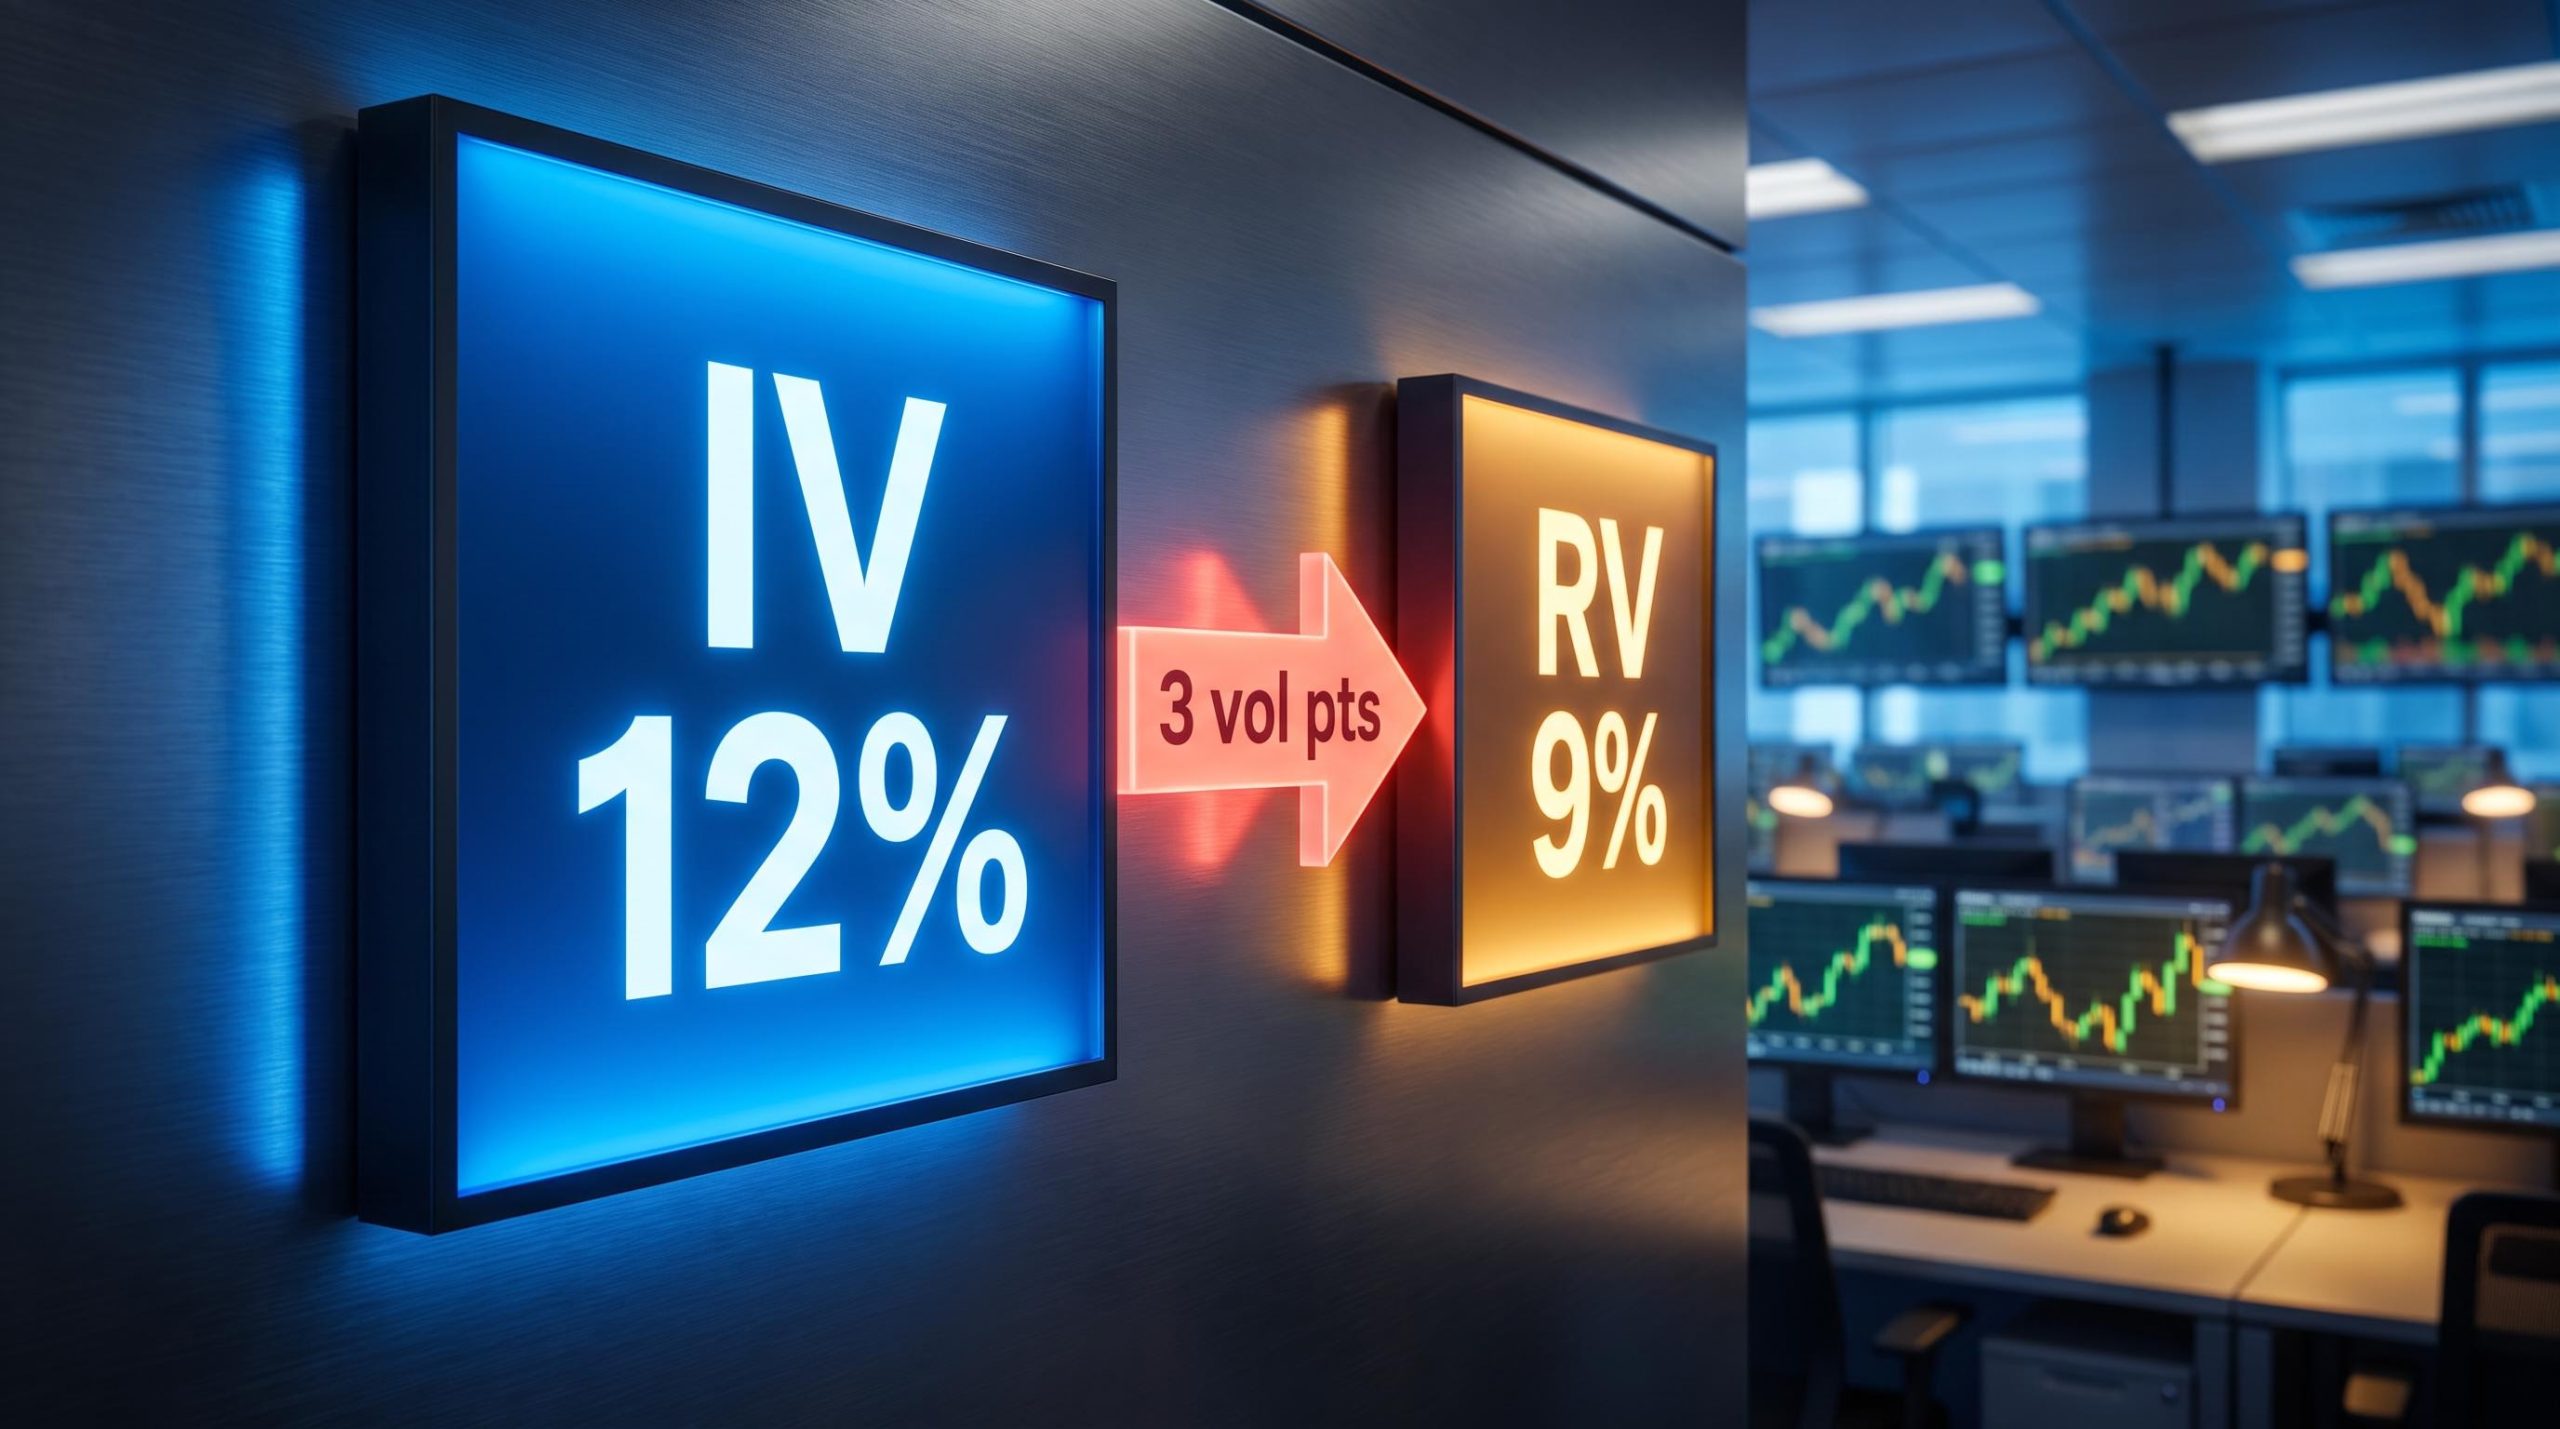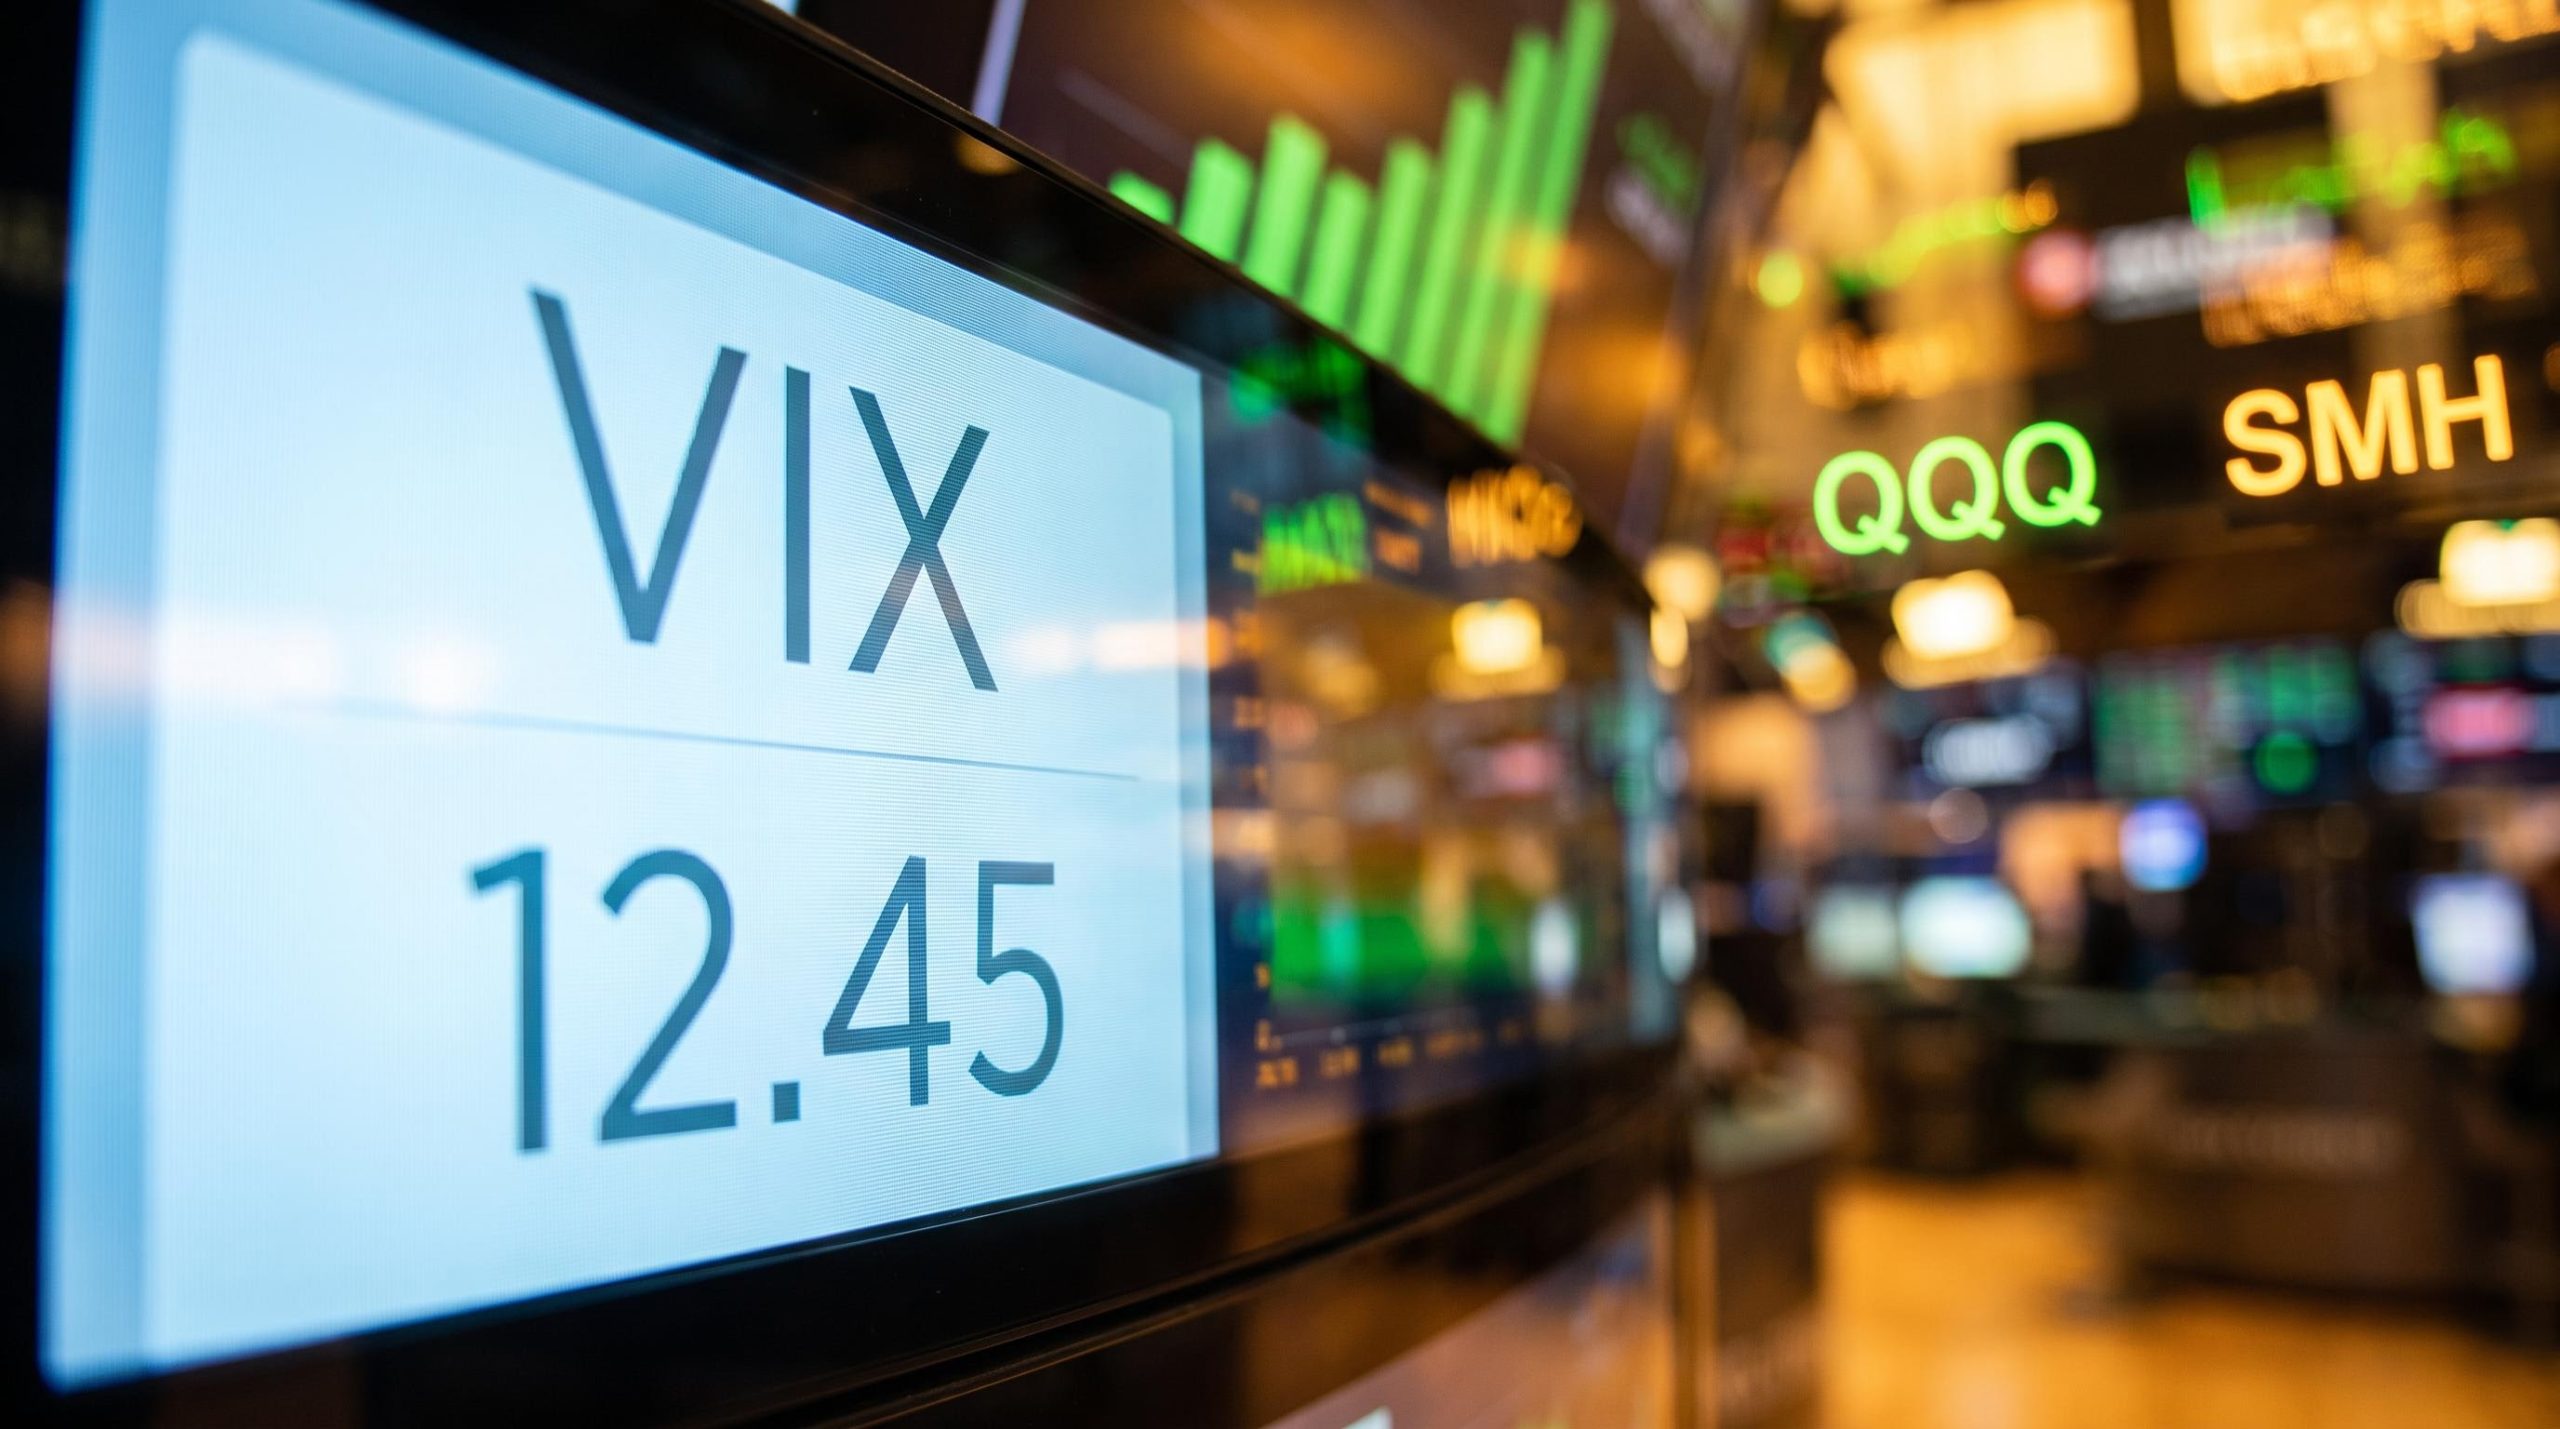
Most investors watching the market right now are looking at the wrong number. The VIX is subdued, broad index volatility is scraping the bottom of its 12-month range, and the surface reading is calm. That calm is misleading.
Underneath it, individual technology and semiconductor names are moving hard, and the options priced on them tell a completely different story from the ones priced on the index that supposedly contains them.
This gap has a name: volatility dispersion. It is the reason a tech-heavy portfolio can look tranquil on an index dashboard while carrying meaningful single-stock risk premiums you never see.
Here is the problem. As of early September 2026, the tech-led rally is pushing the Nasdaq past the broader market, yet index-level implied volatility keeps falling. If you rely on the VIX to gauge your exposure, you are flying blind on the positions that actually drive your returns.
This piece builds the framework you need to trade that environment. You will learn how dispersion creates mispriced options, how to read the pricing signals before you commit capital, why buying into known catalysts so often backfires, and how to structure a technology sector options strategy for the volatile final months of the year.
How volatility dispersion creates mispriced opportunities
The signal is in the spread between the indices. As of early September 2026, Eigendex comparisons show QQQ delivering a 3-month return of 8.79% against SPY at 8.52%. The gap looks small until you notice what is happening beneath the surface of each fund.
Since the Jackson Hole gathering roughly a week before 8 September, the semiconductor ETF SMH posted the strongest sector gains of the group. The small-cap IWM, meanwhile, fell around 1.5% over the same stretch. Tech surged while the rest of the market drifted or declined.
That is not one market rising together. That is a handful of names doing the heavy lifting while correlation quietly breaks down.
Volatility dispersion Dispersion measures the gap between how much individual stocks move and how much the index they belong to moves. When a cluster of AI and semiconductor names posts large upside swings while other components lag, realised correlation falls. Lower correlation means the index moves less than the sum of its parts, which structurally suppresses index volatility while single-stock volatility stays elevated.
This widening gap tells you something the VIX cannot. Relying on broad index metrics will blind you to the actual risk premiums priced into your individual tech holdings.
The structural gap between stock volatility vs VIX readings is not a data error: dealer gamma hedging from roughly $200 billion in annual structured product issuance mechanically pins the index while individual names swing freely, which is precisely why a subdued VIX can coexist with violent single-stock moves in your portfolio.
Navigating the divergence between indices
The QQQ and the SPY diverge because of what sits inside them. QQQ concentrates the largest technology and semiconductor names, so when that narrow group rallies, the fund captures the full force of it. SPY carries technology as a major weighting but dilutes it across sectors that were flat or falling, which dampens both its return and its volatility.
IWM is a different animal entirely, built from small-caps with no meaningful AI exposure, which is why it lagged rather than led.
This structural quirk is exactly what institutional desks harvest. Dispersion trading involves selling index volatility, typically SPX or NDX straddles, while buying volatility on the individual index components. The trade profits when single-stock moves stay large and the index stays quiet, which is precisely the environment on display now. You do not need to run that trade to benefit from understanding it, because recognising where volatility premium is overpriced versus underpriced is the foundation for everything that follows.
When big ASX news breaks, our subscribers know first
Reading options pricing signals before committing capital
Before you buy a single contract, you need to read what the options market is already telling you. Three metrics do most of the work.
The first is Implied Volatility Rank, and it is widely misunderstood.
Implied volatility rank is best understood as a percentile, not a raw level: it tells you where current pricing sits within a stock’s own 12-month range, and that relative framing is what makes it a useful filter for choosing between premium-selling and premium-buying structures rather than a signal about direction.
- Implied Volatility (IV) Rank: where current implied volatility sits within its own 12-month range, expressed from 0 to 100. As of 7 September 2026, OptiView reports QQQ’s 30-day at-the-money implied volatility at 15.9% with an IV rank of 40, placing it squarely mid-range. SMH tells a starker story: OptionCharts data from 4 September 2026 shows an IV rank of just 13.04%, near the very bottom of its yearly range.
- Call skew: how expensive upside calls are relative to at-the-money options. High call skew signals institutional demand for upside exposure.
- Put skew: how expensive downside puts are relative to at-the-money options. High put skew signals demand for protection.
The contrast in the small-cap corner is telling. IWM’s put skew percentile sits near 86% while its call skew percentile is around 30%. Investors are paying up for downside protection on small-caps and showing almost no appetite for upside, the mirror image of the bullish call demand across large-cap tech.
The trap of high IV rank
Here is where traders get hurt. A high IV rank does not mean a stock is about to revert to calmer conditions or that a large move is coming. It is a descriptive measure of pricing, not a directional signal.
Industry consensus is blunt on this: IV rank is better suited to choosing between long-volatility and short-volatility structures than to predicting direction. Assuming a stock “must” fall back because its IV rank is high is one of the fastest ways to lose money.
The practical takeaway is structural. In a high IV rank environment, options are expensive, so strategies that sell premium or spread the cost make more sense than outright buying. In a low IV rank environment like SMH’s, buying options is comparatively cheap, which changes the maths of what you should build.
Why this matters before any catalyst
Mastering these metrics protects you from the most expensive mistake in options: overpaying for volatility that is mathematically destined to collapse. You can guess a stock’s direction correctly and still lose, because the premium you paid was inflated by an event that has now passed. That is the trap the next section quantifies.
Surviving event risk and the volatility collapse trap
Options prices climb into known catalysts, then fall off a cliff the moment the event passes. This is IV crush, and the numbers are brutal.
Take Apple. Its recent 8 September product event was priced in the options market like an earnings report, with elevated implied volatility and strong positive call skew reflecting broad bullish sentiment. History shows what tends to happen next.
An Interactive Brokers study quantified Apple’s post-earnings behaviour: implied volatility historically drops from an average of 32.2 just before the report to 26.4 the next trading day, roughly an 18% decline in a single session. The stock can move in your favour and your call can still lose value, purely because the volatility premium evaporated.
Nvidia is even more dramatic. MarketChameleon’s coverage from 29 May 2025 documented NVDA contracts where implied volatility fell from 91.7 to 41.5 after earnings. Across recent earnings events, NVDA has seen single-session implied volatility collapses of 52% to 56%.
| Stock | Pre-event implied volatility | Post-event implied volatility | Single-session change |
|---|---|---|---|
| Apple (AAPL) | 32.2 (average) | 26.4 next day | ~18% decline |
| Nvidia (NVDA) | 91.7 | 41.5 | ~52% to 56% collapse |
The historical data proves the point. Buying short-dated, unhedged calls into known tech catalysts is a negative-expectation strategy, and you should avoid it.
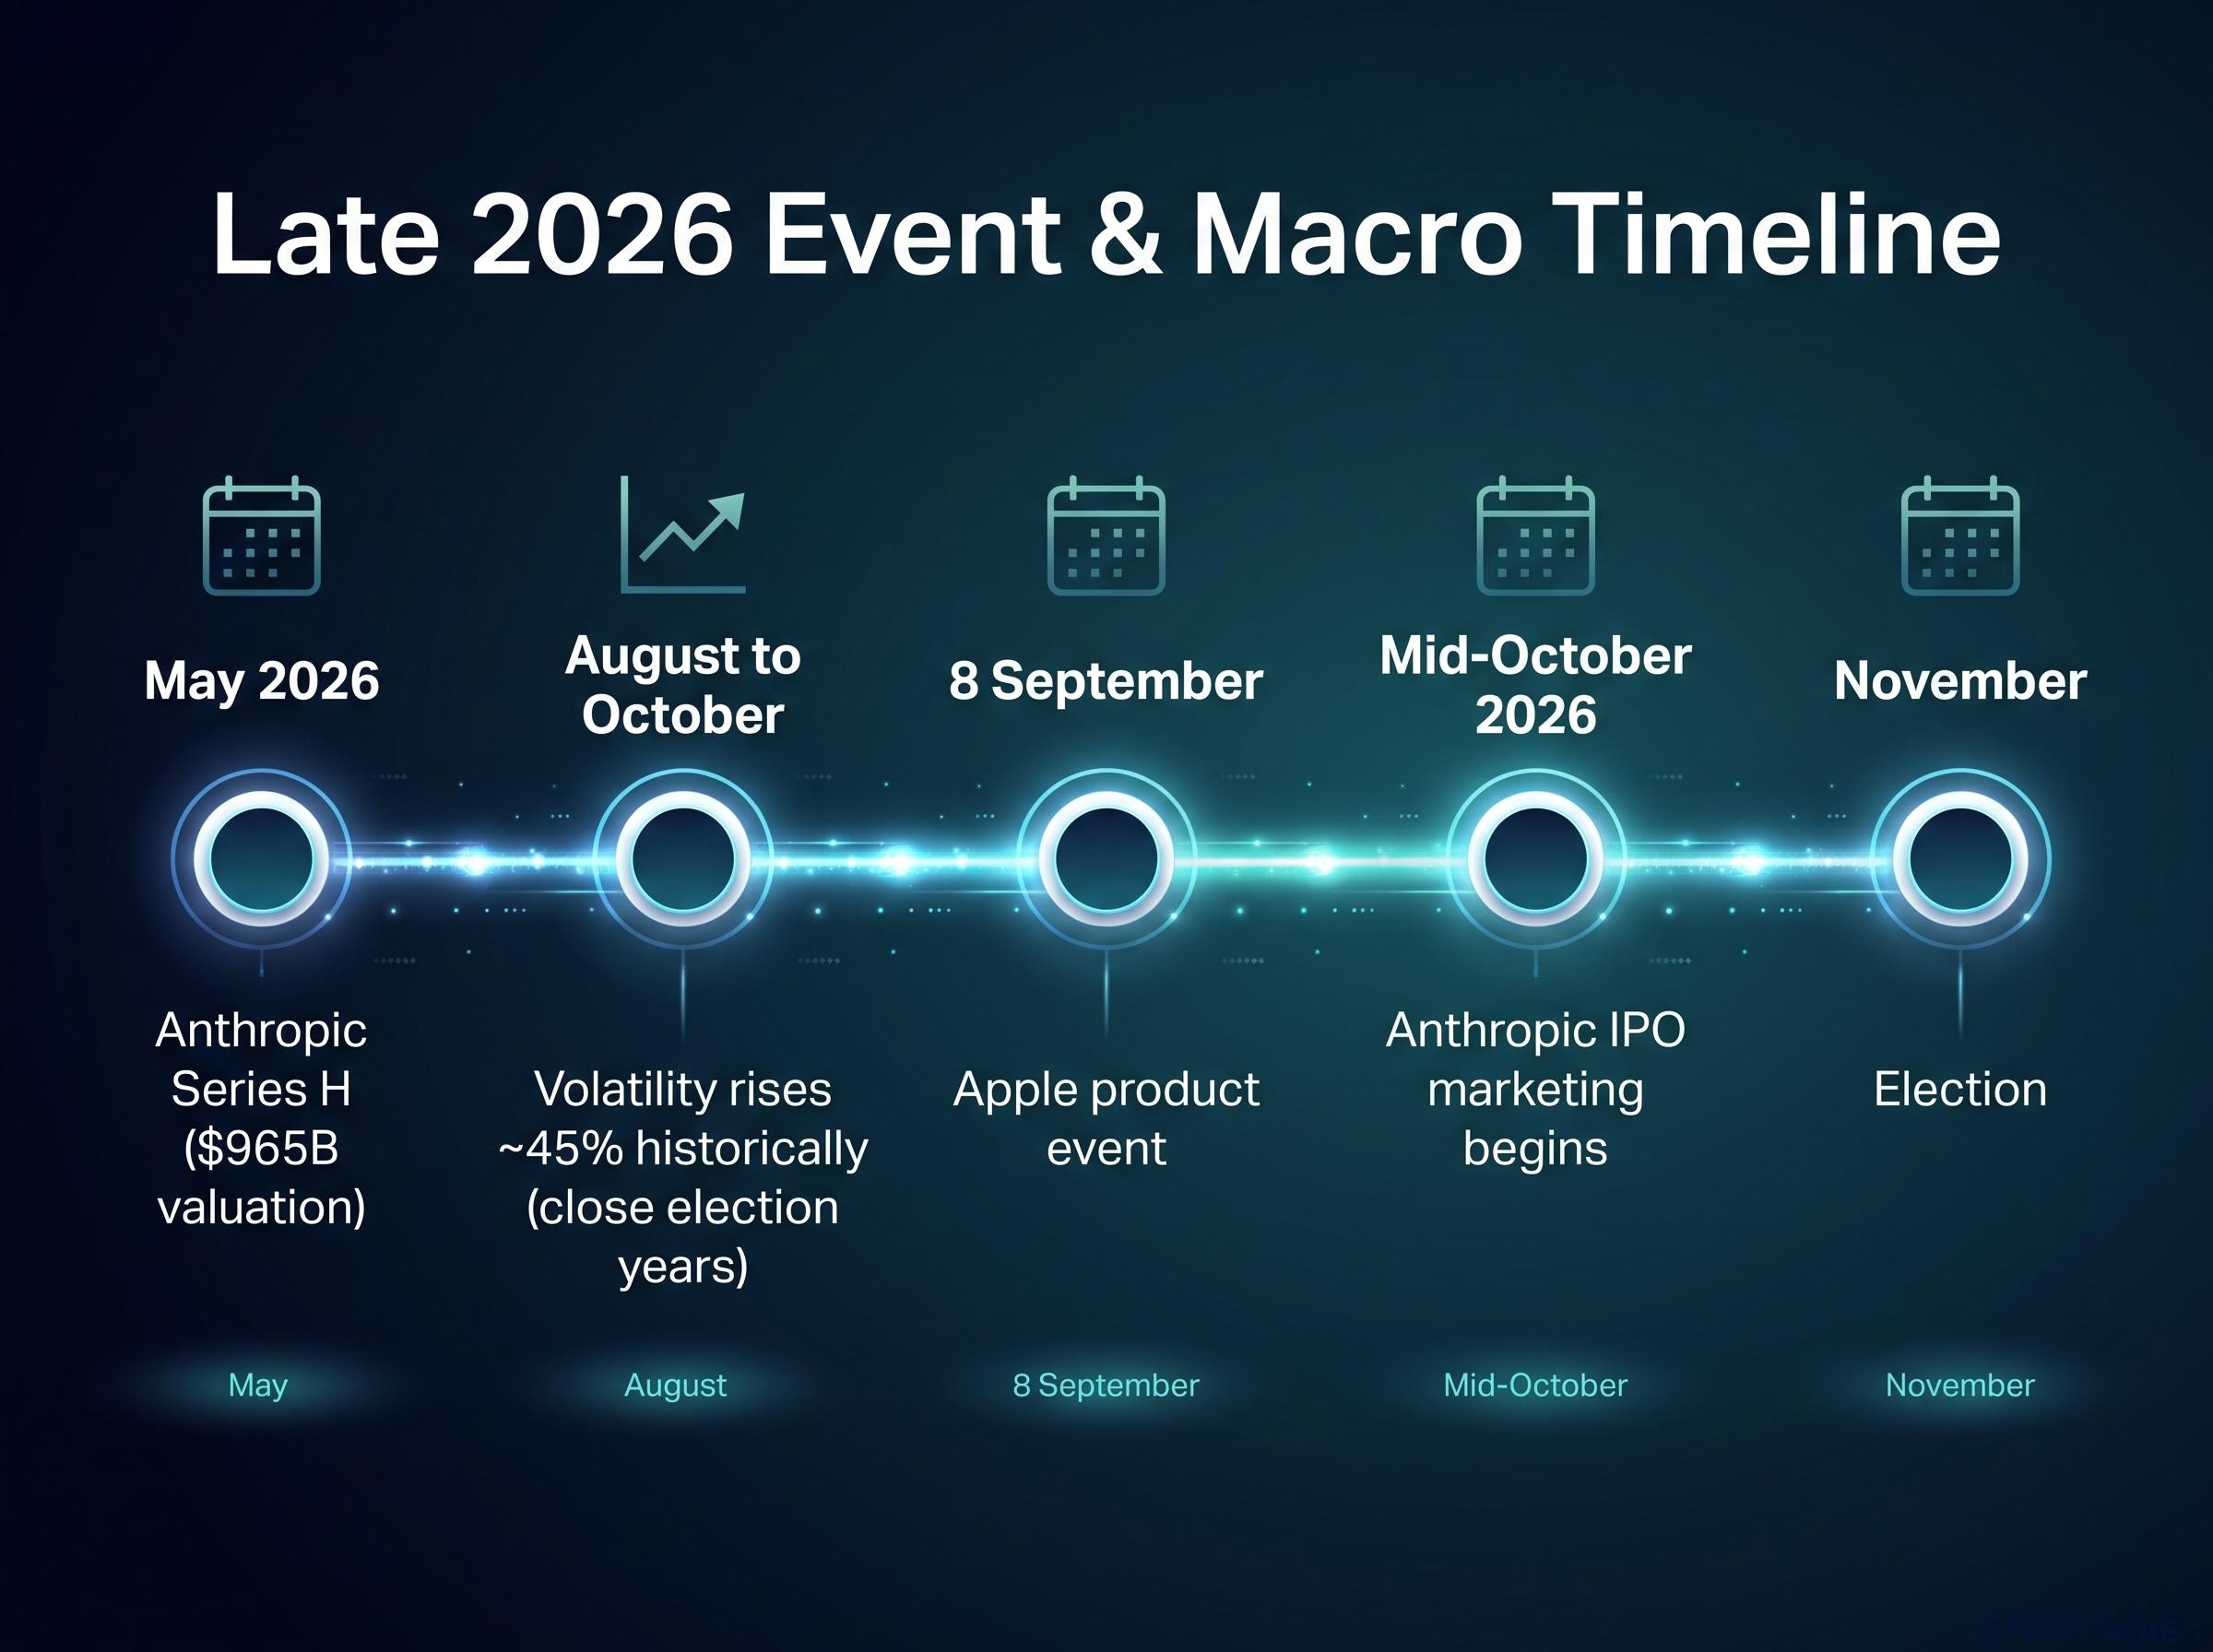
The next catalyst on the horizon amplifies the risk. According to a Reuters exclusive from 4 September 2026, Anthropic is now expected to begin marketing its initial public offering in mid-October 2026 at the earliest, with a last confirmed private valuation of $965 billion from its May 2026 Series H round. An IPO of that scale is a sector-wide volatility event, and the temptation to buy calls into the hype is exactly what the IV crush maths punishes. Understanding this changes how you should approach every product launch, earnings print, and listing between now and year end.
Structuring your portfolio for the late 2026 macro environment
Single-stock tactics only take you so far. The final months of 2026 carry macro risk that demands a portfolio-level answer.
Two forces dominate. Futures markets have priced in a high probability of Fed rate cuts, a backdrop that historically favours technology as a beneficiary of easing. Against that sits election seasonality: Nasdaq’s analysis of close election years shows volatility rising about 45% between August and October before falling once results are known.
Midterm election volatility follows a documented seasonal pattern: Guggenheim research covering S&P 500 data back to 1946 shows every midterm election year has produced an average peak-to-trough drawdown of approximately 17.6%, and the VIX has fallen during the August window in all eight of the last eight instances before reversing once summer flows withdrew.
That combination, supportive rate expectations paired with pre-election turbulence, is precisely why you should not choose between aggression and defence. You can run both.
The structure pairs defined-risk upside on individual tech names with cheap downside insurance on the broad index. Here is the sequence:
- Select technology names with strong balance sheets and AI-driven earnings, then express the view through call options rather than shares, capping your loss at the premium paid.
- Favour names sitting in low IV rank territory, where options are comparatively cheap, to avoid buying inflated premium.
- Buy put options on IWM or SPY as a portfolio hedge, taking advantage of the extremely low cost of index protection created by suppressed broad market volatility.
- Size the index hedge to offset your technology concentration, not to eliminate every dollar of risk.
- Set defined exits before the October catalysts and the November election, so no single event dictates your outcome.
The logic is the whole point. Because index volatility is so cheap right now, you can capture technology upside without exposing your entire capital base to a pre-election shock, using inexpensive downside options to hedge your directional bets.
This article is for informational purposes only and should not be considered financial advice. Investors should conduct their own research and consult with financial professionals before making investment decisions. Past performance does not guarantee future results, and these statements are speculative and subject to change based on market developments.
Building resilience into your tech options playbook
The two threads of this piece are really one idea. Volatility dispersion tells you where single-stock premium is mispriced, and macro event risk tells you when the broad market is most likely to wobble. Reading both at once is what separates a considered position from a directional guess.
The recurring lesson is that direction alone is not enough. You can be right about Apple, Nvidia, or the next AI listing and still lose money if you ignore what the options market has already priced in. Pricing awareness, not conviction, is the edge.
Keep your structures defined-risk as the calendar turns. The Anthropic listing, the October catalyst cluster, and the November election will each test unhedged positions, and the investors who paired cheap index protection with disciplined single-stock exposure will be the ones still standing when the volatility finally reprices.
For investors ready to implement dispersion-based hedging at a more structural level, our comprehensive walkthrough of cash-settled index options hedging covers the NDX European-style settlement advantage, Section 1256 tax treatment, and a worked AMD-NDX paired trade that captured a 10-20 volatility point dislocation over four trading days.