Here is a number that should reframe how you look at every SPY option you have ever bought or sold: over the past decade, the options market has overstated the risk of the next 30 days roughly 84% of the time. Most traders act on that gap without ever measuring it.
The distance between what SPY options imply about future volatility and what volatility actually shows up, tracked over ten years from 2016 through August 2026, is not a quirk in the data. It is one of the most consistently documented features in U.S. equity options markets, and it shapes how premium gets priced and who tends to profit from that pricing.
After reading this, you will be able to assess whether the gap between implied and realised volatility in SPY represents an edge worth pursuing, and just as importantly, the specific conditions under which that edge stops working and starts costing you.
What the implied vs. realized volatility gap actually measures
Picture the number you see on your screen before placing a trade: a 30-day implied volatility reading sitting well above the size of the moves SPY has actually made over the past month. That visible gap is the whole story, but you cannot read it correctly until you understand the two numbers producing it.
Implied volatility is the forward-looking expectation of price movement baked into an option’s price. It is derived from what buyers and sellers are collectively willing to pay for the period ahead, so it reflects the market’s guess about the future, not a record of the past.
The IV-RV gap calculation rests on a precise foundation: implied volatility mechanics, including how IV is extracted by reverse-engineering live option prices rather than from historical data, determine what the forward-looking number actually represents before any comparison to realised movement is meaningful.
Realised volatility is the opposite in direction. It is the annualised standard deviation of SPY’s actual daily returns over a comparable historical window, which means it is backward-looking by construction. It tells you what already happened, nothing more.
The difference between these two figures, measured over the same horizon (typically 30 days for SPY), is the IV-RV gap, also called the volatility risk premium or VRP. It is simple arithmetic: implied minus realised.
| Metric | Definition | Lookback Direction |
|---|---|---|
| Implied Volatility | Expected 30-day price movement priced into options | Forward-looking |
| Realised Volatility | Annualised standard deviation of actual daily returns | Backward-looking |
| IV-RV Gap (VRP) | Implied minus realised over the same horizon | Comparative |
In early September 2026, SPY’s 30-day at-the-money implied volatility sat somewhere between 11.0% and 12.81%, depending on the observation date. Put that against a recent realised figure and the gap becomes concrete.
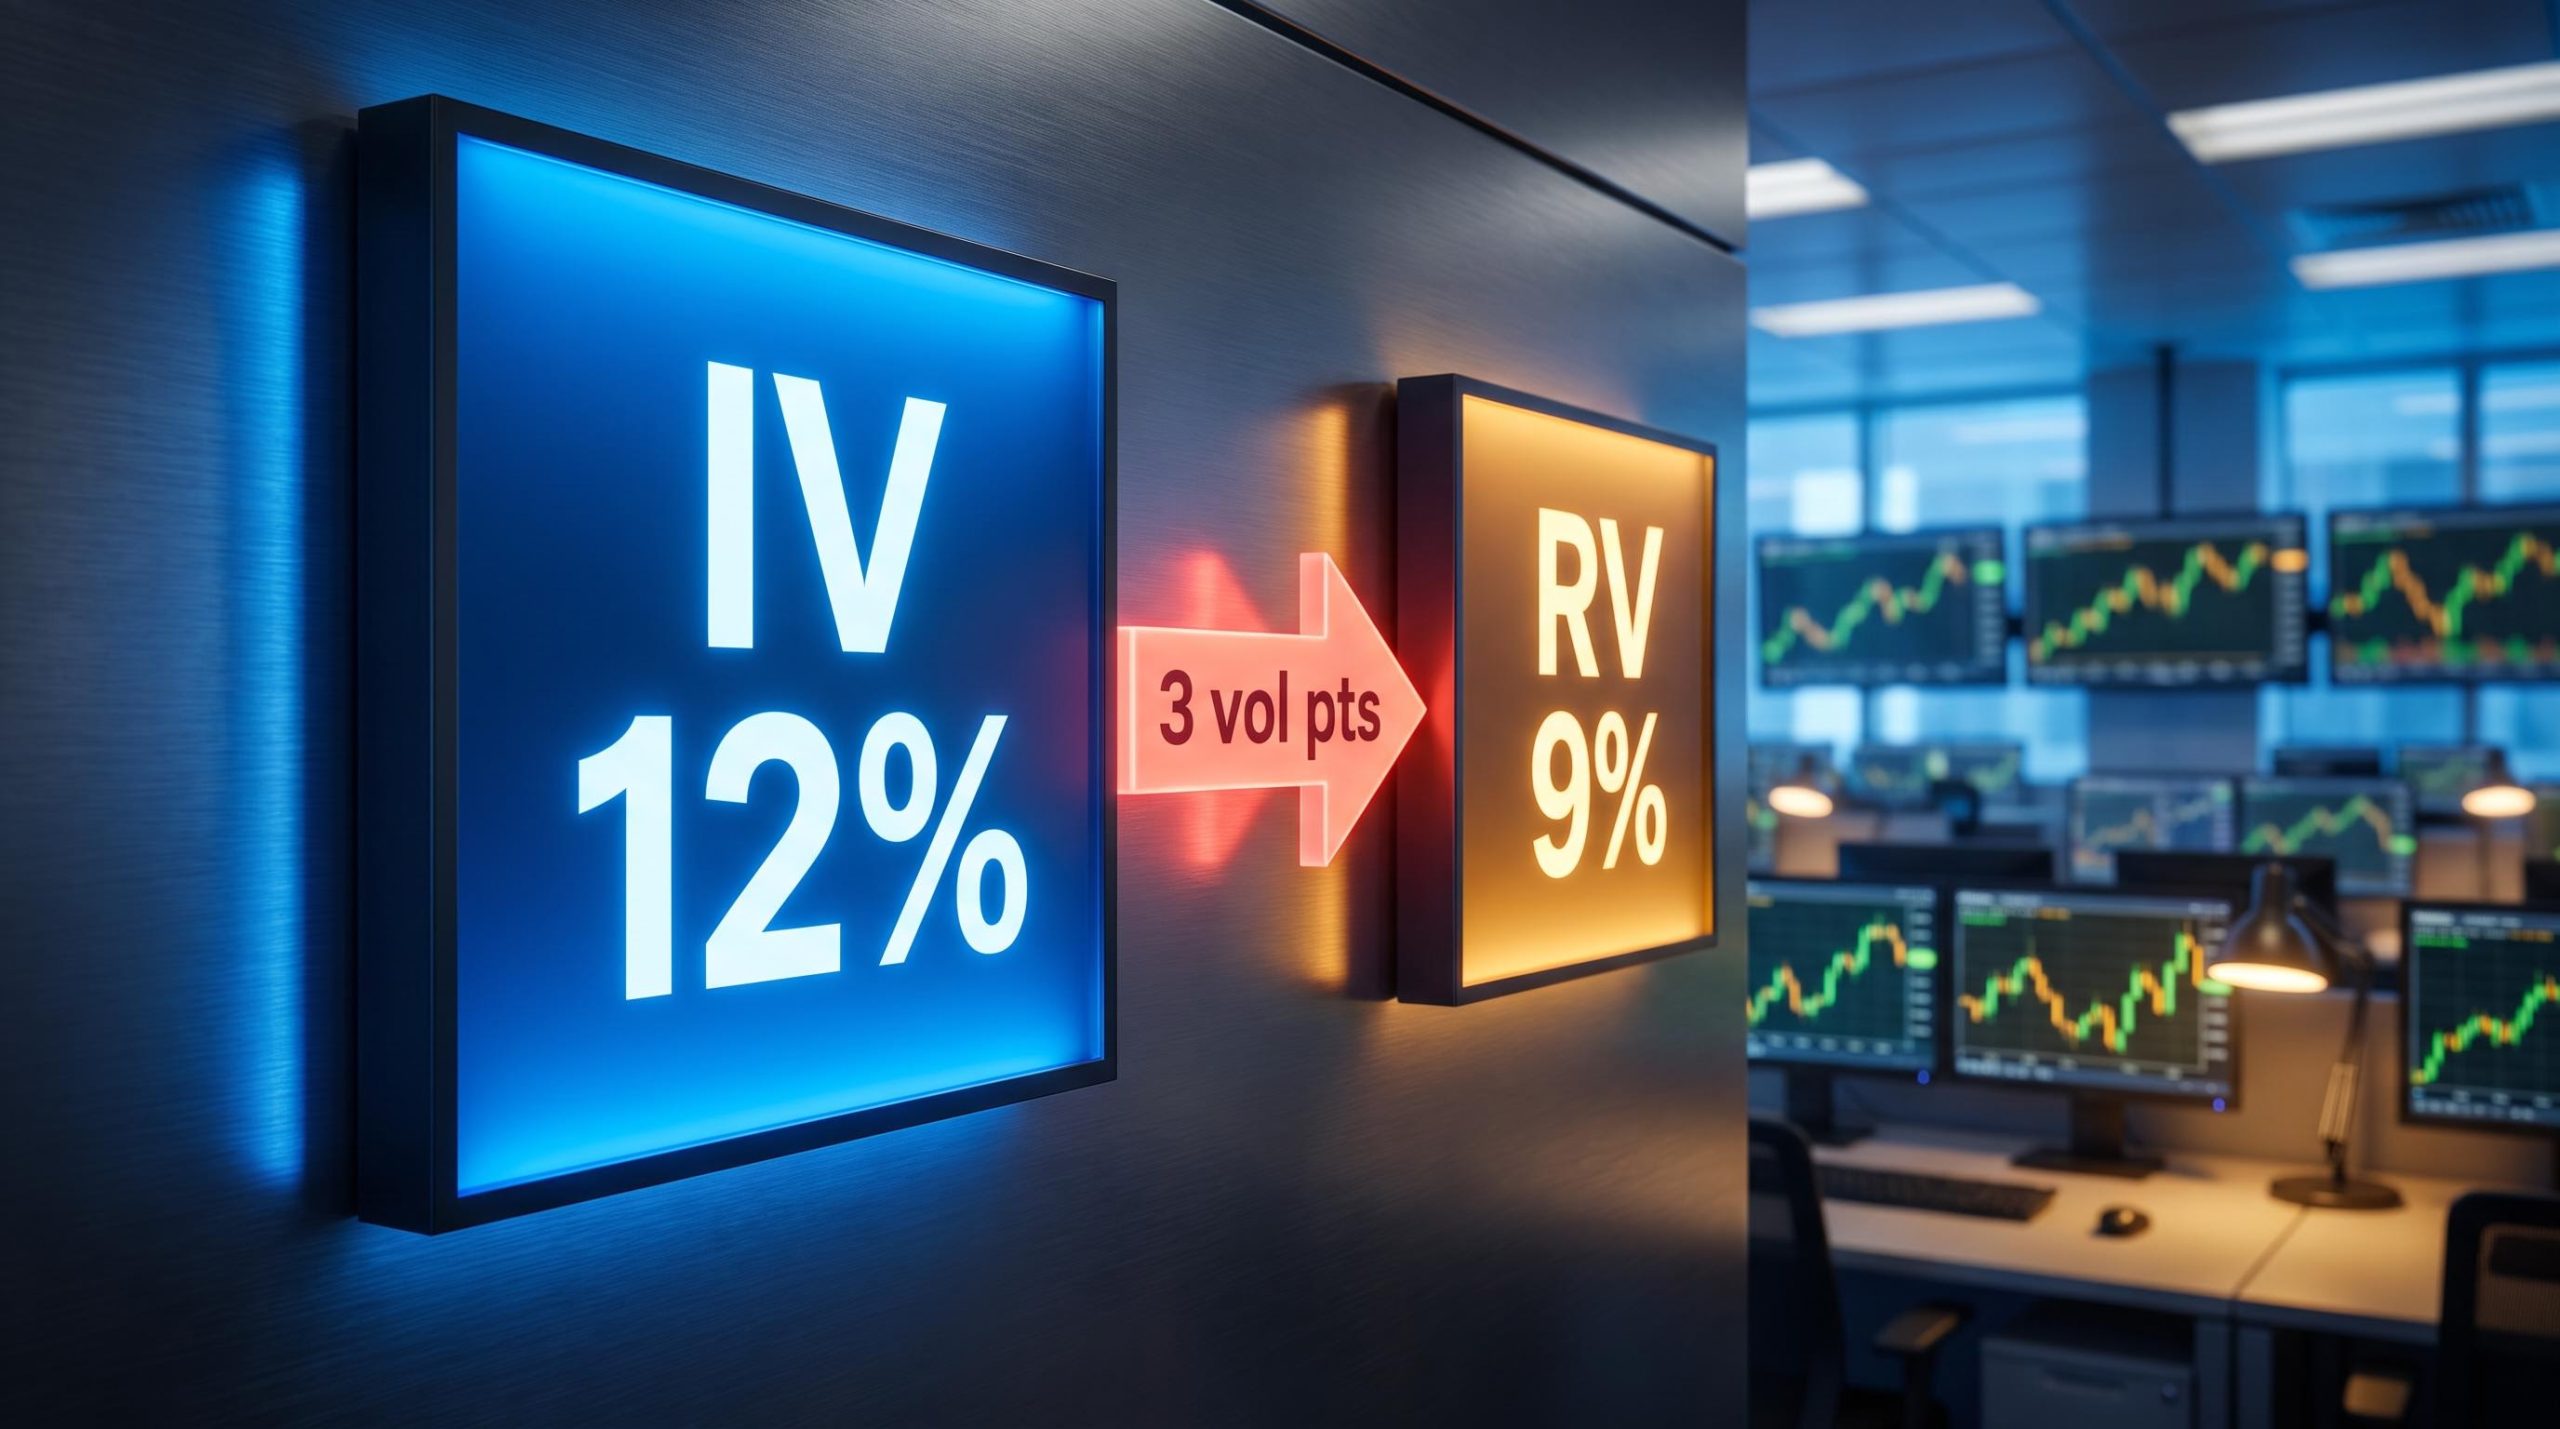
A worked example If SPY’s 30-day implied volatility reads 12% and realised volatility over the prior 30 days was 9%, the volatility risk premium is 3 volatility points. That is the amount the options market is charging above what recent price action actually delivered.
One clarification worth holding onto: the VIX measures implied volatility on the S&P 500 index, not on SPY shares directly. The two track each other closely, but ETF-specific factors and skew mean they are proxies, not identical twins. The size of the gap on any given day tells you how much the market is charging over and above delivered movement, and that surcharge is the structural starting advantage that premium sellers work from.
When big ASX news breaks, our subscribers know first
A decade of SPY data: how often and by how much IV overstates realized volatility
The single most useful thing you can do with the volatility risk premium is stop treating it as intuition and start treating it as a base rate. The data lets you do exactly that.
The primary dataset here is a decade-long examination of SPY options running from 2016 through August 2026, comparing 30-day implied volatility against 30-day realised volatility calculated from closing prices. Look at it in stages rather than all at once, and a pattern builds.
Across the full period, implied volatility exceeded realised volatility 84% of the time, with an average premium of 3.18 volatility points. That is the baseline.
Narrow the window to the post-COVID stretch of 2020 through 2026, and the overestimation frequency climbs to 85%. Narrow it again to 2026 year-to-date, and it reaches 88%, the highest reading of any sub-period examined.
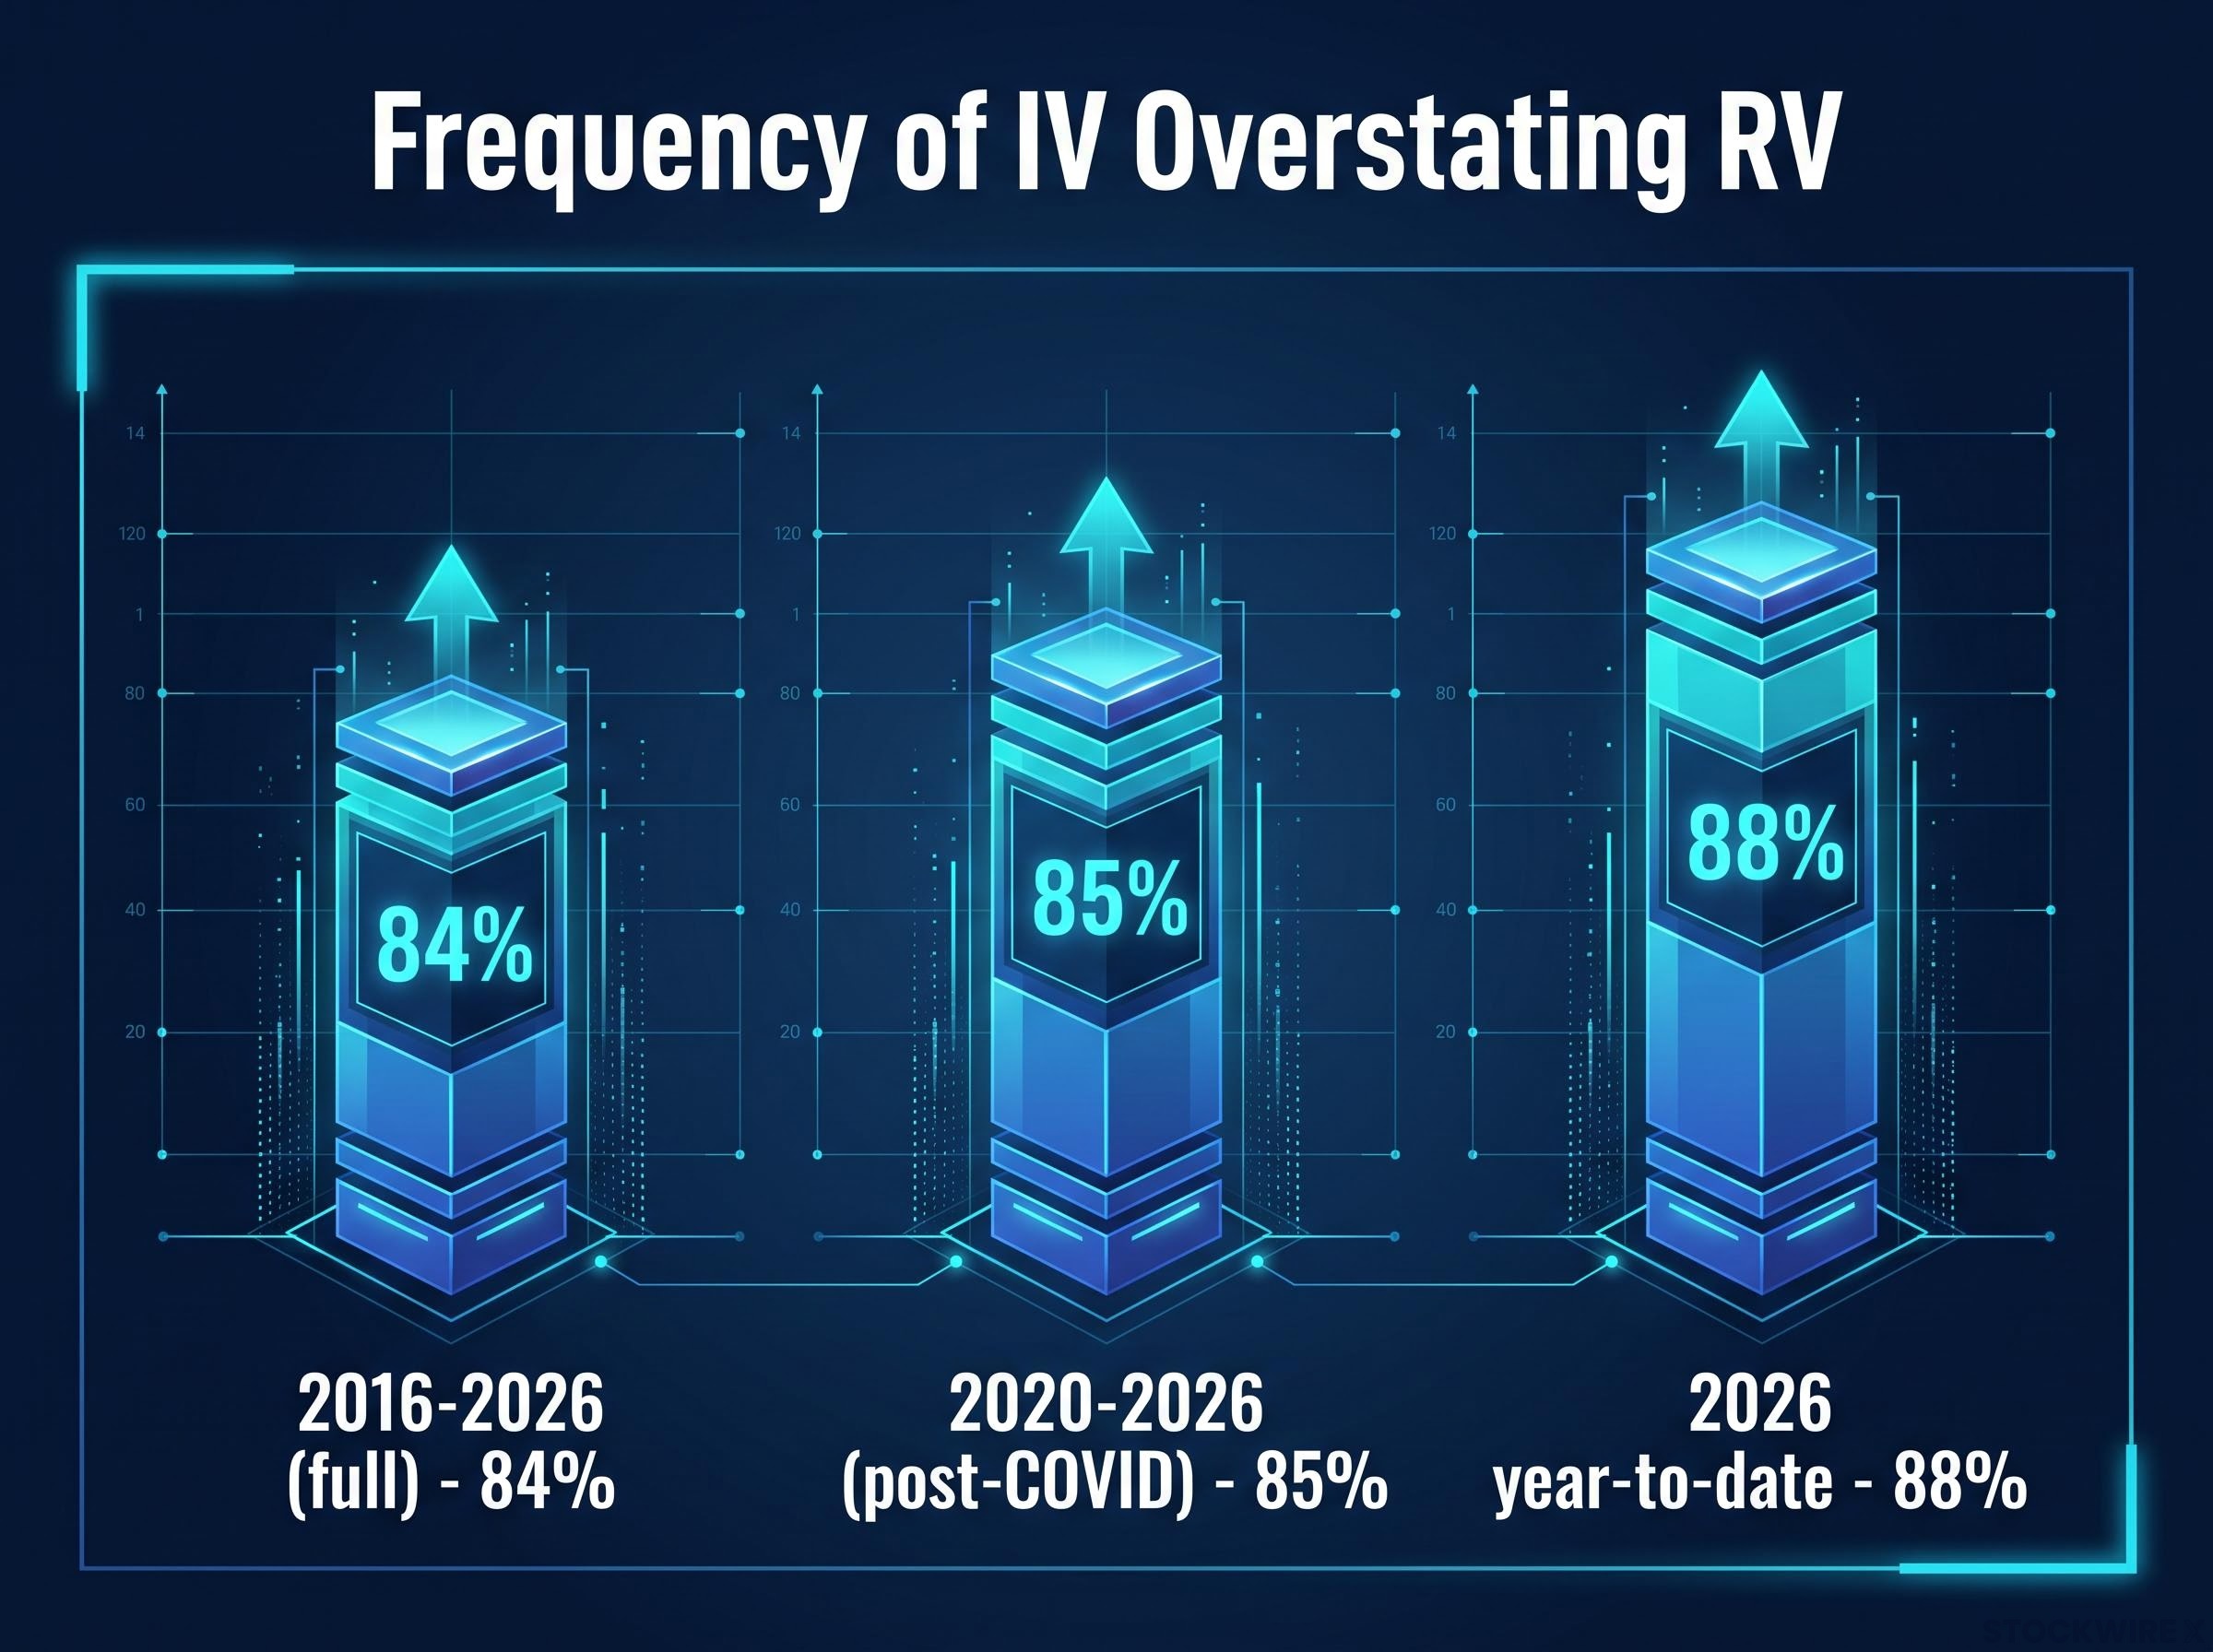
The most recent reading is the highest In 2026 year-to-date, SPY implied volatility overstated realised volatility 88% of the time, the strongest overestimation frequency across the entire decade of data.
That upward drift matters. It tells you the premium is not a fading artefact of one market regime; if anything, its consistency has firmed rather than eroded over the most recent years.
IV-RV compression at record highs is a specific sub-pattern within the broader VRP: on S&P 500 all-time high close days, options imply a 0.92% daily move while the market delivers just 0.33%, a 2.8x implied-to-realised ratio that is roughly double the long-run average and illustrates how the gap is not evenly distributed across market conditions.
None of this is unique to SPY, which is the point of checking it against wider research. Multi-decade studies of the S&P 500 and the VIX land in the same territory.
| Time Period | IV Exceeds RV Frequency | Average Premium (vol points) | Source |
|---|---|---|---|
| 2016-2026 (full) | 84% | 3.18 | Jood |
| 2020-2026 (post-COVID) | 85% | N/A | Jood |
| 2026 year-to-date | 88% | N/A | Jood |
| 1990-2025 (VIX vs RV) | 85.1% | 4.02 | Genaireview |
| 1990-2024 (monthly) | 89% of months | 4.1 | Gateway/Natixis |
According to Genaireview, across 9,066 daily observations from 1990 to 2025, the VIX averaged 19.5% against subsequent realised volatility of 15.4%, a 4.02-point premium. A Gateway/Natixis study of monthly data from 1990 to 2024 found positive premium in 89% of months. YieldDelta’s review of 2004-2024 data put average implied at roughly 16% against realised near 13%, with positive premium on more than 70% of trading days.
Even single-day snapshots reinforce it. Barchart flagged a volatility risk premium of 5.60 points on 3 June 2026, well above the median for calm-market conditions.
An overestimation frequency sitting between 84% and 88% for a decade means this is a feature of how SPY options are priced, not a lucky streak. Treat it as your baseline expectation, and the intuition-versus-evidence problem largely disappears.
Why the gap persists: the structural and behavioral mechanics behind the premium
A base rate this durable raises an obvious question. If the market so reliably overestimates future movement, why has the gap not been arbitraged out of existence? The answer is that several distinct forces feed it, and no single one can be traded away.
Start with the most intuitive framing: insurance. Option sellers take on the risk of sudden drawdowns and volatility spikes that average historical movement never captures, so they demand payment above what backward-looking volatility alone would justify. According to AQR and the Bank of Canada, this is rational compensation for bearing that risk, the same logic that makes any insurance premium exceed the expected payout.
The second force is structural hedging demand. Institutional programmes run persistent, systematic buying of downside protection, and long-equity investors routinely overpay for out-of-the-money index puts. That standing imbalance between hedgers who buy and volatility suppliers who sell keeps implied volatility propped above realised.
Three ways the literature explains the same gap
The research does not settle on one explanation, and knowing all three exist matters because each implies something different about how durable the premium is.
- Rational compensation: The gap is an equilibrium reward for bearing downside risk, much like the equity risk premium itself, not an inefficiency at all.
- Structural imbalance: The gap reflects supply and demand, emerging from the persistent gap between net option buyers who hedge and net sellers who supply volatility.
- Behavioural overpricing: The gap contains genuine inefficiency, where investors systematically overpay for protection out of psychological preference, creating an exploitable bias.
All three almost certainly operate at once, and their relative weight shifts with conditions.
A third mechanism sits underneath the debate: distributional fat tails. U.S. equity indices exhibit negative skew and excess kurtosis, meaning they produce larger losses than a normal distribution predicts. Implied volatility rationally prices in those rare extreme events, while backward-looking realised volatility systematically undercounts them because most windows simply do not contain a crash.
Then there is market microstructure. Dealer short-gamma positioning and 0DTE (zero-days-to-expiration) order flow can amplify implied volatility independently of what SPY is actually doing, as market makers hedge in the direction of the trend.
There is also a behavioural fear component that shows up most clearly in calm markets. The 2026 environment has been relatively quiet, yet it produced one of the widest gaps on record, which points to implied volatility carrying a premium for anxiety even when recent price action has been placid.
Because at least three separate mechanisms feed the gap, it is unlikely to be fully arbitraged away. But that same multiplicity means no single framework can tell you exactly when the gap will be widest, and you should apply appropriate scepticism to anyone claiming otherwise.
VIX futures contango introduces a separate but related structural drag: the futures curve sits in contango roughly 80% of the time, meaning long-volatility exchange-traded products continuously absorb negative roll yield as they roll into more expensive contracts, a cost that mirrors the structural advantage the VRP provides to premium sellers from the other side of the same trade.
When the edge fails: regime shifts, tail events, and what the data does not protect against
Here is where the base rate stops being comforting. Implied volatility is forward-looking and realised volatility is backward-looking, so the historical gap is a base rate, not a promise. Your actual profit or loss depends on future realised volatility over the life of your specific option, and the historical average says nothing about which side of the distribution you will land on.
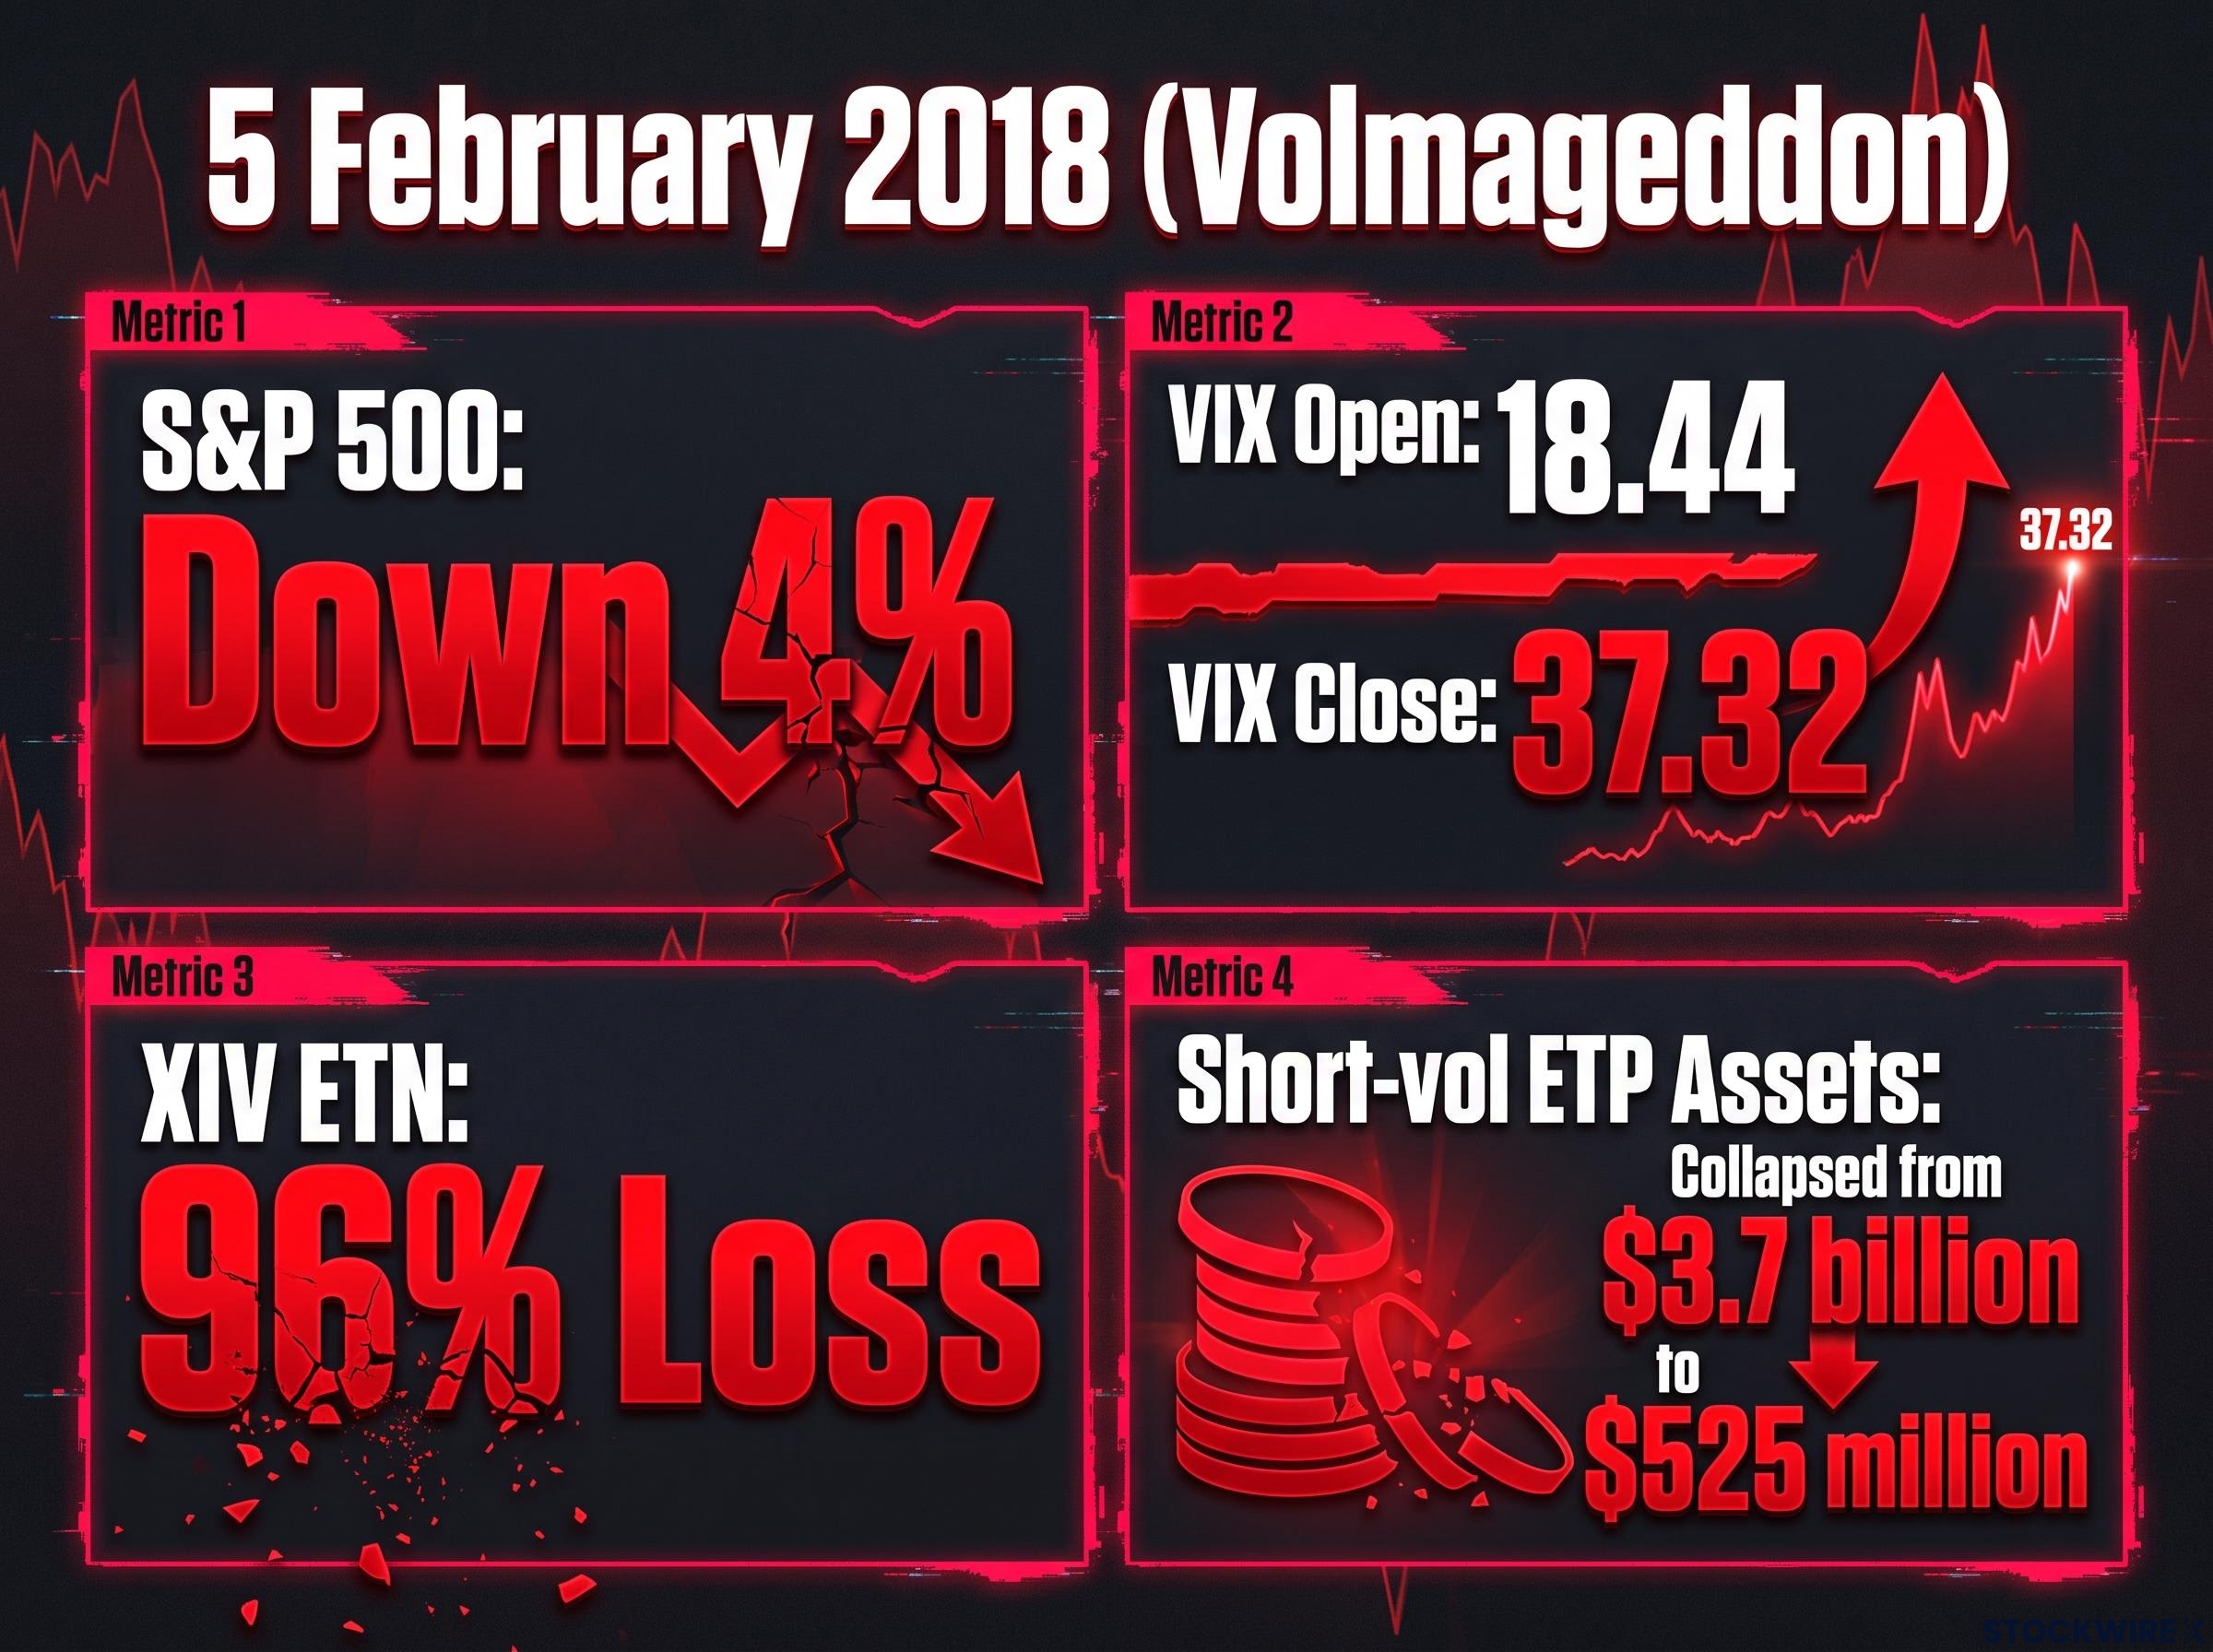
The clearest lesson comes from 5 February 2018, the event traders call Volmageddon. The VIX opened at 18.44 and closed at 37.32 as the S&P 500 fell roughly 4%. That modest equity move was enough to detonate crowded short-volatility positions.
The most visceral illustration of the downside The XIV ETN lost approximately 96% of its value in a single session and was subsequently terminated.
Short-volatility ETP assets collapsed from around $3.7 billion to roughly $525 million as products scrambled to cover. The equity move was small; the volatility move was catastrophic for anyone short it.
March 2020 demonstrated the opposite failure. During the COVID panic, the VIX rocketed to approximately 80 while one-month realised volatility for that period sat near 50. Implied volatility can gap violently ahead of contemporaneous realised volatility, handing sellers enormous mark-to-market losses even in a scenario where the eventual realised move lands below the implied level.
The mechanics of why losses compound
Three interconnected mechanisms explain why these failures are so severe and so asymmetric.
- The forward-versus-backward mismatch: You are selling based on a historical average, but your outcome is decided by future movement you cannot see, so the base rate protects you on frequency, not on any single trade.
- Short-gamma convexity: When you sell volatility, your losses accelerate as SPY moves against you, and that acceleration is worst in the final days before expiration where the “blowup zone” lives.
- Margin and forced liquidation: Positions are marked to market daily, and a severe intraday decline can trigger margin calls that force you to close at the worst possible moment.
The convexity is the part traders underestimate. Artur Sepp has noted regimes where a 7% intraday decline in the S&P 500 produces an 80-100% spike in VIX futures, which is exactly the kind of move that turns a modest equity drop into a portfolio-ending event for a short-volatility book.
Even calmer recent conditions carry this risk. In 2026, Cboe noted the SPX one-month implied-realised spread widening to 3.4%, sitting in the 80th percentile of historical observations, a reminder that abrupt regime shifts are always latent.
The asymmetry is the whole point. Your premium collected is capped at the credit received, while your loss potential in volatility terms is effectively uncapped. The 84-88% base rate is only half the picture; the other half is the 12-16% of periods where the gap reverses with compounding force, and a single one of those can erase years of collected premium.
Reading the IV-RV gap as a practitioner, not a data point
By now the shift you need to make should be clear: the gap is a conditional edge, not a guaranteed one. The 84% overestimation frequency is a historical base rate. The question that actually matters is whether the current regime suggests the premium is wide or narrow relative to conditions.
Your primary tool for that judgement is IV Rank (IVR), which measures where current implied volatility sits within its prior-year range. Per the research, an IVR above 30 signals elevated premium relative to the past year, while an IVR below 30 signals compressed premium where the gap is likely narrower.
That context is not academic right now. As of early September 2026, SPY’s IVR sat at just 8, with 30-day implied volatility around 11.0-11.5%. This is a low-premium environment, near the bottom of the historical range.
Hold that against the 88% overestimation rate for 2026 year-to-date and you get a genuine tension. The market is overestimating future movement more often than ever, yet the absolute compensation per contract is compressed. Frequency and size are pulling in opposite directions, which is exactly the situation where blindly applying the base rate gets traders hurt.
Before acting on the gap, work through four questions:
- Is IV Rank high or low relative to the prior year? At IVR 8, you are near the low end.
- Is the current environment calm or stressed? Calm markets widen the gap but also carry the risk of abrupt regime shifts, as the 80th-percentile Cboe spread reading warns.
- Is the absolute premium wide enough to justify the tail risk you are accepting?
- What is your position size relative to your maximum drawdown tolerance?
VIX seasonality adds a temporal dimension to regime monitoring: three independent datasets spanning 27 to 34 years converge on late August through early October as the period of historically largest average monthly implied volatility increases, meaning the current IVR-8 reading arrives precisely at the seasonal window most associated with abrupt regime shifts.
The IVR-8 environment tells you that while the structural premium is probably still positive, the compensation available per contract is near its historical floor. That has a direct implication: it argues for smaller position sizing, not larger, precisely because the payoff for the risk is thin. The historical gap does not directly predict your P&L, so regime context is the filter and position sizing is the one variable you fully control.
The volatility premium in context: a durable edge with a non-negotiable cost
Pull the decade together and the finding is precise. The IV-RV gap in SPY is structurally persistent, documented across multiple datasets and horizons, anchored by a 84% base rate and a 3.18 average volatility-point premium, and attributable to identifiable mechanisms rather than noise.
What the data does not resolve is just as important. It cannot tell you whether the gap will hold in any specific future period, whether the current IVR-8 environment with its compressed absolute premium is an attractive entry point, or whether you personally have the risk management infrastructure to survive a Volmageddon or a March 2020.
The 2026 picture, an 88% frequency alongside an IVR of 8, shows how the odds of overestimation and the size of the reward can diverge at the same moment. And the 2018 and 2020 cases are permanent reminders that the 12-16% failure rate is not spread evenly across time; it clusters in regime shifts where losses are catastrophic.
The structural edge is real and documented, but it is only accessible to those who can absorb the episodic, asymmetric losses that are the premium’s cost of entry.
The practitioners who have captured this premium durably treated position sizing and regime monitoring as the primary task, not the premium itself. That is the honest synthesis: a real edge, historically consistent, with a cost of entry you do not get to negotiate.
This article is for informational purposes only and should not be considered financial advice. Investors should conduct their own research and consult with financial professionals before making investment decisions. Past performance does not guarantee future results. Financial projections are subject to market conditions and various risk factors.