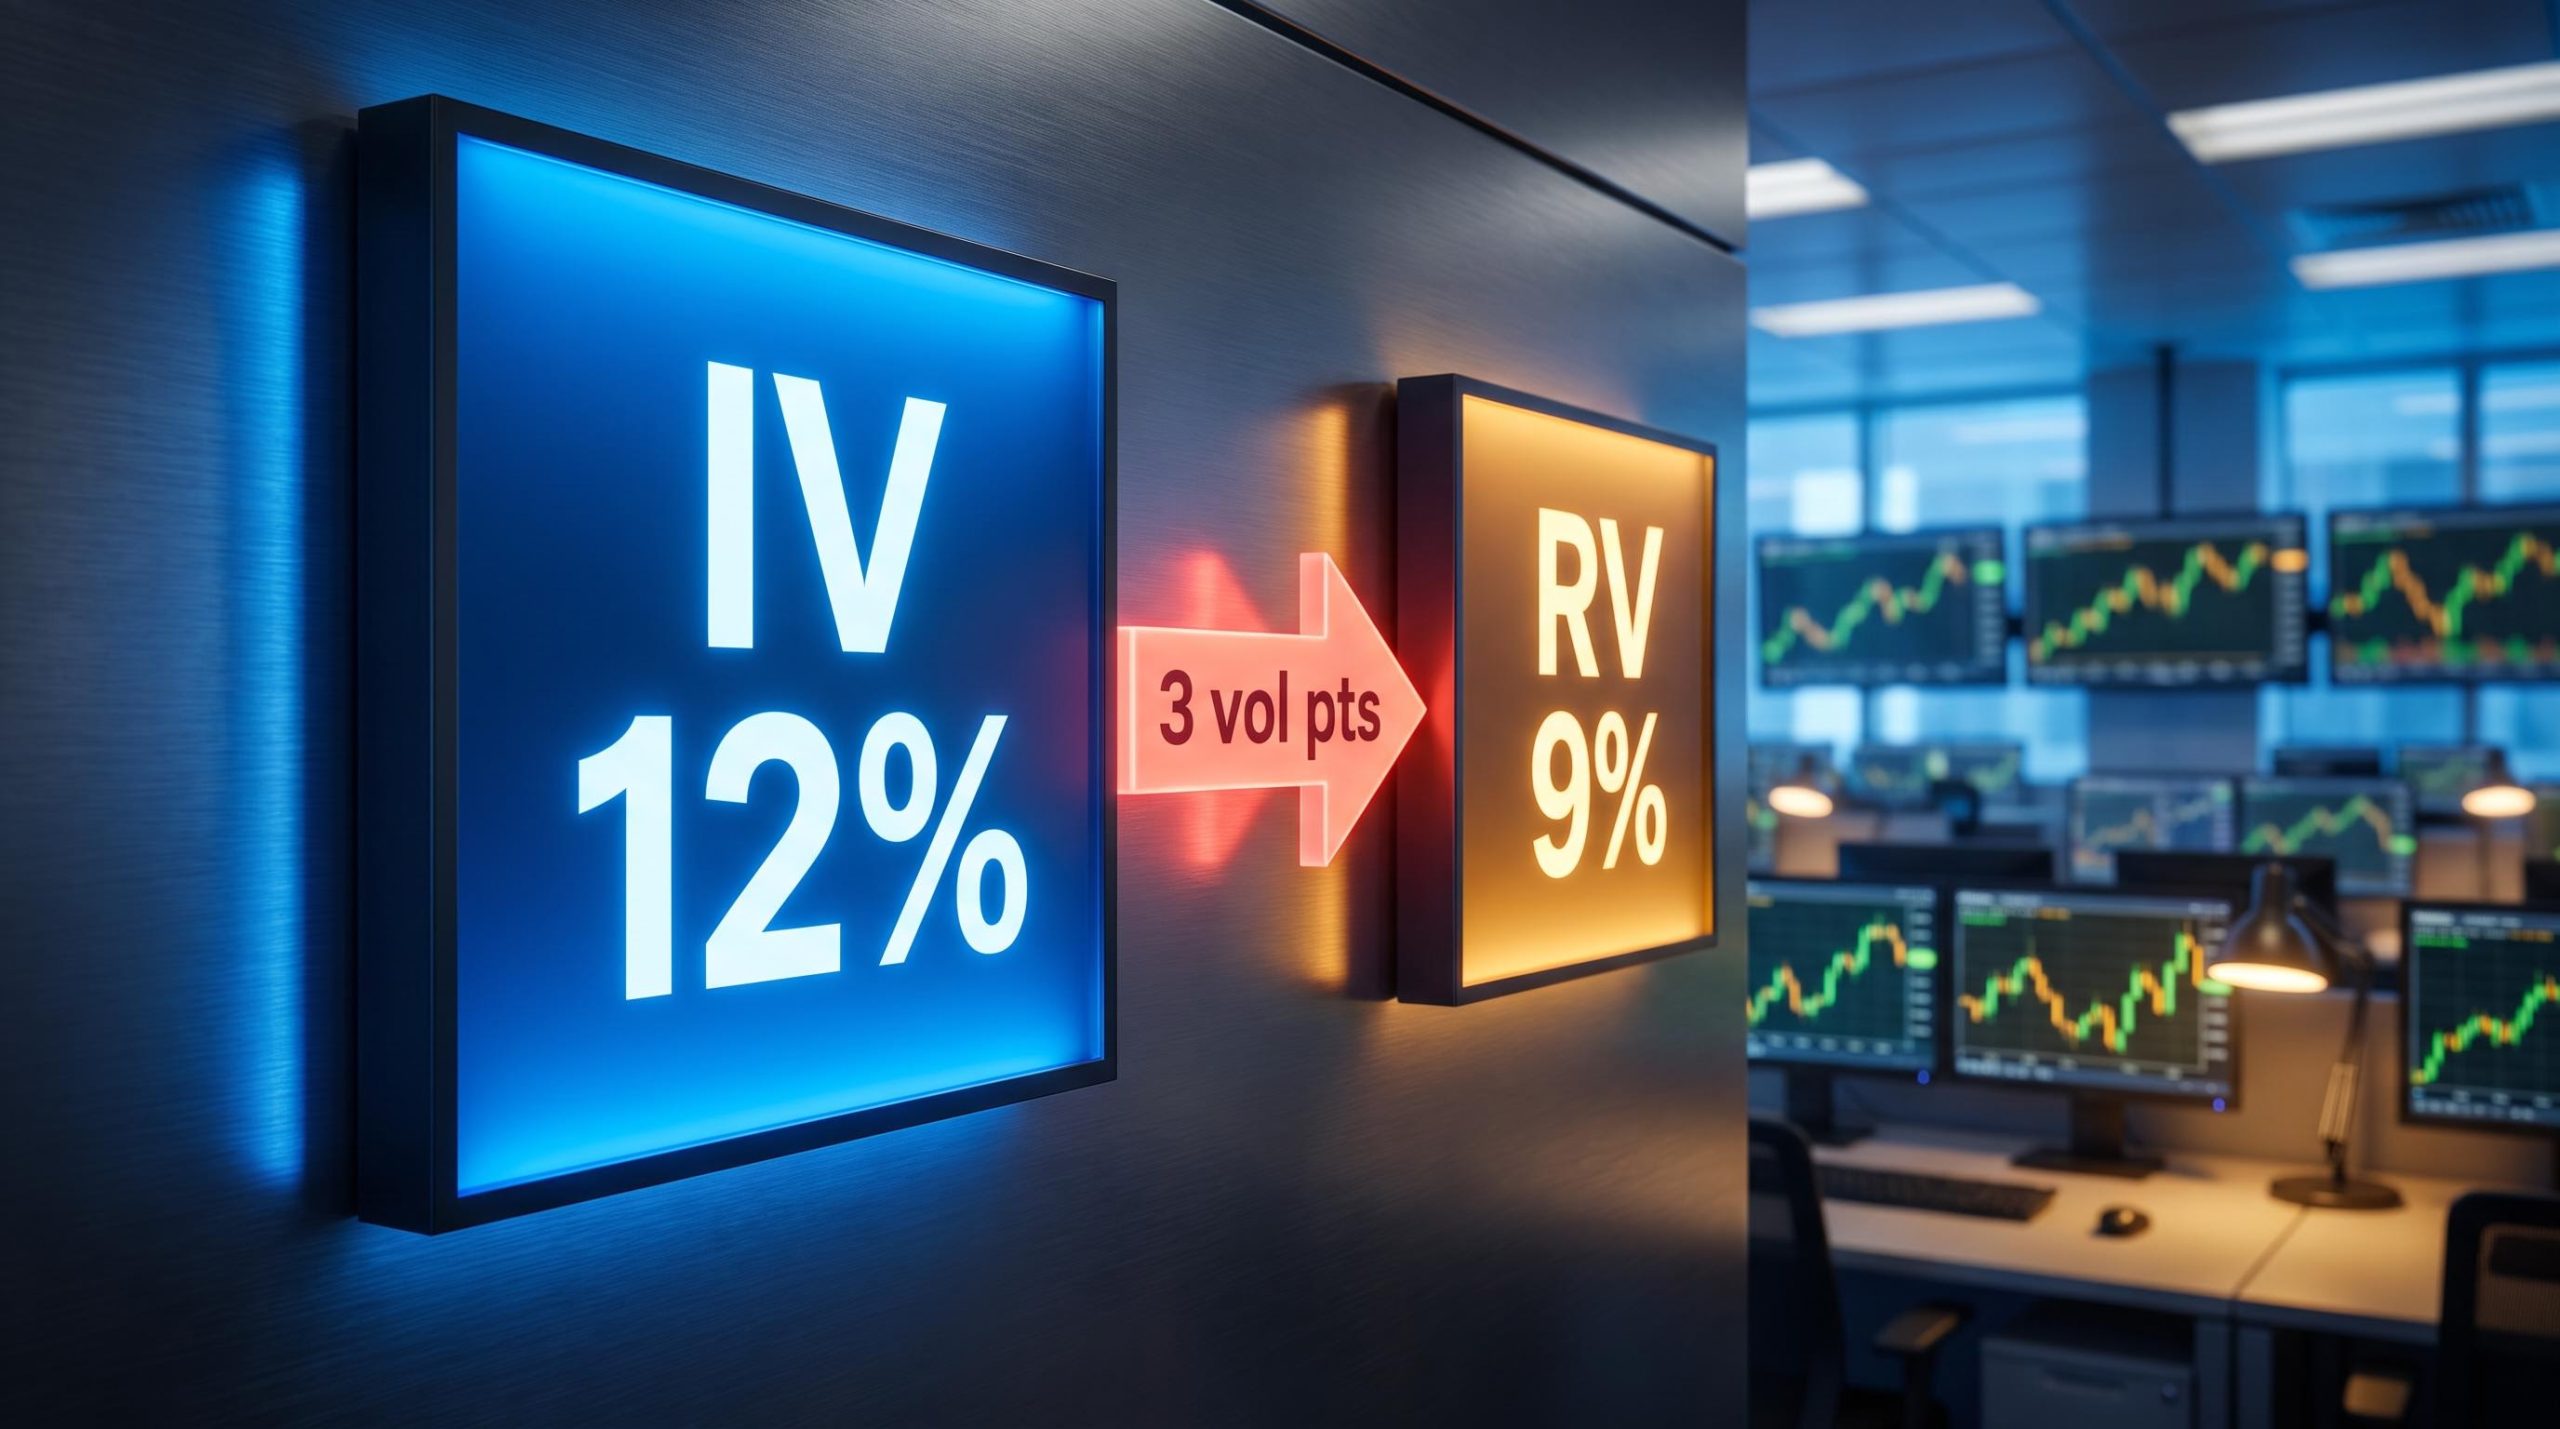
Selling options gets sold to you as landlord economics. Collect the premium, wait for it to decay, repeat next month. The pitch is that you are earning rent on assets other people are desperate to insure, and most of the time the rent shows up.
Here is the part the pitch skips. In September 2026, the VIX, Wall Street’s fear gauge that measures expected market swings, sits near 14, averaging 14.51 in August. Calm readings like these make premium harvesting look almost passive, which is exactly when the underlying danger is largest.
That gap between how safe this feels and what you are actually underwriting is the whole story. This explainer decodes the mechanics you need to survive the tail risk events that repeatedly erase unprepared premium sellers, shifting your attention away from chasing yield and toward managing the catastrophic exposure you have quietly taken on. The premium selling risk you cannot see on a quiet day is the one that ends accounts.
Understanding the structural edge
There is a genuine reason smart traders sell volatility, and it is worth respecting before you learn to fear it. Implied volatility, the market’s forecast of how much prices will move, tends to run higher than the volatility that actually shows up. That persistent overestimation is the volatility risk premium, and it is real.
Implied volatility is extracted by reverse-engineering the Black-Scholes model from live market prices rather than from historical data, making it a real-time measure of what the collective market expects about future price movement magnitude, not what actually happened.
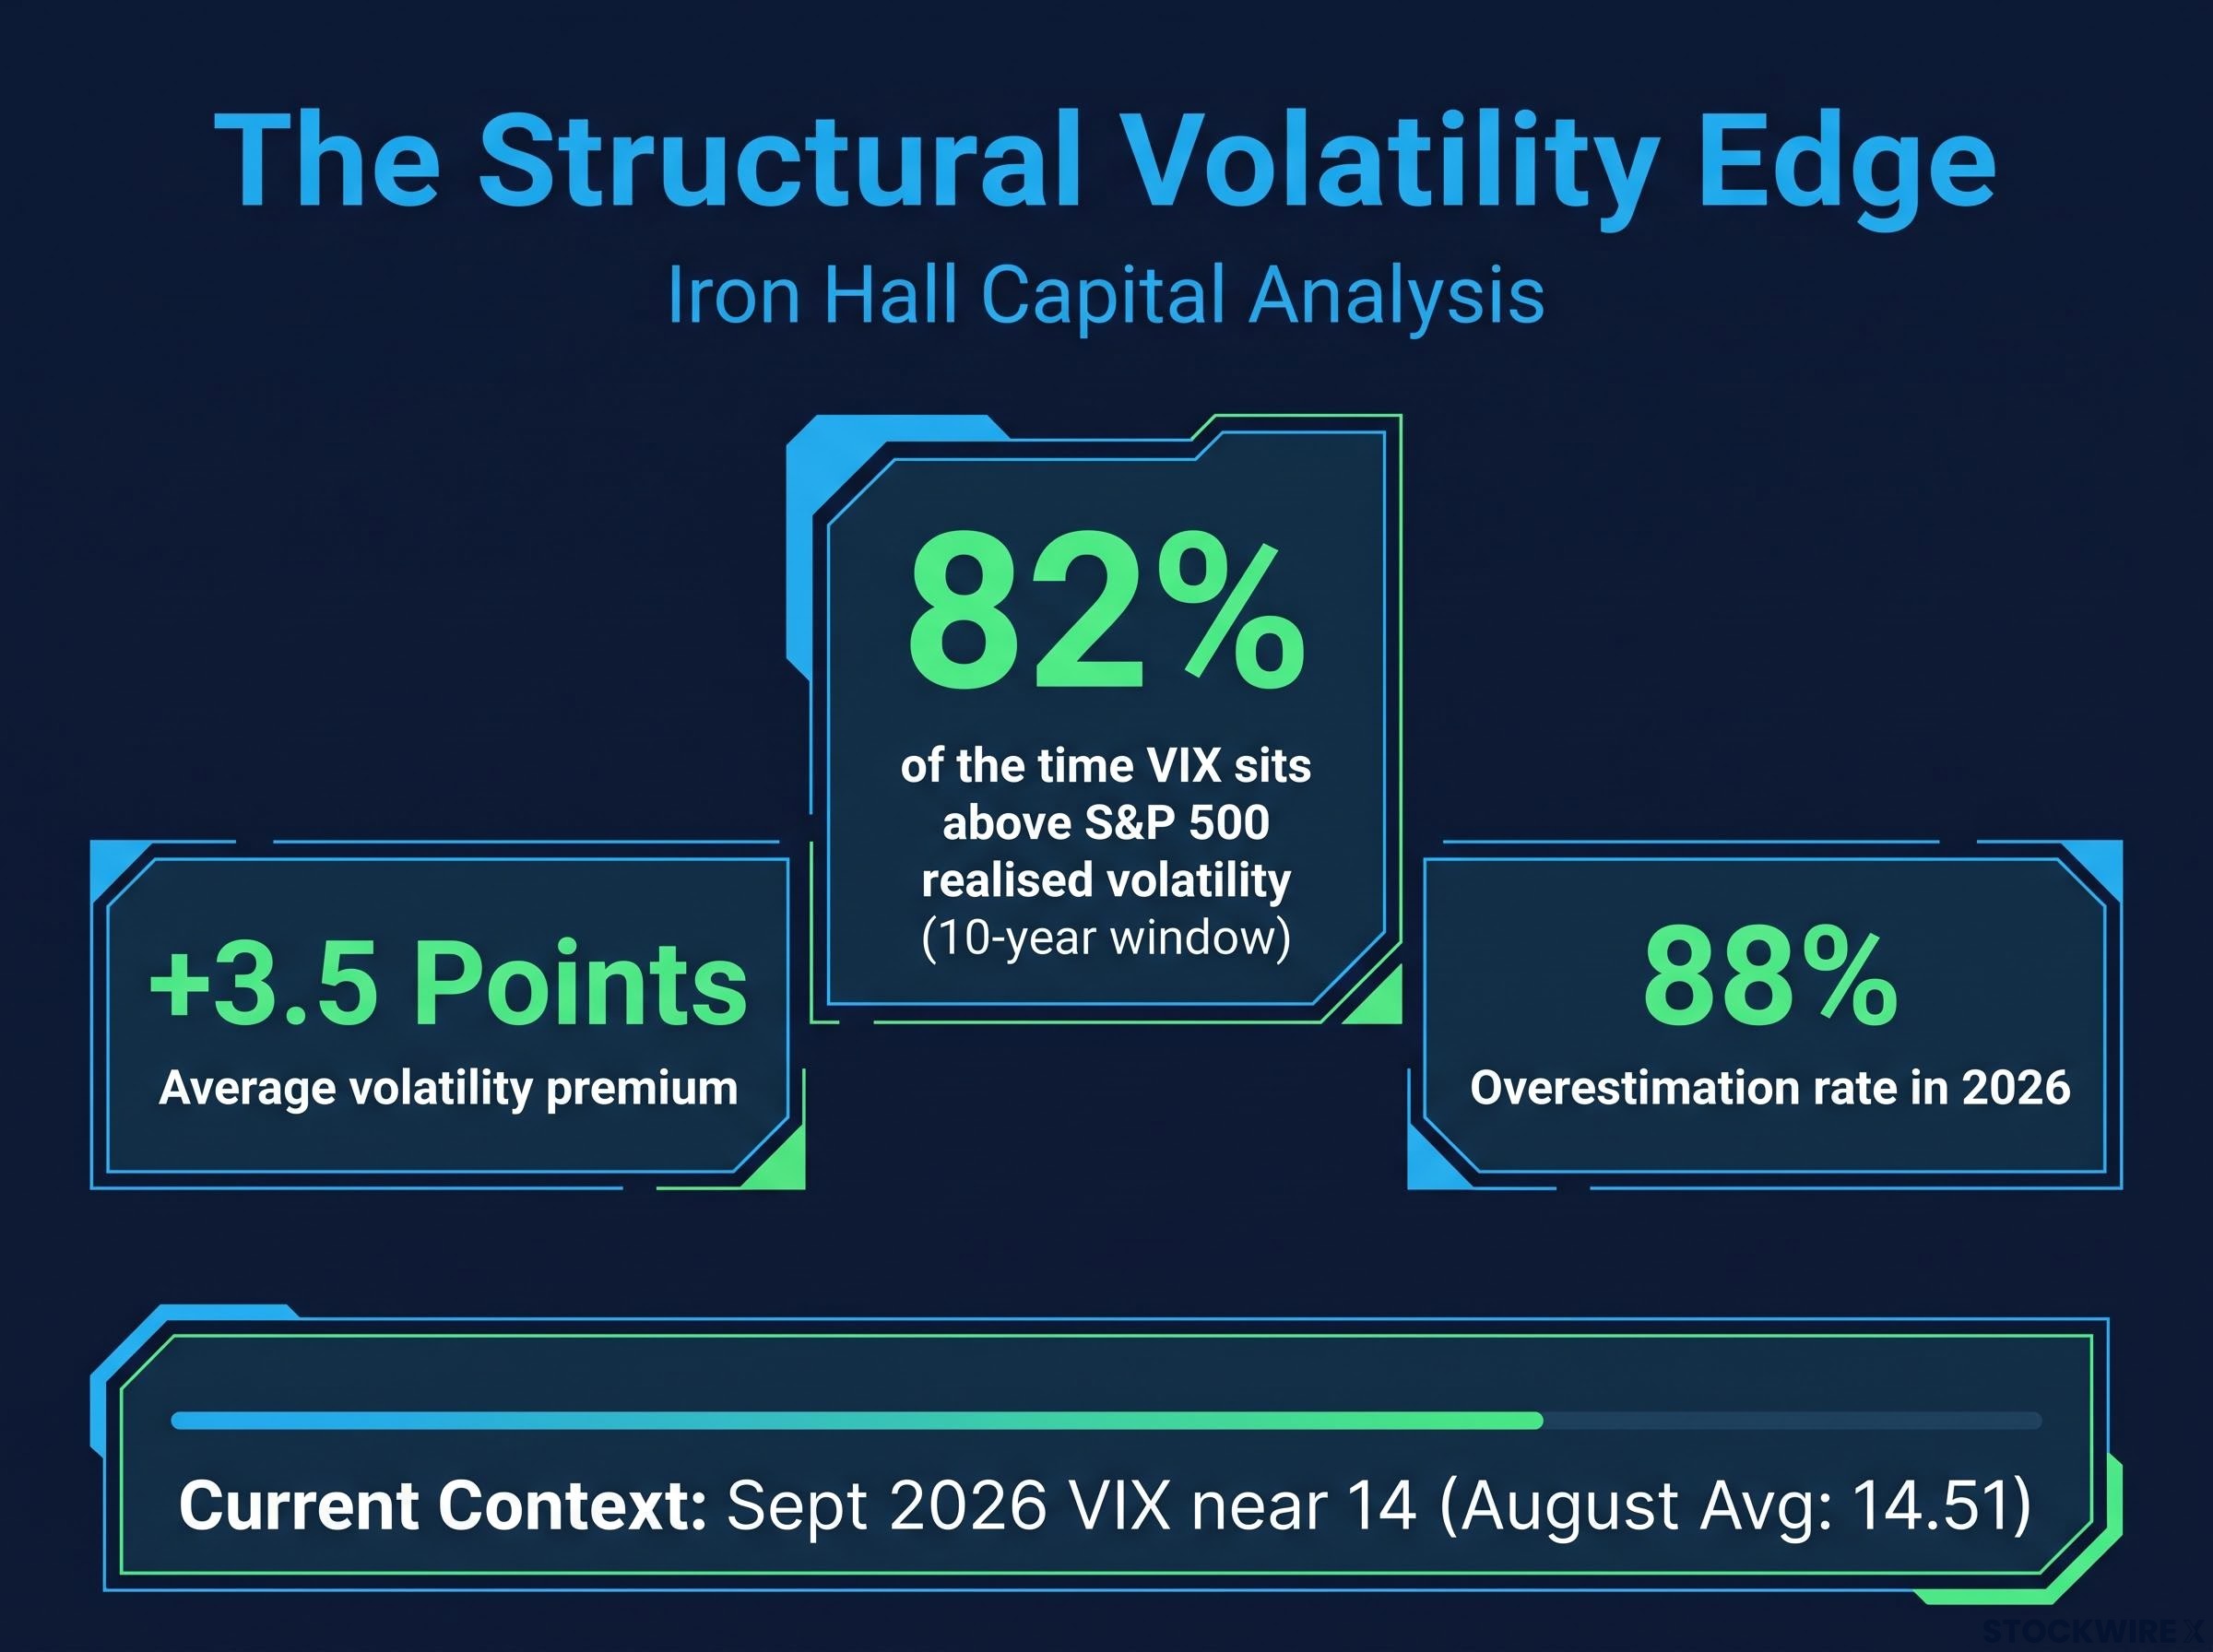
According to analysis from Iron Hall Capital, the VIX has sat above the S&P 500’s realised volatility roughly 82% of the time over a ten-year window, exceeding it by an average of 3.5 volatility points. In 2026, that overestimation rate reached approximately 88% of trading days. Sell into that gap consistently and the odds structurally favour you.
Here is how the two measures differ:
- Implied volatility: forward-looking, priced into options, reflects what buyers will pay to insure against future moves, and tends to carry a fear premium.
- Realised volatility: backward-looking, measures what prices actually did, and most of the time comes in below what was implied.
Now the pivot. You are not being paid because you found a market inefficiency nobody else noticed. You are being paid an insurance premium, precisely because you have agreed to absorb the catastrophic tail risk that large institutions want off their books.
That reframing matters more than any yield calculation. When you treat your premium income as disaster insurance compensation rather than free money, you size positions differently and you measure your true exposure honestly. The edge is real on ordinary days. The bill comes on the extraordinary ones, and it arrives all at once.
When big ASX news breaks, our subscribers know first
How tail events trigger structural market failure
The trouble is that the same market plumbing that keeps your positions calm on a normal day can reverse and turn against you in minutes. It is worth walking through exactly how, because the failure is mechanical, not random.
It starts with dealer positioning, specifically two forces called gamma and vanna. Gamma describes how a dealer’s hedging need changes as prices move; vanna describes how it changes as volatility moves. In a positive gamma regime, dealer hedging dampens price swings and quietly stabilises the market.
Dealer gamma hedging is further complicated by a structural decoupling that has intensified in 2026: roughly $200 billion in annual structured product issuance leaves dealers long approximately $80 billion in gross SPX gamma, mechanically pinning the index and suppressing the VIX regardless of what individual stocks are doing.
When a large enough shock pushes out-of-the-money options into the money, that positioning flips negative. Now dealers are forced to sell into declines and buy into rallies, becoming an accelerant rather than a brake.
Here is the sequential cascade that follows:
- A price shock pushes prices past a structural level, moving previously safe options toward the strike.
- Dealer gamma flips from positive to negative, forcing hedging in the same direction as the move.
- Vanna kicks in as rising volatility shifts option deltas, forcing yet more dealer selling.
- Volatility-control and risk-parity strategies mechanically dump equity exposure in response to higher trailing volatility.
- Dealers become liquidity takers, not providers, and the bids you need to exit simply vanish.
This is the moment that matters for you. The dealer hedging that normally cushions your trades reverses, meaning the liquidity you need to close your short position evaporates at the exact instant your margin requirements explode.
The scale of this overhang is not small.
Research from Alpha Architect estimated implicit and explicit short-volatility exposure across markets at roughly $1.5 trillion, warning that if major players are forced to pull liquidity at once, the system itself could destabilise.
Regulators have noticed. The European Securities and Markets Authority (ESMA) issued a risk update on 9 September 2025 flagging high or very high risks and urging vigilance around sharp corrections. The U.S. Commodity Futures Trading Commission (CFTC) reminded exchanges and clearing houses on 22 May 2025 of their duty to manage volatility controls and prevent exactly these feedback loops.
ESMA’s September 2025 risk update explicitly flagged high or very high risks across markets under its remit, warning that retail and institutional investors should remain alert to potential sharp corrections and the liquidity strains they could entail, a formal regulatory signal that the short-volatility feedback loops described above were live concerns.
Understanding this plumbing proves something uncomfortable: black swan losses are not bad luck, they are a structural feature built into the derivatives ecosystem.
The margin call multiplier
Brokers make this worse, not better. During a cascade, they aggressively raise margin requirements as volatility spikes, demanding more collateral precisely when your positions are underwater.
That collateral demand forces you to liquidate at the single worst possible moment, locking in losses at prices distorted by the same cascade. The margin call does not just accompany the disaster; it multiplies it.
Why relying on IV Rank creates false confidence
Most premium sellers lean on one number to decide when to sell: IV Rank. It normalises current implied volatility against its 52-week high and low, and it feels like an objective read on whether options are expensive. The problem is that it can quietly lie to you.
A single outsized spike inside the measurement window skews the entire scale. One violent day compresses everything else, so IV Rank can read low even when absolute volatility is far from calm, or stay pinned high long after conditions have normalised.
The recent record shows how distorting this is. The VIX spiked to 46.98 on 7 April 2025, a roughly 118% three-day surge, then peaked again near 27.8 in November 2025. Across 2026, the VIX ranged only between 14.18 and 35.30, meaning those earlier spikes warp the reference range for every calm reading that followed.
VIX seasonality reinforces the concern: three independent studies spanning 27-34 years of data converge on the late-August to early-October window as the period of highest average implied volatility increases, with September recording the single largest average monthly VIX rise at +6.29% in the SeasOptima dataset.
Firms including VolRadar and Bajaj Finserv note that the standard 252-day lookback creates a structural blind spot: a name that spikes once can show a 100% rank for months, even after implied volatility has partly settled. There is also a duration problem, where short-dated cycles price proportionally richer than longer-dated ones, something IV Rank alone cannot isolate.
The read you should take is direct. A single spike in the trailing twelve months can severely distort your IV Rank, which means you might be aggressively selling premium into a far riskier environment than your screen suggests.
The fix is to stop trusting one metric and build convergence across several:
| Metric | What it measures | Why it complements IV Rank |
|---|---|---|
| IV Percentile | Percentage of days IV was lower than today’s reading | Shows frequency, not just range, so a single outlier does not dominate |
| Realised Volatility baseline | What prices actually did recently | Grounds implied expectations against real movement |
| Volatility Risk Premium spread | Direct gap between implied and realised volatility | Tells you whether the edge you are selling is genuinely present |
The historical reality of leverage and wipeouts
Mechanics and metrics are abstract until you see what they cost real money. The history of short volatility is not a series of freak accidents; it is a recurring pattern of the same trade blowing up the same way.
Start with the event traders still call Volmageddon. Through years of low volatility, inverse VIX exchange-traded products became popular income vehicles, with Credit Suisse’s XIV rising from about $10 to $144 between 2010 and early 2018.
On 5 February 2018, a more than 100% one-day jump in the VIX forced these products to buy back futures into a surging market, creating a reflexive feedback loop that drove prices higher still. XIV’s net asset value collapsed from $115.55 to $4.22 in a single session, a 96.3% loss that triggered an acceleration clause and effectively wiped the product out. ProShares’ SVXY lost 91% the same day.
That was not a one-off. During the March 2020 crash, the volatility risk premium inverted sharply, reaching approximately negative 20 volatility points, a level where virtually every short-volatility position loses money at once.
From 2018 to 2024
The pattern kept repeating. On 5 August 2024, a market rout paired with a VIX surge caught heavily used short-volatility strategies flat-footed, and investors across ten major short-volatility ETFs watched roughly $4.1 billion in paper gains evaporate from earlier peaks.
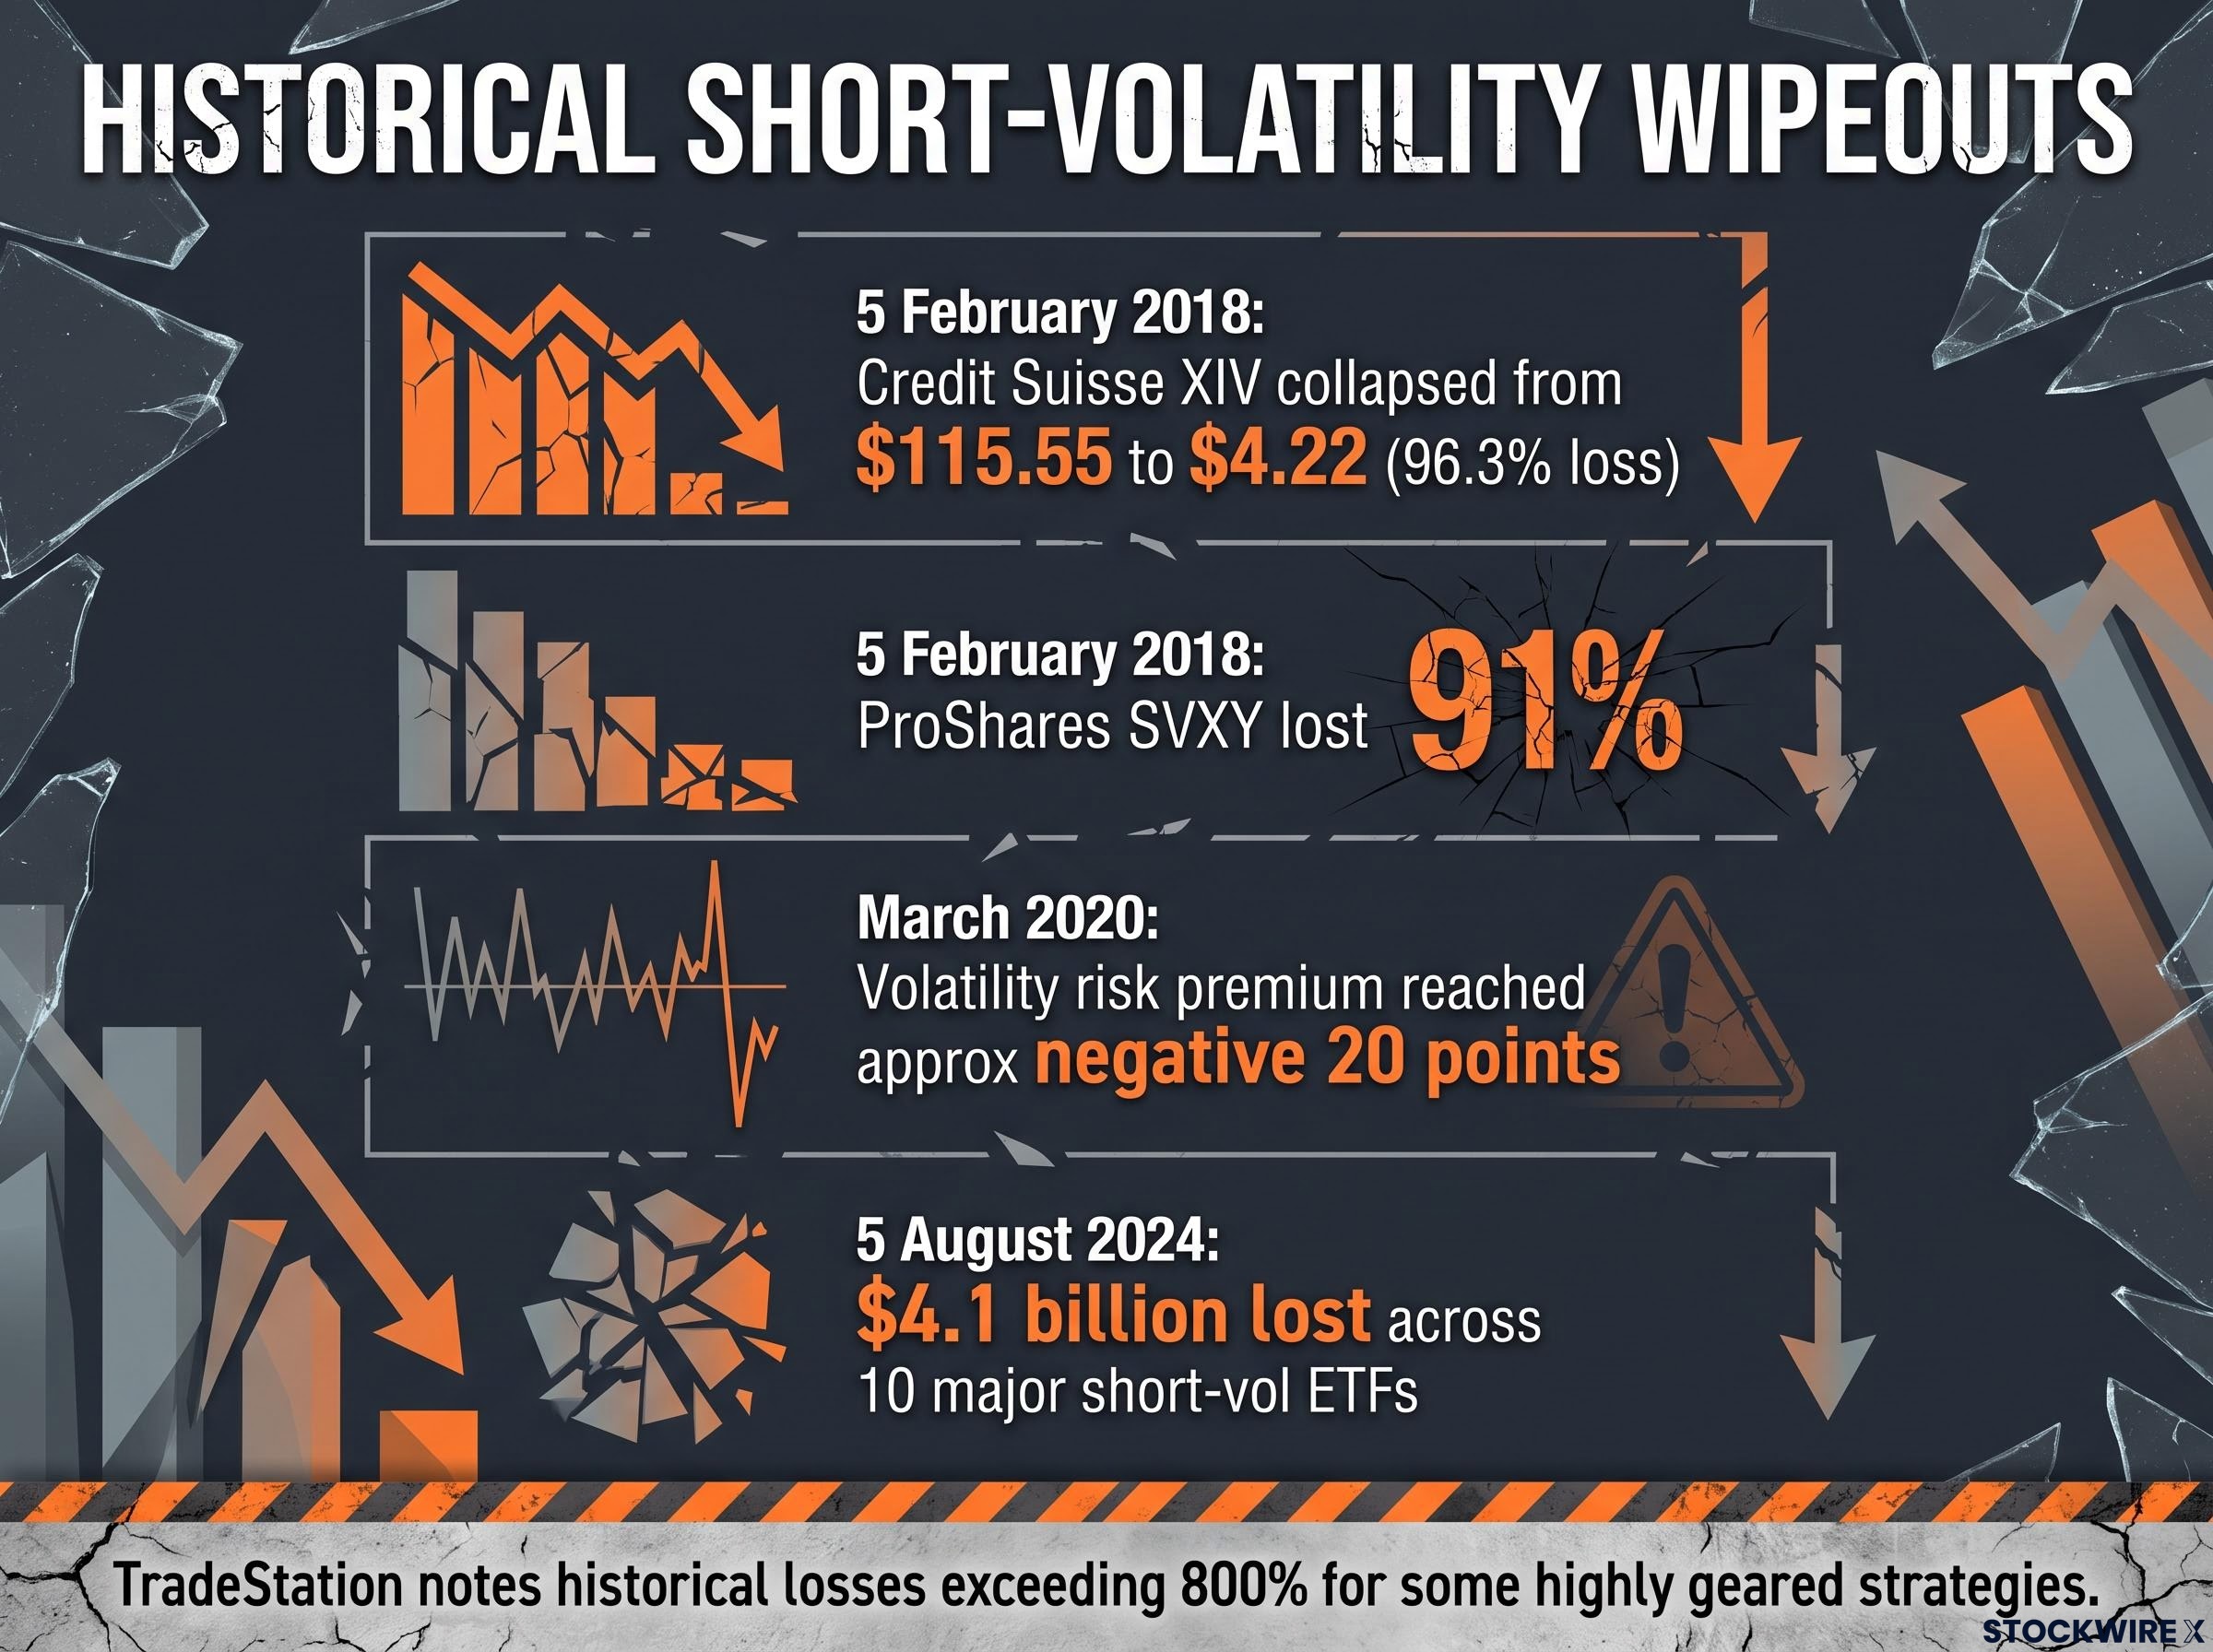
The common thread is leverage. TradeStation notes some highly geared volatility-selling strategies have historically posted losses exceeding 800% once leverage and compounding turn a routine gap into a total wipeout.
Seeing multi-billion dollar institutional products collapse this fast tells you why stacking leverage onto short options in a retail account is mathematically destined to fail eventually. These drawdowns are your realistic worst-case benchmark for stress-testing your own allocation.
The illusion of periodic hedging
Many of the 2024 casualties shared one flaw: they only hedged intermittently. A hedge you put on some of the time is no hedge at all when the gap arrives overnight, between your protective windows.
An unhedged short volatility position carries effectively infinite tail risk. There is no natural ceiling on how far the loss can run, which is the single most important number a premium seller can ignore.
Navigating the tail risk without abandoning the strategy
None of this means premium selling is broken. It means the strategy only works when you treat the tail risk as the main event rather than a footnote.
Two rules do most of the work. Size every position by its maximum potential loss, not by the margin your broker happens to require, because margin can vanish and losses cannot. And stop trading on a single high IV Rank reading; require converging signals across IV Percentile, skew, and the volatility risk premium spread before you commit.
Late 2026 is a genuinely fragile derivatives environment, with roughly $1.5 trillion in short-volatility exposure and regulators from ESMA to the CFTC flagging feedback-loop risk. The calm VIX near 14 is not reassurance; it is the setup. Sell premium if the edge is real, but do it knowing precisely what you are insuring and exactly how much a bad day can take.
VIX compression at record highs follows a documented structural pattern: on S&P 500 all-time high close days, options imply a 0.92% daily move while the market delivers just 0.33%, a 2.8x implied-to-realised ratio that is double the long-run average and that has held across three distinct market eras from 2012 through 2026.
This article is for informational purposes only and should not be considered financial advice. Investors should conduct their own research and consult with financial professionals before making investment decisions.
Past performance does not guarantee future results. Financial projections are subject to market conditions and various risk factors.