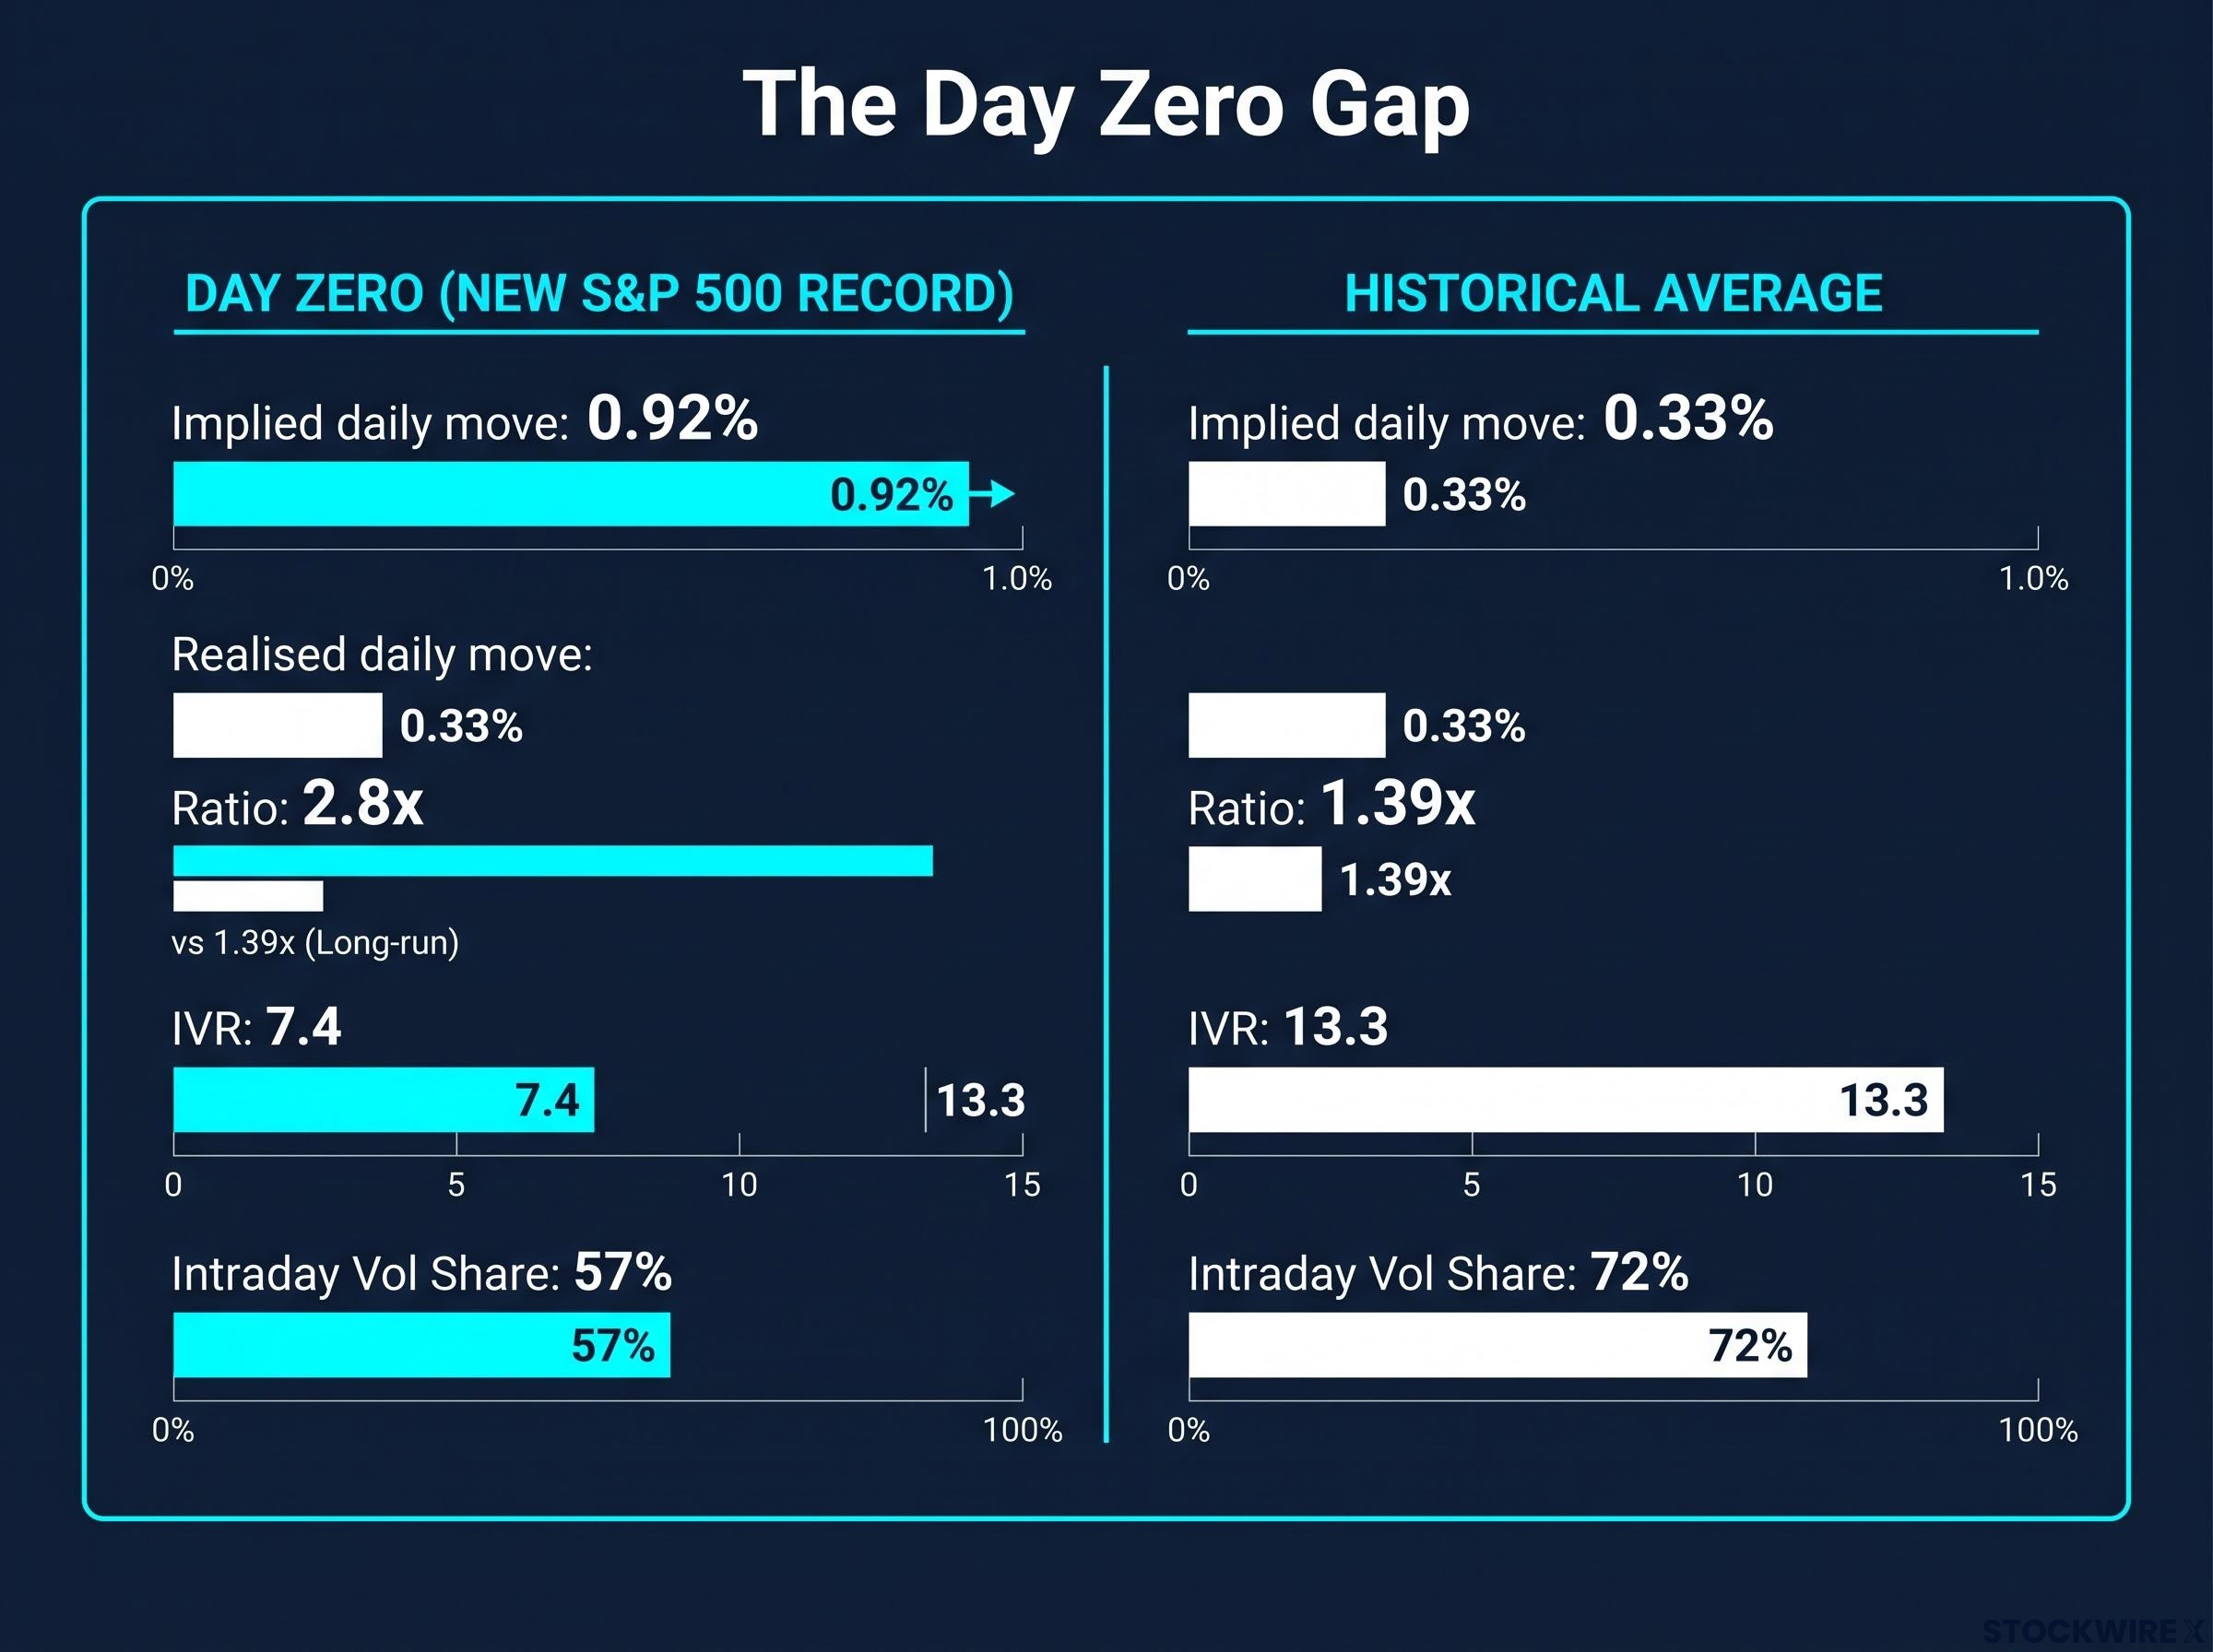
On the day the S&P 500 sets a new all-time high, options markets imply a daily move of roughly 0.92%. The market actually delivers about 0.33%. That 2.8x gap is not a market inefficiency you can simply pocket, it is a structural feature of how volatility behaves at record closes, and it reverses in ways that matter enormously if you hold a position past the day the record is set.
The S&P 500 has closed at fresh records 27 times in 2026, most recently at 7,798.99 on 13 August 2026. Each of those sessions arrived with the Cboe Volatility Index (VIX), Wall Street’s gauge of expected market swings, sitting in the mid-teens, intraday price ranges that were narrower than usual, and implied volatility readings near the floor of their historical range. That combination is not coincidence.
Here is the framework for understanding why volatility compresses at all-time highs, what drives the gap between what options imply and what markets actually deliver, and where the real tail risk sits once the calendar flips to day one. If you trade options or manage risk around record-high environments, this is the anatomy of the calm you keep seeing on the tape.
What the data actually shows: price ranges and IVR on day zero
Start with the price action itself. Under normal conditions, the open-to-close move accounts for roughly 72% of a session’s total daily historical volatility. The rest happens overnight.
On day zero, the session when a new record is set, that intraday share drops to just 57%, according to analysis by Kai using one-minute intraday S&P data. Overnight volatility picks up the remaining 43%.
In plain terms: the trading range on record-close days is mechanically tighter than usual. The market grinds to its new high rather than lurching there.
Now look at what options were pricing. Implied volatility rank (IVR), a measure of where current implied volatility sits within its own recent range from 0 to 100, falls to roughly 7.4 on day zero. Its long-run average is about 13.3. That is options traders pricing near the very bottom of their historical expectations.
Implied volatility rank (IVR) measures where current implied volatility sits within its own recent range, and the same framework that makes it a useful strategy filter in normal conditions is precisely what makes its floor-level reading on day zero so striking.
The Cboe VIX methodology converts near-term S&P 500 option prices into a single annualised volatility expectation, which is then scaled to a one-day implied move, making the VIX the direct input behind the 0.92% figure quoted at every record-close session examined here.
Here is what makes this unusual. Both signals compress at the same time. It is not a case of quiet price action while options stay expensive, or expensive options while prices whip around. On day zero, realised movement and implied movement fall in tandem.
| Metric | Day Zero | Long-Run Average |
|---|---|---|
| SPX IVR | ~7.4 | ~13.3 |
| VIX-implied daily move | ~0.92% | — |
| Realised daily move | ~0.33% | — |
| Implied-to-realised ratio | ~2.8x | ~1.39x |
| Intraday vol share | 57% | 72% |
The day-zero gap Options imply a 0.92% move. The market delivers 0.33%. That is a 2.8x implied-to-realised ratio, double the long-run 1.39x.
What this tells you is that the market on a record-close day is not merely quiet. It is pricing in a continuation of that quiet, and that expectation creates a specific, measurable gap between what options sellers collect and what they actually pay out.
When big ASX news breaks, our subscribers know first
Why this happens: the structural forces compressing volatility at record closes
A single tidy explanation would be convenient. The reality is that three separate mechanisms converge, and they stack in increasing order of subtlety.
- The selection effect: A session only counts as day zero if it closes at a 52-week high, which mechanically strips out every large sell-off and builds a floor under the data.
- The low-vol bull regime: Persistent grinding uptrends produce small daily moves, compressing realised volatility even as the index sets records.
- Dealer gamma exposure: Options dealers positioned to buy weakness and sell strength act as a mechanical brake on intraday swings.
The first is the least obvious and the most important. The day-zero dataset is built to include only sessions that close at a new high, which means every panic day, every gap-down, every ugly reversal is excluded by construction. That is not a flaw in the research. It is the entire point, and it explains why the day-zero numbers look so clean. The filter vanishes the moment the market opens on day one.
The second mechanism has a name and a date. Saxo Bank’s Options Brief documented the session of 2 June 2026, when the S&P 500 closed at a then-record 7,599.96, up 0.26%. VIX sat around 16.1, 20-day realised volatility was roughly 9.8%, and the index traded more than 7% above its 50-day moving average. Saxo labelled it a “low vol bull” regime.
That is a market grinding higher on small steps, which is exactly the condition that keeps realised volatility pinned. CNBC captured the same dynamic in a piece describing a “record-breaking week for options” that powered the S&P 500 higher while VIX fell to its lowest level since January.
How dealer gamma positioning dampens intraday ranges
Dealers who are long gamma from index options hedge in a way that fights the market’s own momentum. When prices rise, they sell; when prices fall, they buy. Gamma here simply refers to how quickly a dealer’s hedging need changes as the index moves.
That hedging behaviour is a mechanical brake on intraday swings. It is strongest when open interest, the number of outstanding options contracts, is concentrated near the current index level, which is common in stable, high-price environments.
Tie it back to the numbers. This gamma-driven suppression of realised movement is one reason the intraday volatility share sinks to 57% on day zero rather than the usual 72%.
Does the pattern hold across different market eras?
A pattern that only shows up in one bull market is a coincidence. A pattern that survives three structurally different periods is worth your attention. Treat the next table as a consistency test.
Consider what made each era distinct. The 2012-2020 period was a long, low-rate expansion. The 2020-2023 window contained a pandemic crash, a historic rally, and an aggressive rate-hiking cycle. The 2023-present era has been defined by large-cap technology leadership and shifting rate expectations. Three genuinely different macro backdrops.
The compression showed up in all of them anyway.
| Era | Realised Move Day Zero | IVR Day Zero | Implied-to-Realised Ratio |
|---|---|---|---|
| 2012-2020 | ~0.33% | 6.5-7.4 | 2.32x to 3.38x |
| 2020-2023 | ~0.33% | 6.5-7.4 | 2.32x to 3.38x |
| 2023-present | ~0.33% | 6.5-7.4 | 2.32x to 3.38x |
The realised move landed near 0.33% in every period, IVR stayed pinned between 6.5 and 7.4, and the implied-to-realised ratio held its wide band, according to Kai analysis.
The strongest cross-era claim In every period examined, the day-zero implied-to-realised ratio exceeded double the long-run 1.39x. Not once did it revert to normal on a record-close day.
The live 2026 expression fits the same mould. The index has notched 27 all-time high closes as of late August, the most recent at 7,798.99 on 13 August 2026. The session immediately after, 14 August, saw VIX fall to 14.25, its lowest close since early January, per Nasdaq Dorsey Wright and KuCoin. VIX stayed below 16 for much of the surrounding stretch.
What this tells you is that the compression is not an artefact of the current low-VIX regime or of any single bull market. It has held across more than a decade of meaningfully different conditions, which is the difference between a quirk you can ignore and a structural feature you should build into your thinking.
Where the risk actually lives: day one, tail risk, and the implied-to-realised gap
So far the picture is comforting. Day zero is calm, the implied-to-realised gap is wide, and short-volatility positions look well fed. Hold that picture for a moment, because the moment the selection filter lifts, it changes.
Recall that a session only qualifies as day zero if it closes at a 52-week high. On day one, that filter is gone. Every sell-off that was mechanically excluded is now back in the sample, and the consequence is direct: the average loss in the worst 5% of sessions rises materially from day zero to day one, per Kai analysis.
VIX seasonality adds another dimension to the day-zero reading: the late-August to early-October window has historically produced the largest average monthly volatility increases in three decades of data, meaning the current cluster of all-time highs is arriving at exactly the point where seasonal forces tend to work against continued calm.
The implied-to-realised gap cuts both ways.
- Tail risk shift: The 52-week-high filter disappears on day one, and worst-case session losses jump as a result.
- VRP inversion risk: The structural premium that pays options sellers can go negative, and history shows it can happen fast.
- Spot Up, VIX Up: Rising volatility alongside record prices signals hedging demand, not calm.
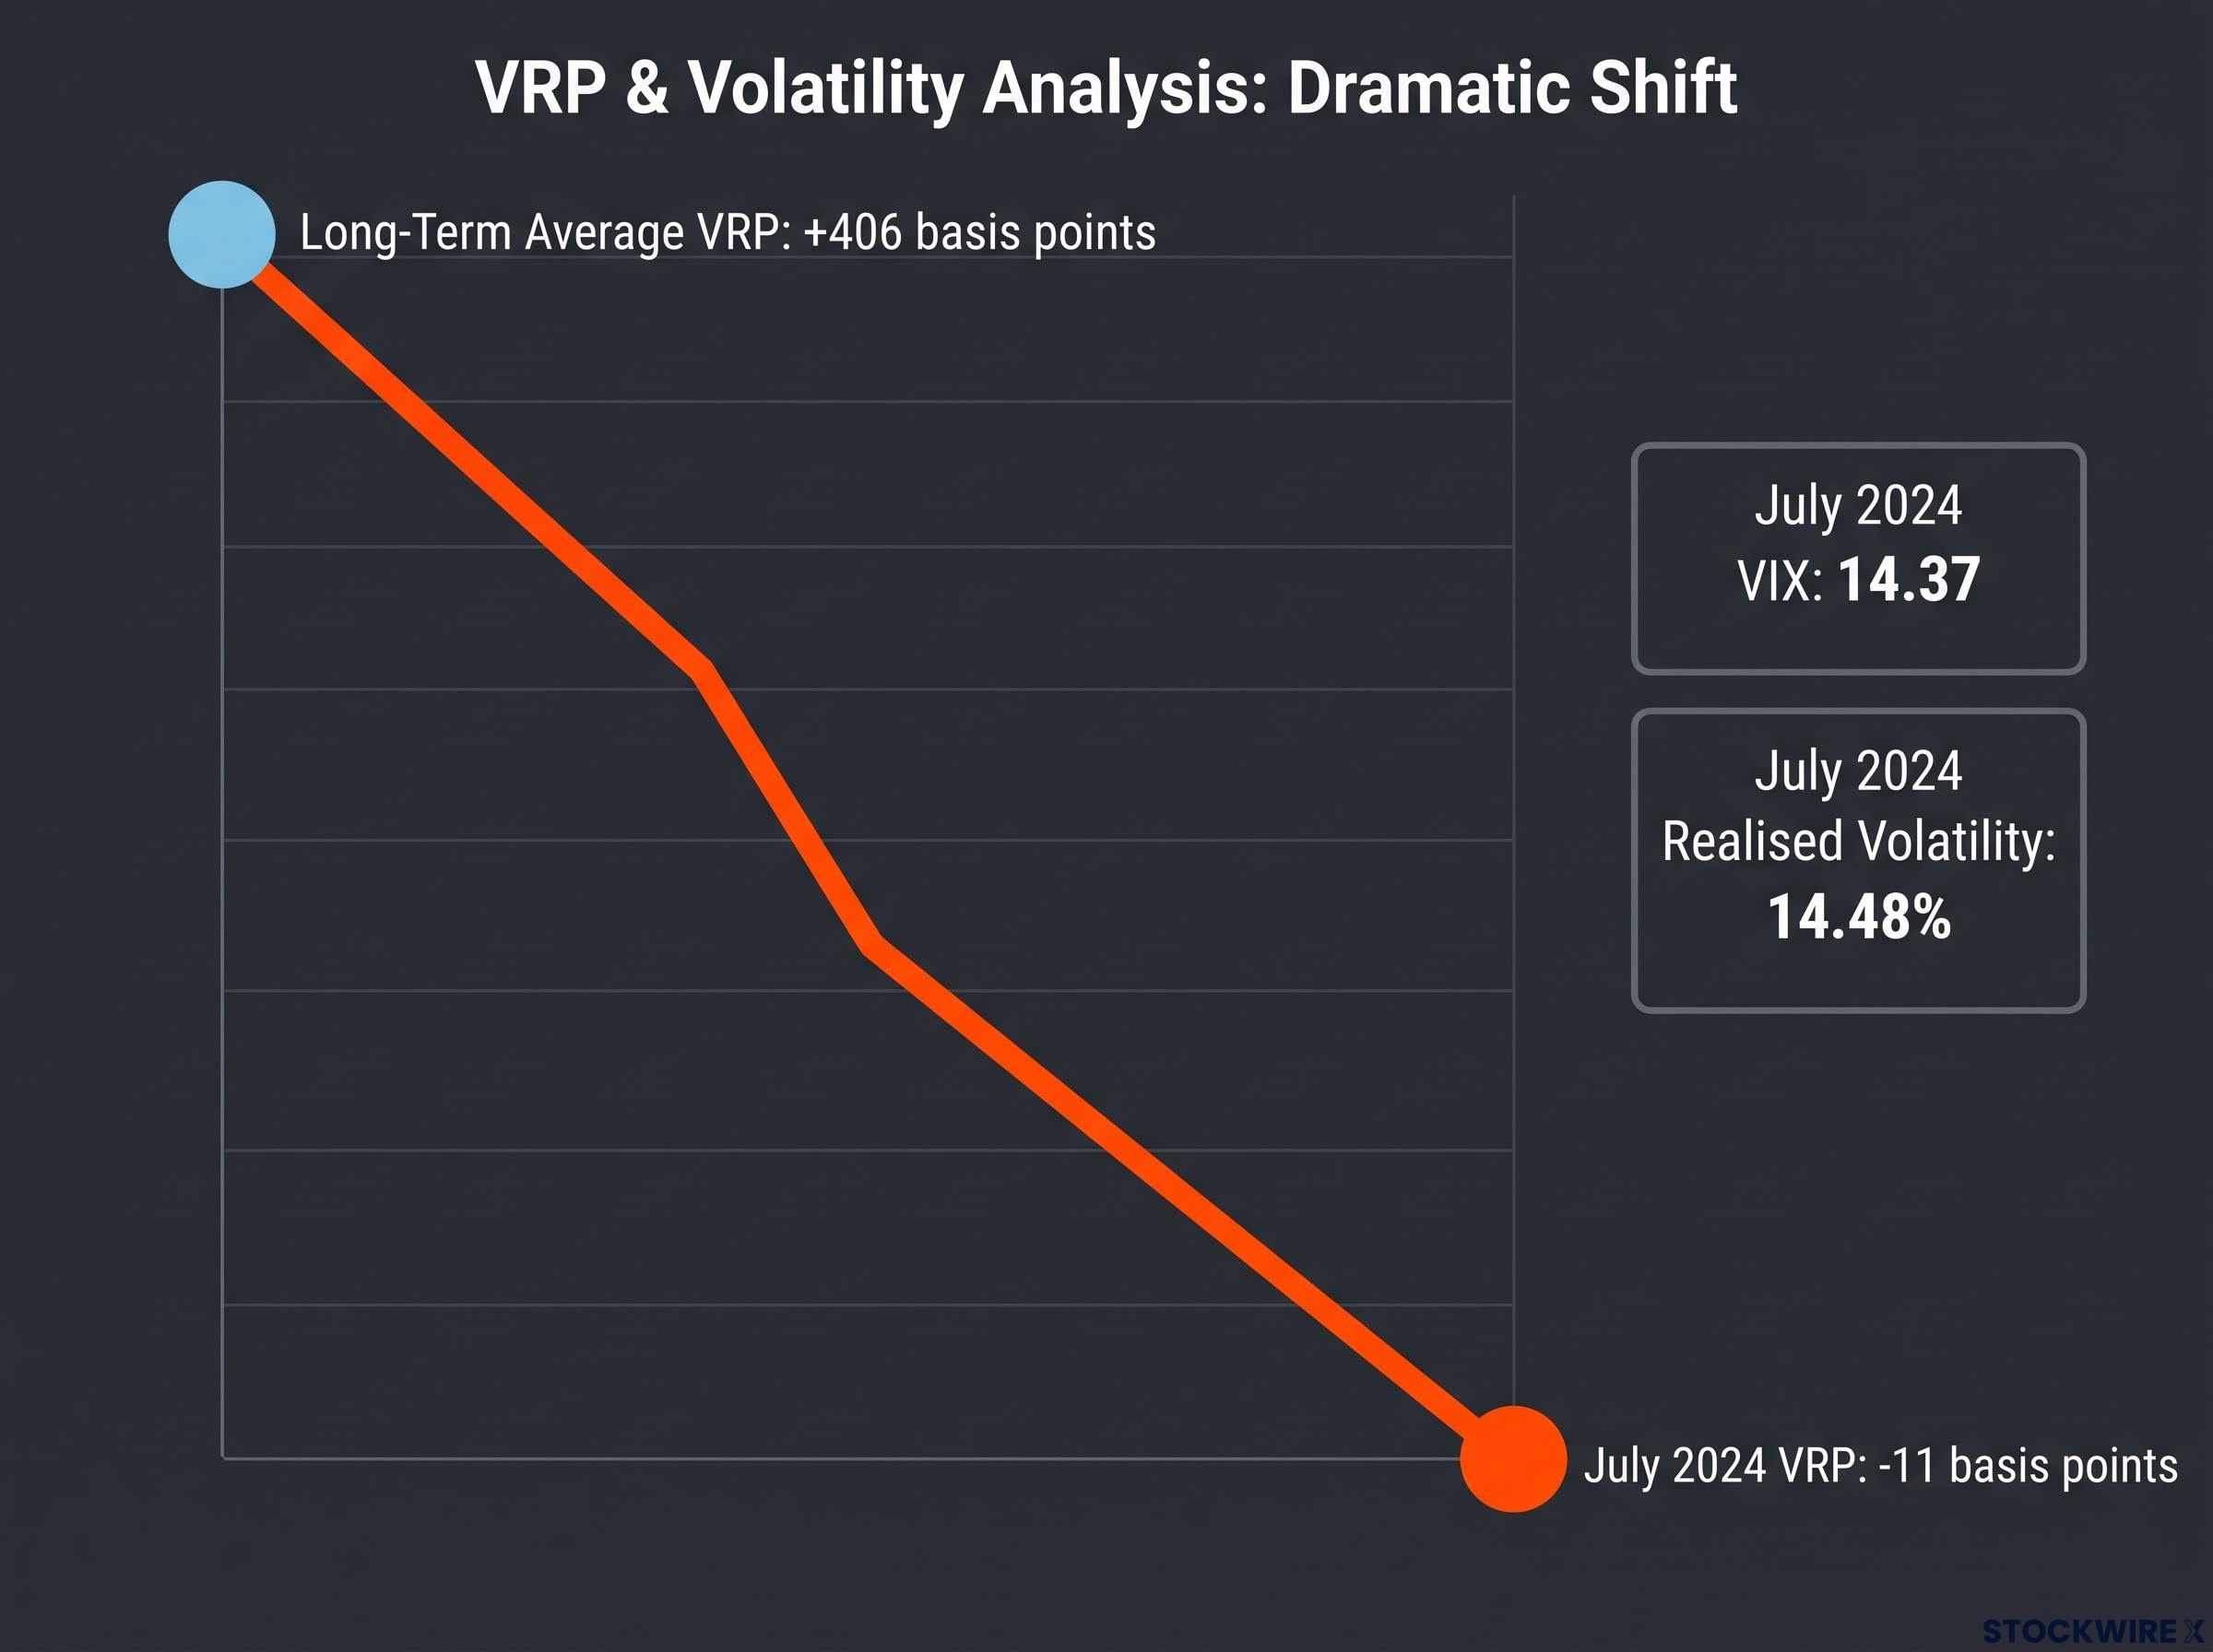
For an options seller, the 2.8x day-zero ratio looks like free money. July 2024 is the cautionary counterexample. The volatility risk premium (VRP), the gap between implied and realised volatility that normally rewards sellers, has a long-term average of +406 basis points for S&P 500 options. In July 2024 it hit -11 basis points, the first negative reading since November 2022, according to that month’s market recap. VIX averaged 14.37 while realised volatility ran to 14.48%.
How extreme the reversal was July 2024 VRP: -11 basis points. Long-term average: +406 basis points. Sellers were, briefly, paying to take on risk.
The setup that produced it should look familiar. June 2024 realised volatility was the lowest since November 2019 before normalising in July toward the since-1990 average of 15.44%. In other words, a calm that looked a lot like today’s all-time highs gave way within weeks.
When all-time highs and rising volatility coexist
Cboe documents a configuration it calls “Spot Up, VIX Up,” where the index climbs to records while VIX rises alongside it. It is a recurring pattern, not an anomaly.
Early August 2026 delivered a textbook instance. CNBC reported the S&P 500 breaking out 1.8% to fresh highs while VIX rose a full point to around 14.53 at the same time. Cboe’s educational framing explains that this usually reflects increased hedging or speculative put buying as prices rise, not simple fear.
That matters as a leading indicator. When hedgers are already paying up for protection before any pullback appears, it suggests a low-vol bull regime may be starting to transition, and the same structural forces that suppressed volatility at highs can amplify it once spot stops grinding upward.
This article is for informational purposes only and should not be considered financial advice. Investors should conduct their own research and consult with financial professionals before making investment decisions. Past performance does not guarantee future results, and the volatility patterns described here are subject to changing market conditions.
What the pattern means for how you read the next record close
Return to the numbers you started with. Options imply 0.92%, the market delivers 0.33%, IVR sits at 7.4. Nothing about those figures has changed. What should change is how you read them.
You now hold a three-layer framework. On the surface, day zero shows compressed ranges and a floored IVR. Underneath sit the causes: a selection effect that excludes messy sessions, a low-vol bull regime, and dealer gamma that dampens swings. And beyond day zero lives the tail risk the filter was hiding all along.
Does knowing this change what you do? Not as a blunt buy, sell, or hedge instruction. It changes how you identify the regime before assuming the day-zero calm applies to your position.
- Identify the regime first. Confirm you are in a grinding, low-vol bull before treating day-zero compression as reliable rather than coincidental.
- Watch IVR reversion as the clock. The gap between day-zero IVR near 7.4 and the long-run 13.3 closes within roughly one month, which is your natural monitoring horizon.
- Treat Spot Up, VIX Up as an early warning. Rising VIX at record highs suggests the compression phase may be shortening.
Options Greeks shift as implied volatility changes, so a position sized against a day-zero IVR of 7.4 will carry materially different delta and gamma exposure once IVR reverts toward its 13.3 long-run average, even if the underlying index level barely moves.
As of 4 September 2026, VIX closed at 14.53, per Yahoo Finance historical data, close to the 14.25 low set the day after the year’s 27th record. That is not evidence the market is safe. It is evidence the market is behaving exactly as the pattern predicts, which means the window of elevated tail risk against compressed implied volatility is already running.
For readers wanting to understand how mechanical selling amplifies volatility once the compression phase ends, our full explainer on CTA unwind mechanics covers the BofA analysis showing how elevated dealer gamma masked structural fragility in the weeks before the June 2026 Nasdaq selloff and how cascading trigger levels form.