Most Australian investors who want AI exposure reach for a broad technology index fund and assume the job is done. That instinct misses something structural about the theme itself.
The automation and AI story actually splits into two distinct investment cases. One is built around physical machines that replace human labour on factory floors, in warehouses, and inside operating theatres. The other is built around the software, chips, and cloud infrastructure that power intelligence itself.
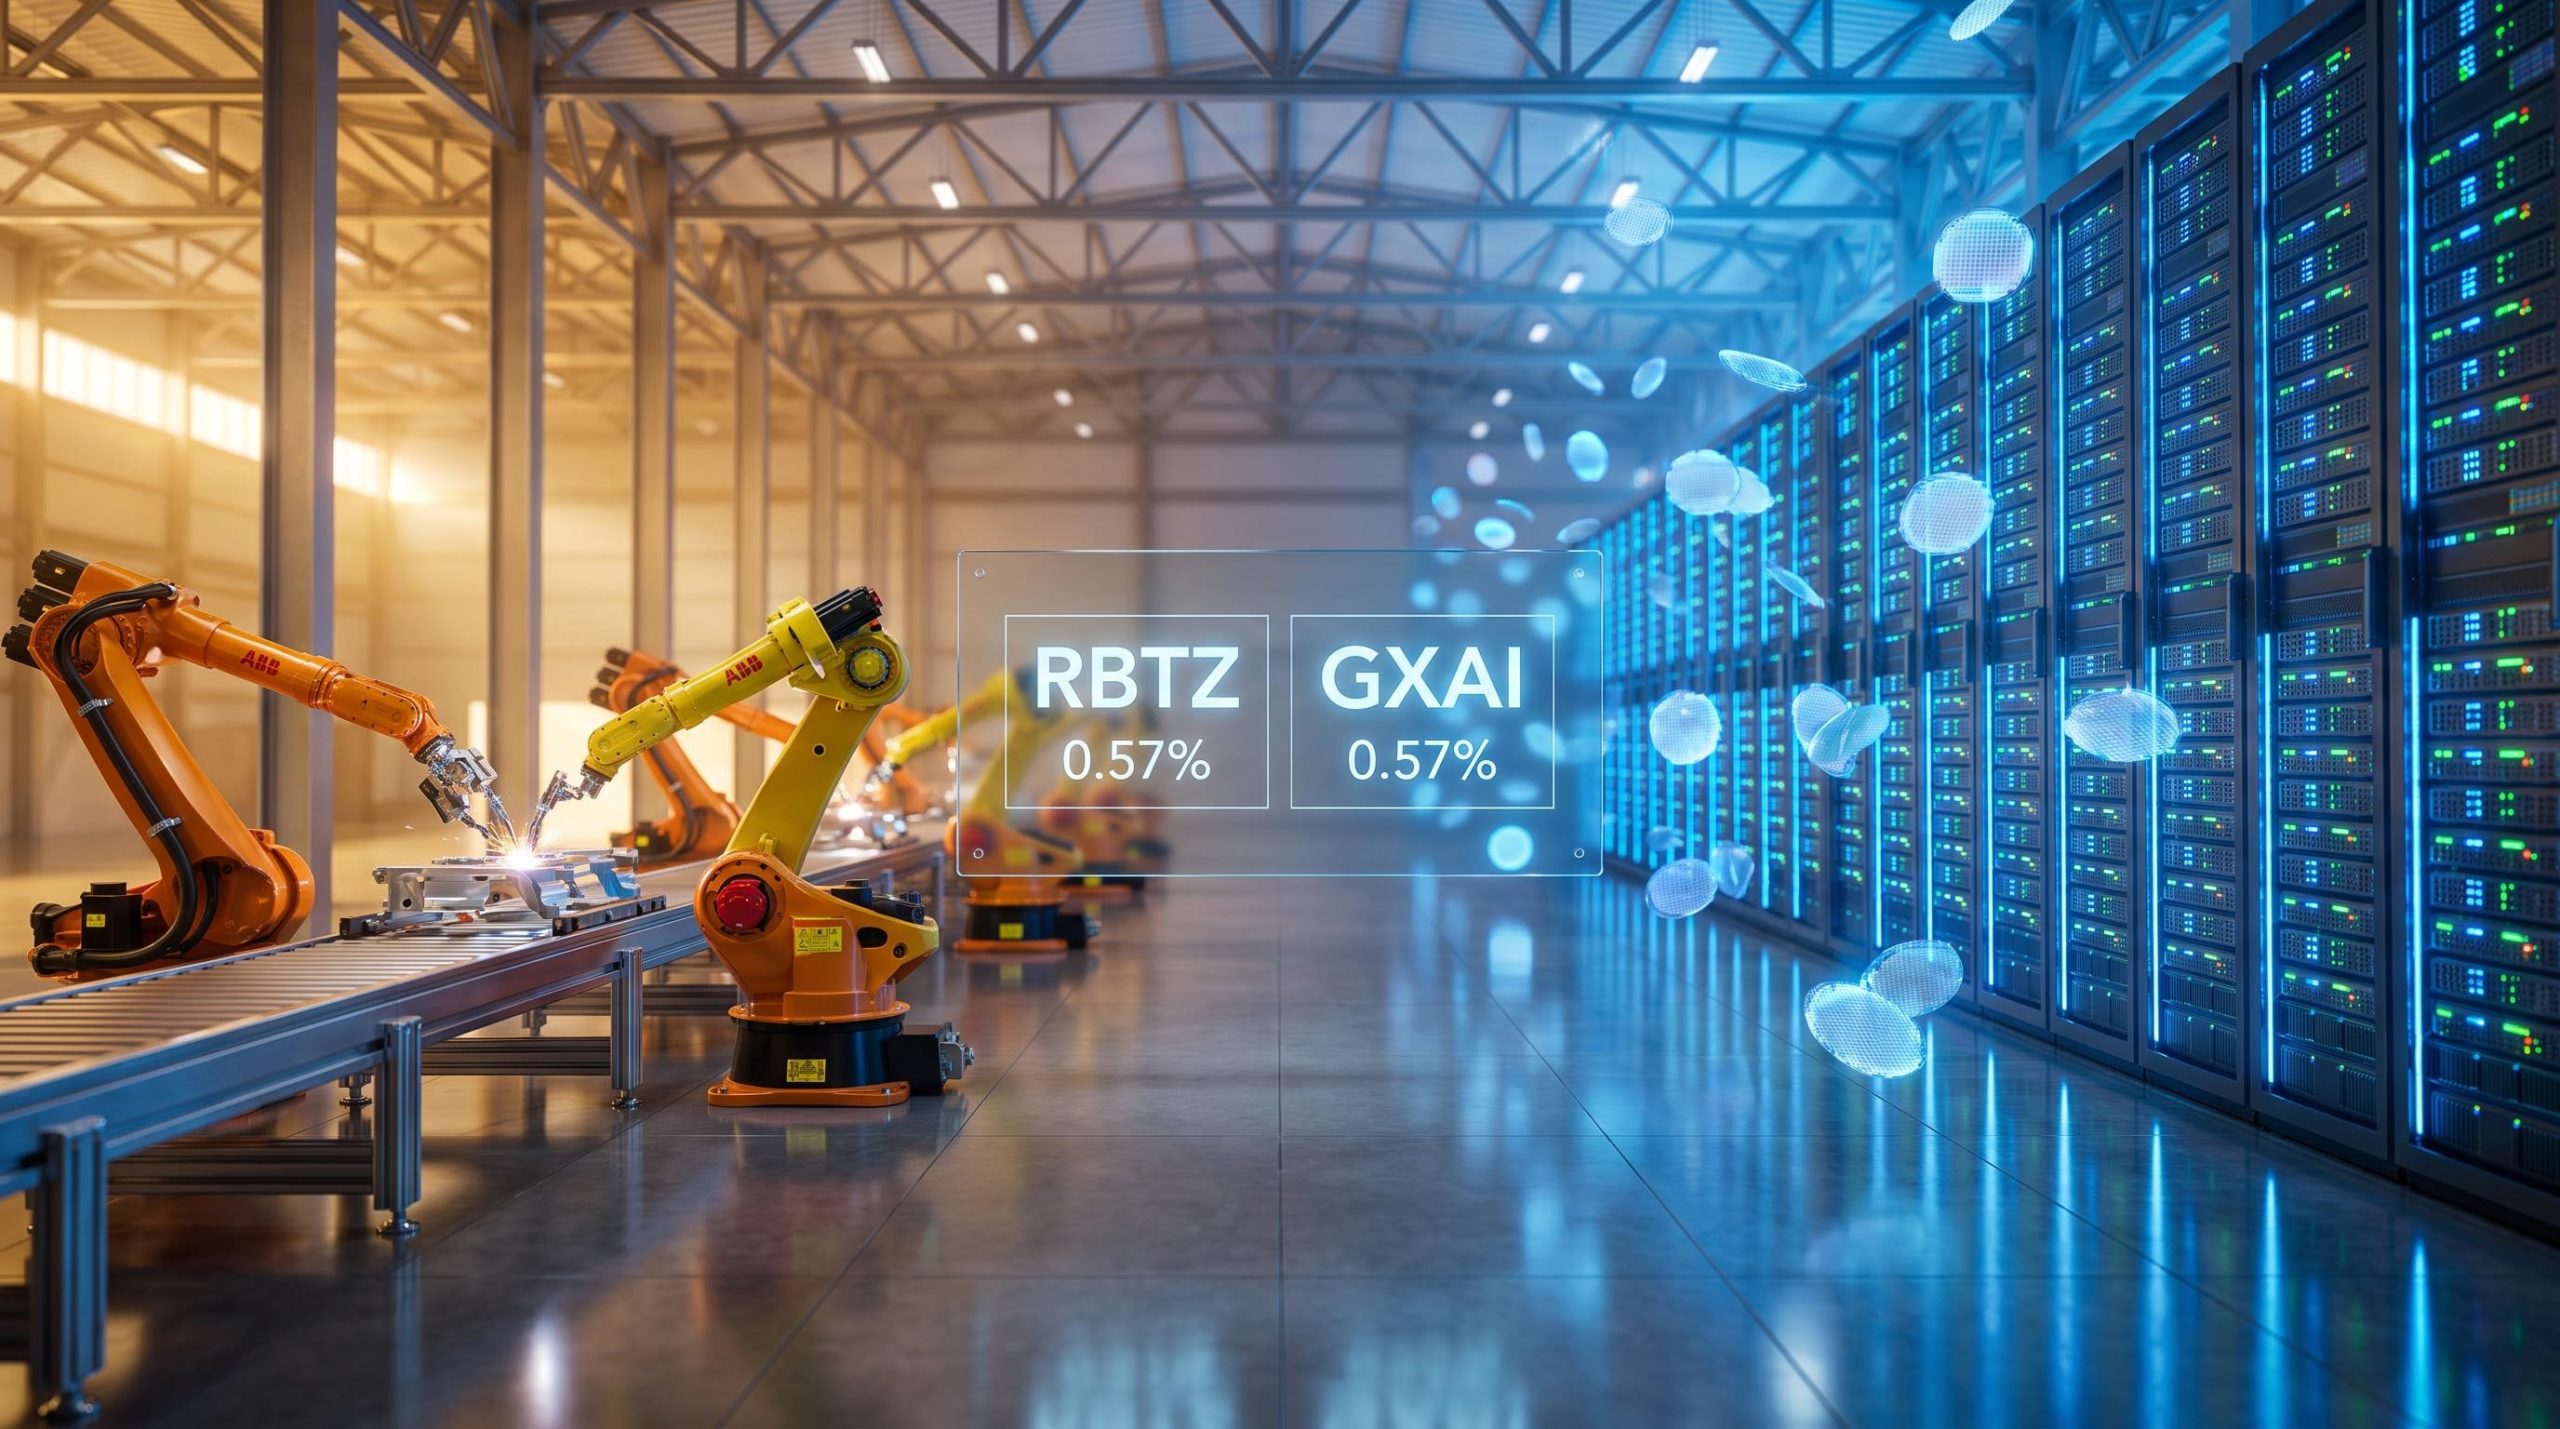
Two ASX-listed funds map onto those two slices. RBTZ from BetaShares and GXAI from Global X both carry a 0.57% management expense ratio and both trade in Australian dollars. But their underlying holdings, sector tilts, geographic exposures, and return profiles are materially different.
This gives you a clear framework for understanding what each fund actually owns, where the two overlap, and how you might use one or both as satellite positions inside a broader portfolio.
Why AI and automation are structural themes, not a single trade
Before any fund detail matters, it helps to understand why this theme is not a momentum story. The adoption of AI and automation is not being anticipated. It is already happening across the real economy, and that changes how you should evaluate any fund built on top of it.
Consider where the technology is already embedded:
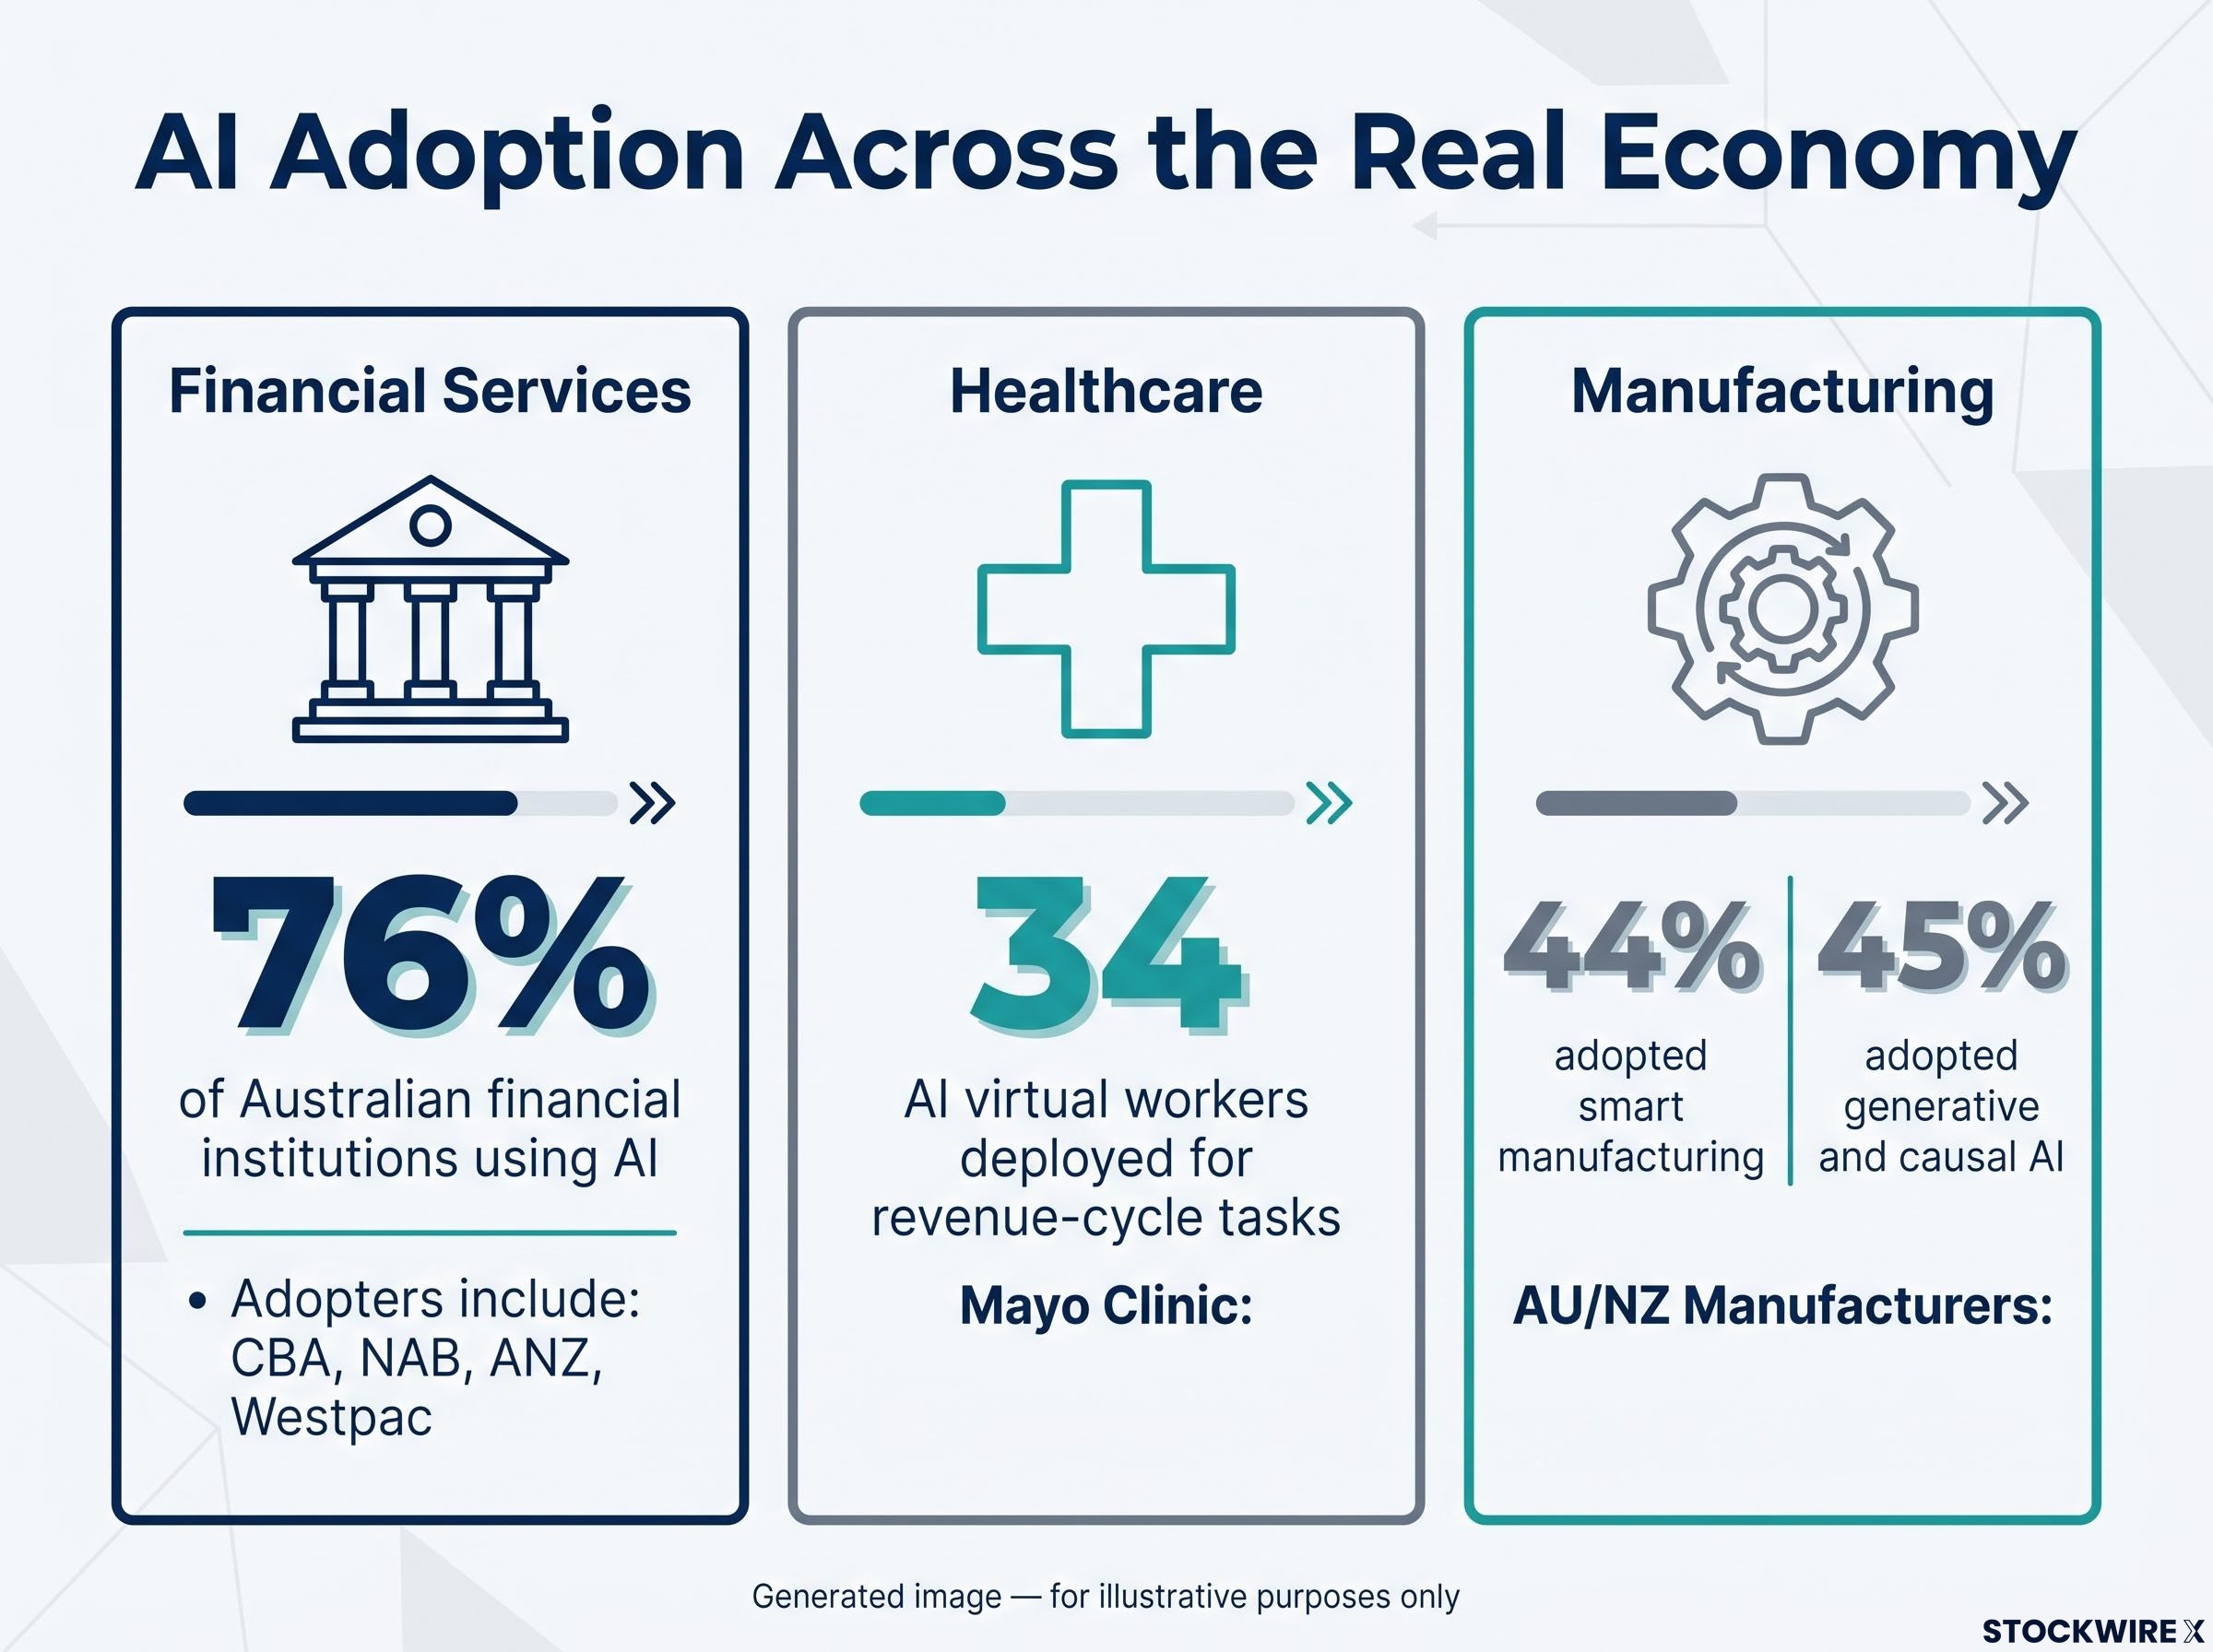
- Financial services: Around 76% of Australian financial institutions are actively using AI, according to survey data cited in industry research. Major banks including CBA, NAB, ANZ, and Westpac are integrating it across credit, risk, operations, and customer engagement.
- Healthcare: Clinical documentation tools such as Nuance DAX are reducing the time clinicians spend writing up notes, and the Mayo Clinic has reportedly deployed 34 AI-powered virtual workers to handle revenue-cycle tasks.
- Manufacturing: Survey data indicates 44% of manufacturers across Australia and New Zealand have adopted smart manufacturing technologies, and 45% have broadly adopted generative and causal AI.
- General enterprise: Adoption spans logistics, agriculture, and warehousing, with the pattern widening as the technology becomes cheaper to deploy.
Broadridge AI adoption research published in August 2025 found Australian financial services firms are running well ahead of global peers, with 67% reporting active use of general AI compared to 57% globally, a gap that illustrates why local financial institutions are already embedding AI across credit, risk, and operations rather than treating it as a future consideration.
These figures are best read as illustrations of adoption breadth rather than precise investment signals, and the underlying surveys carry their own caveats.
Enterprise AI adoption is uneven in ways that matter for how you assess the structural thesis behind both funds: an estimated 70-80% of AI pilots fail or stall, and only 12-20% of enterprises achieve meaningful operational embedding, which means the productivity gains underpinning the investment case are concentrating in a narrower group of companies than headline adoption figures suggest.
What the breadth tells you is that this is not a single-sector bet. It is a productivity infrastructure story that touches most parts of the economy, which is exactly why thematic funds in this space behave differently from a single-sector fund.
The investment horizon here is measured in decades and driven by productivity, not by short-term sentiment around any one AI headline. That distinction matters when you are deciding whether you are buying reasoned exposure or chasing a trend.
It also explains why one fund cannot cleanly capture the whole theme. Physical automation and digital intelligence are genuinely different sub-themes, with different companies, different geographies, and different valuation characteristics. Understanding the structural drivers puts you in a stronger position to judge whether a fund’s actual holdings reflect the thesis you think you are buying, or whether you are paying a thematic premium for names already sitting in your broad market fund.
When big ASX news breaks, our subscribers know first
RBTZ in focus: what the physical automation ETF actually owns
Start with what RBTZ holds, because the holdings reveal the fund’s real thesis more clearly than any label. This is a portfolio tilted toward physical automation: industrial robotics, factory machinery, warehouse systems, drone technology, and robotic surgery. It is not a software or cloud play.
The top positions make that concrete.
| Company | Country | Approx. Weight |
|---|---|---|
| Keyence | Japan | 9.84% |
| ABB Ltd | Switzerland | 9.76% |
| Fanuc Corp | Japan | 8.75% |
| NVIDIA Corp | United States | 8.38% |
| Intuitive Surgical | United States | 6.14% |
Holdings are reported as of 14 August 2026, are unverified, and are subject to change.
The sector weighting is a deliberate construction that prioritises companies making and deploying machines over companies writing code:
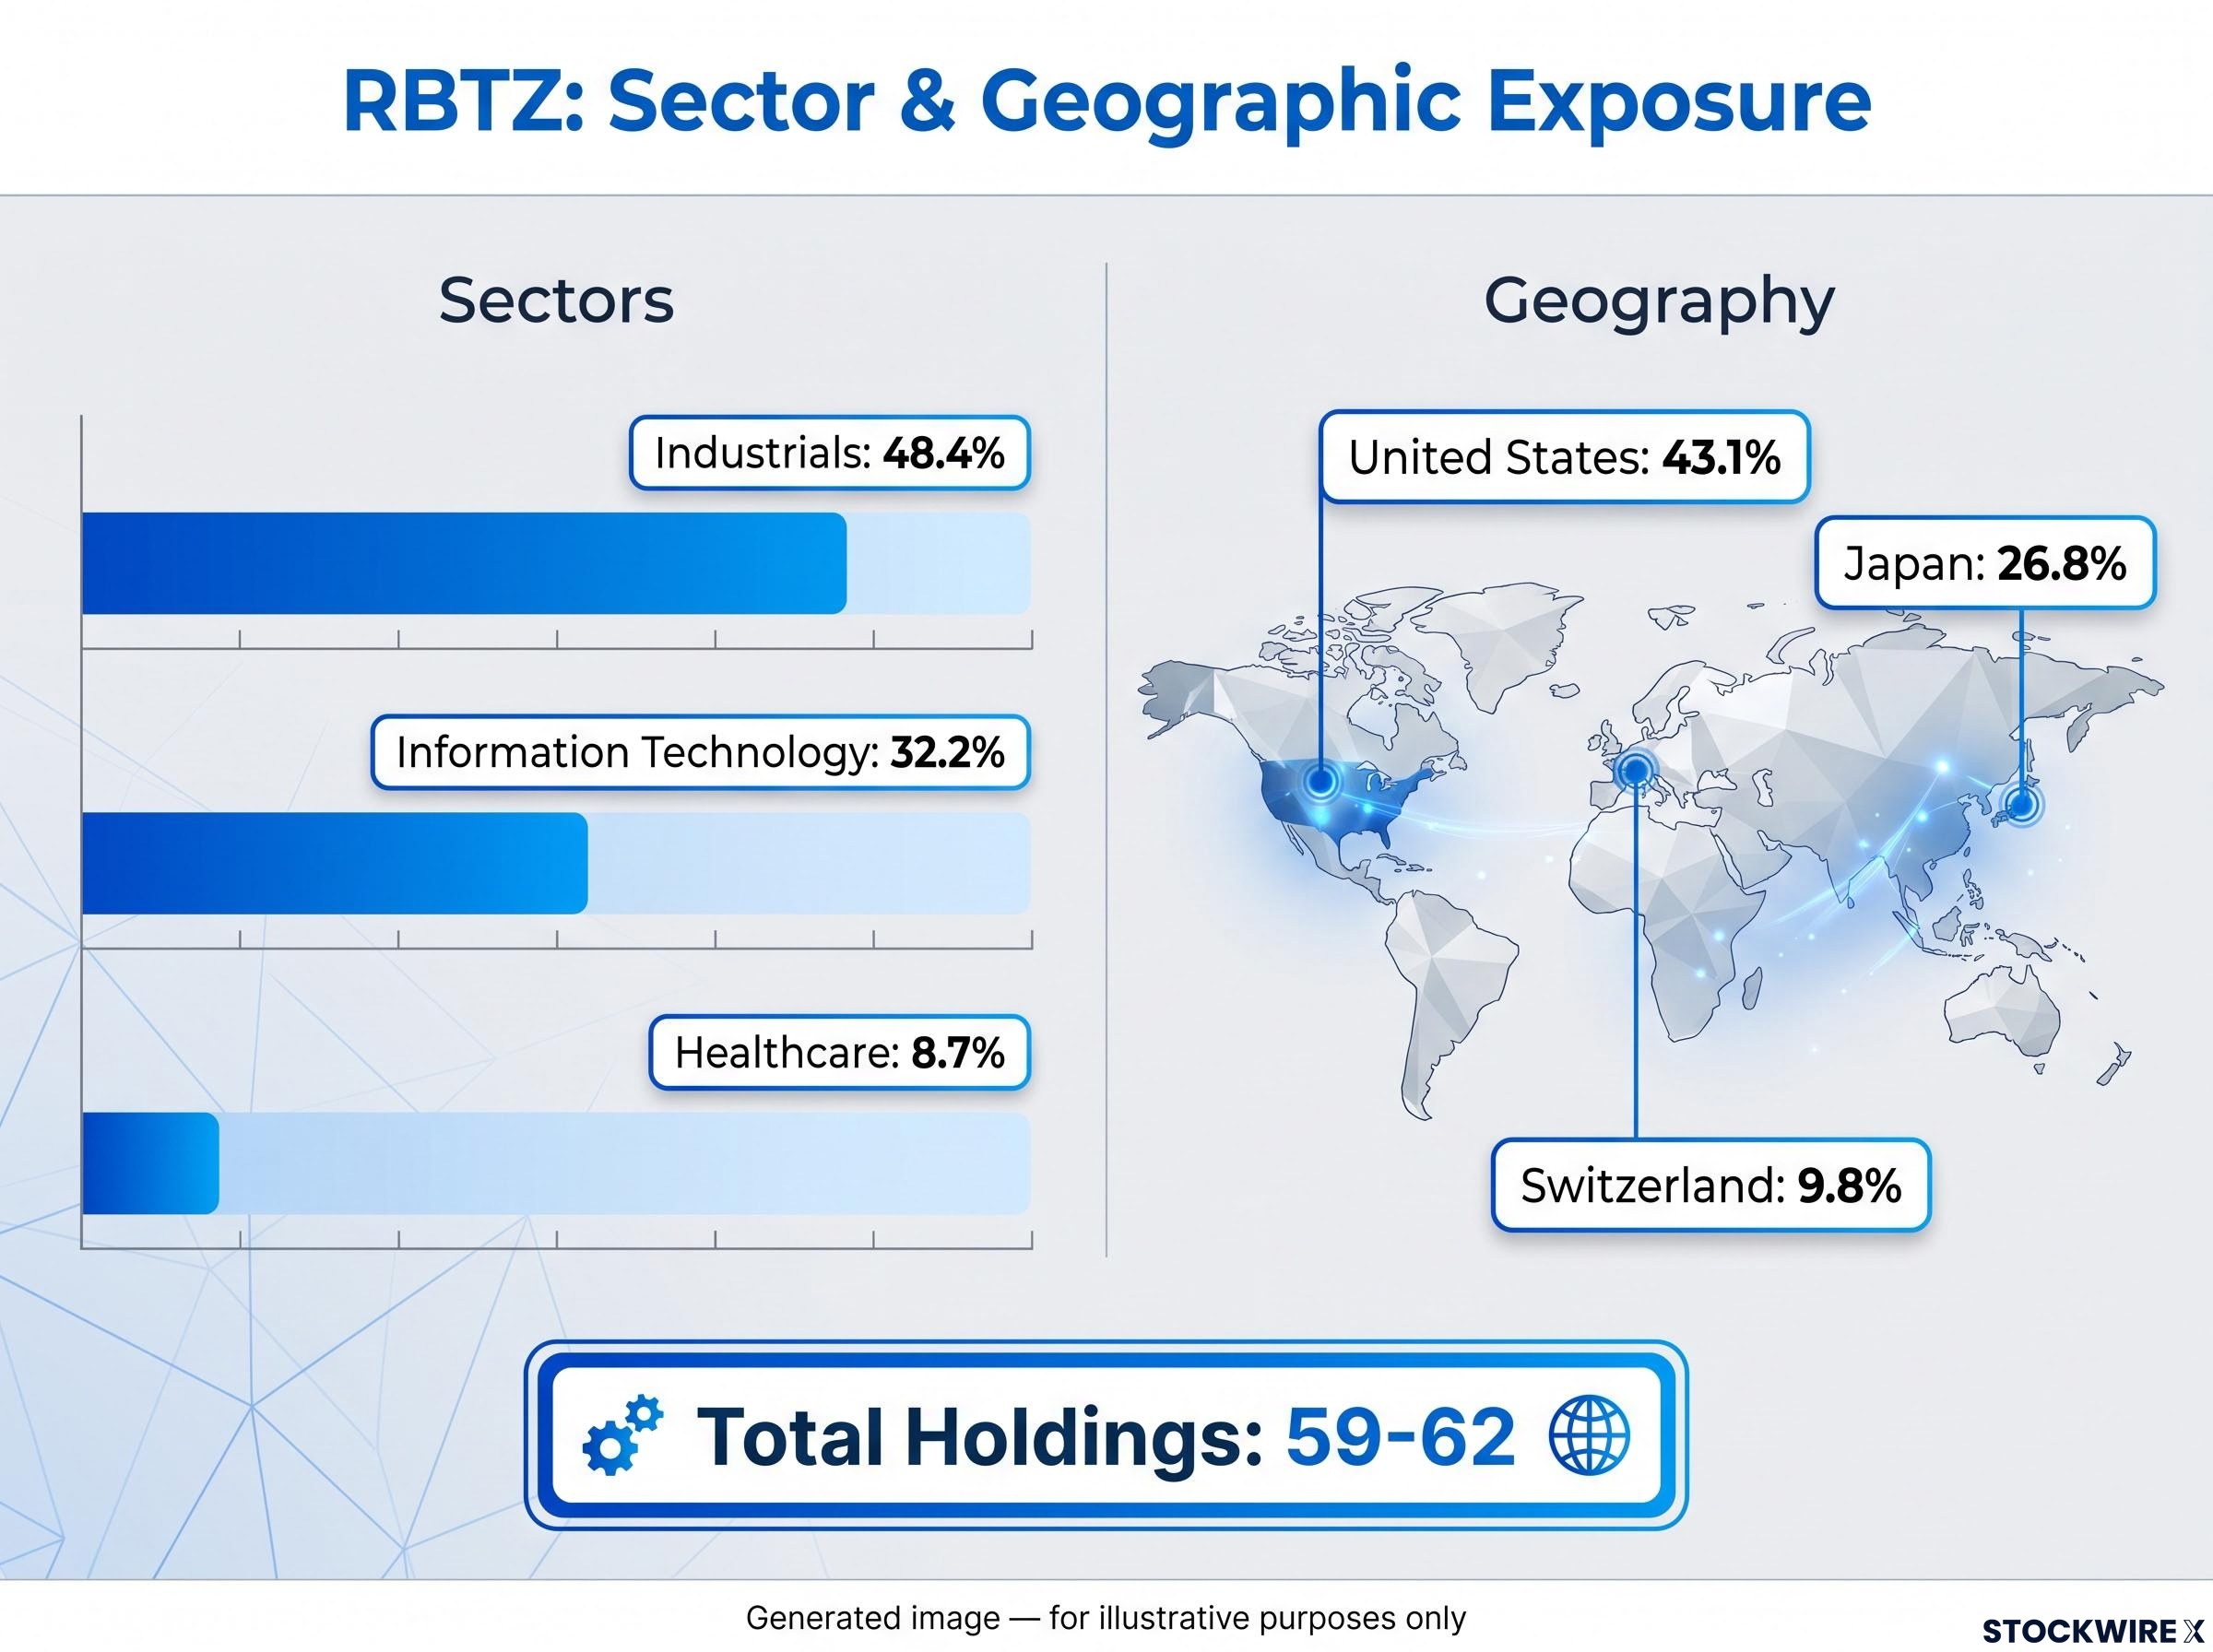
- Industrials: 48.4%
- Information Technology: 32.2%
- Healthcare: 8.7%
The geographic shape is where RBTZ separates itself most sharply from a US technology fund. Reported exposures sit at 43.1% to the United States, 26.8% to Japan, and 9.8% to Switzerland, across roughly 59-62 holdings depending on the source and date.
That mix, combined with the dominance of Keyence, ABB, and Fanuc at the top of the book, tells you RBTZ is not a proxy for US technology giants. It is genuine exposure to the industrial robotics supply chain, and it carries the volatility and valuation characteristics that come with that.
For an Australian investor whose existing holdings are already US-heavy, this is the differentiating point. The Japan and Switzerland weighting delivers exposure to companies that are unlikely to be well represented in a typical ASX-listed portfolio.
The fund manages assets in the range of A$295 million to A$329 million, with the spread reflecting different measurement dates across sources, and charges 0.57% per annum.
Performance, though, needs careful framing.
RBTZ reported a 1-year return of approximately -1.78% against a 3-year annualised return of roughly 7.04%. All figures are unverified and subject to change. The gap between the two tells you something important: the short-term number reflects sentiment and rate-cycle volatility, while the medium-term figure is closer to what the physical automation thesis has actually delivered through a difficult period for growth assets.
Past performance does not guarantee future results, and thematic funds like this can move sharply in either direction over short windows.
GXAI in focus: what broad AI exposure through software and semiconductors looks like
Put GXAI next to RBTZ and the difference in portfolio shape is immediate. Where RBTZ targets the machines, GXAI targets the intelligence and compute layer: semiconductors, cloud computing, data infrastructure, and software.
That focus produces a fundamentally different set of names.
| Company | Sector | Approx. Weight |
|---|---|---|
| Microsoft | Technology | 3.55% |
| Amazon | Consumer / Cloud | 3.39% |
| Alphabet Class A | Communication Services | 3.27% |
| Oracle | Technology | 3.16% |
| Tencent | Communication Services | 3.11% |
Holdings are reported as of early September 2026, are unverified, and are subject to change. Concurrent data snapshots also show SpaceX near 3.46% and Apple near 2.79%.
The sector tilt is where the fund’s character sits:
- Technology: 79.35%
- Communication Services: 9.84%
- Consumer Cyclical: 6.29%
- Industrials: 3.59%
There is a distinctive design choice at the top of this portfolio. The largest ten positions all sit between 2.89% and 3.55%, close to an equal weight. No single holding dominates the way Keyence dominates RBTZ.
But that near-equal top-ten weighting only tells half the story. The 79% technology concentration means the fund’s fate is still tied to the fortunes of global technology as a whole, not to AI adoption specifically. Avoiding single-stock dominance is not the same as avoiding sector concentration.
The AI supply chain that GXAI is designed to capture spans far beyond the familiar mega-cap names: foundries, high-bandwidth memory producers, and custom silicon developers are all absorbing significant fractions of the $630-725 billion in hyperscaler infrastructure spending committed for 2026 alone.
GXAI launched in April 2024, which matters for how you read its numbers. It has no 3-year or 5-year track record, so any performance figure covers a short and unusually favourable window.
Those figures have also varied widely across sources. Reported 1-year returns range from roughly 34% to 49% across measurement dates in mid-2026, a spread that reflects both genuine source variation and the fund’s sensitivity to swings in AI sentiment. All figures here are unverified.
The fund holds assets of approximately A$270 million to A$272 million as of recent September 2026 data, and charges the same 0.57% per annum as RBTZ.
For you, GXAI suits a preference for broad AI exposure without the stock-selection risk of choosing between individual semiconductor, cloud, or software names. The trade-off is that the fund moves with the technology sector, not purely with AI adoption, and you should size it with that in mind. Past performance does not guarantee future results.
How the two funds compare, and the risks Australian investors need to price in
Set side by side, RBTZ and GXAI are not competing versions of the same product. They are two ends of the same value chain.
| Feature | RBTZ | GXAI |
|---|---|---|
| Fund manager | BetaShares | Global X |
| MER | 0.57% | 0.57% |
| AUM (approx.) | A$295-329M | A$270-272M |
| Inception | Established (multi-year) | April 2024 |
| Dominant sector | Industrials (48%) | Technology (79%) |
RBTZ tilts toward Japan and Europe with a genuine multi-year track record; GXAI tilts toward US and global mega-cap technology with a short history that starts in April 2024. That contrast is the whole point. RBTZ targets the physical layer of automation, while GXAI targets the intelligence and compute layer, and together they cover more of the automation-to-AI chain than either does alone.
They do overlap on specific names. NVIDIA sits at roughly 8.38% of RBTZ and appears within GXAI’s technology exposure, so holding both means doubling up on some of the same companies.
Here is the read that matters most. Both funds charge an identical 0.57%, which means the fee is not the relevant differentiator. The decision between them, or the decision to hold both, should come down to which part of the value chain is least represented in your existing portfolio.
Four risks apply to both funds and deserve to be priced in before you allocate:
The thematic ETF behaviour gap, where reported time-weighted returns diverge sharply from the money-weighted returns investors actually experience, is especially pronounced for technology-focused funds: ARK Innovation reported a +233% gain while the typical investor experienced approximately -35% due to poorly timed entries near peak valuations.
- Concentration risk: Top-10 holdings in AI-focused thematic ETFs frequently represent 40-50% or more of total assets, which can turn a diversified-sounding theme into a concentrated bet.
- Valuation and rate sensitivity: These portfolios often trade at elevated multiples, making them sensitive to rising long-term real interest rates that compress growth valuations.
- Currency risk: The underlying holdings are predominantly USD-denominated, so the Australian dollar’s movements feed directly into your returns.
- Thematic drift: Sentiment-driven flows may run ahead of durable cash-flow growth, leaving you exposed if the narrative cools before the earnings arrive.
The direction of travel, though, is structural rather than speculative. APRA CPS 230, effective 1 July 2025, explicitly requires Australian institutions to manage risks from AI and cloud service providers, a signal that AI adoption is shifting from discretionary to operationally required.
Both funds are best suited as satellite exposures within a diversified portfolio, not as core holdings.
That framing suits investors comfortable with higher volatility who are willing to monitor how the theme evolves rather than setting and forgetting.
Where RBTZ and GXAI sit in the decade ahead
The coming decade is the period where the AI and automation thesis is expected to move from early adoption to scaled value creation. What that means for these two funds depends on which part of the chain compounds fastest.
RBTZ stands to benefit most as physical automation deepens across manufacturing, agriculture, and healthcare. GXAI stands to benefit most as demand for AI software and compute continues to grow. Both carry currency risk and valuation risk tied to US real interest rates, which you should track alongside the theme itself.
The evidence suggests the structural drivers are not exhausted. Only 45% of ANZ manufacturers have broadly adopted generative AI, leaving significant room for penetration to deepen, and APRA CPS 230 shows Australian regulation is now catching up to adoption, which typically precedes broader institutional investment. RBTZ’s 3-year annualised return of roughly 7% offers a reference point for what physical automation has delivered through a hard rate cycle.
Conditions that support the thesis
- Continued enterprise AI and automation capital expenditure growth, particularly in non-manufacturing sectors.
- Expansion of regulatory frameworks such as APRA CPS 230 that embed AI adoption into operational requirements rather than treating it as optional.
- Deepening robotics penetration in healthcare, agriculture, and logistics, which would expand RBTZ’s addressable market beyond its industrial core.
Conditions that warrant reassessment
- A sustained rise in long-term real interest rates that compresses growth valuations across both funds’ underlying portfolios.
- Evidence that AI productivity benefits are flowing primarily to end users rather than to the technology suppliers and hardware makers these funds hold.
Watching the right leading indicators, rather than simply the funds’ recent price performance, puts you in a stronger position to hold through volatility or to reassess if the adoption story stalls. These conditions are speculative and subject to change based on market and company developments.
Making a considered call on thematic technology exposure
The core distinction is now clear. RBTZ is for investors who want the physical layer of automation with genuine geographic diversification into Japan and Europe. GXAI is for investors who want broad coverage of the AI compute and software stack with a predominantly US and global mega-cap technology tilt.
The two are not mutually exclusive. An investor seeking full value-chain exposure could hold both, provided each is sized as a satellite position and the overlap on names such as NVIDIA is understood.
Because both funds charge an identical 0.57%, the choice carries no cost penalty in either direction. The decision is purely about portfolio fit and thematic conviction, not price. Both have also reached meaningful scale for ASX-listed thematic ETFs, with RBTZ around A$300-330 million and GXAI around A$270 million, though GXAI’s performance history since April 2024 is short and should not be extrapolated.
Before allocating to either, a short checklist keeps the decision deliberate rather than label-driven:
- Verify current holdings on the fund manager’s website rather than trusting the fund name.
- Check the geographic and currency exposure relative to what you already hold.
- Assess how the dominant sector tilt interacts with your existing portfolio.
- Confirm the fund’s current AUM is adequate for the liquidity needs of your intended position size.
A well-informed investor who understands what each fund actually owns is positioned to make a deliberate allocation rather than a label-driven one, which is the most reliable way to ensure a thematic ETF does what you expect in your portfolio.
For readers wanting to stress-test the satellite allocation framing before committing capital, our dedicated guide to thematic ETF sector rotation risk examines how the 2026 rotation into resources and energy exposed technology-themed ETF holders to drawdowns of up to 25% while diversified portfolios captured triple-digit gains.
This article is for informational purposes only and should not be considered financial advice. Investors should conduct their own research and consult with financial professionals before making investment decisions. Past performance does not guarantee future results, and financial projections are subject to market conditions and various risk factors.