EUR/GBP is trading around 0.8580, and the reason sits inside a set of German numbers that look reassuring until you read the fine print. On Tuesday, the pair slipped for a third straight session after being rejected at the 0.8600 resistance zone, and the trigger was a trade surplus that widened for the wrong reason. Germany did not sell more to the world. It bought less from it.
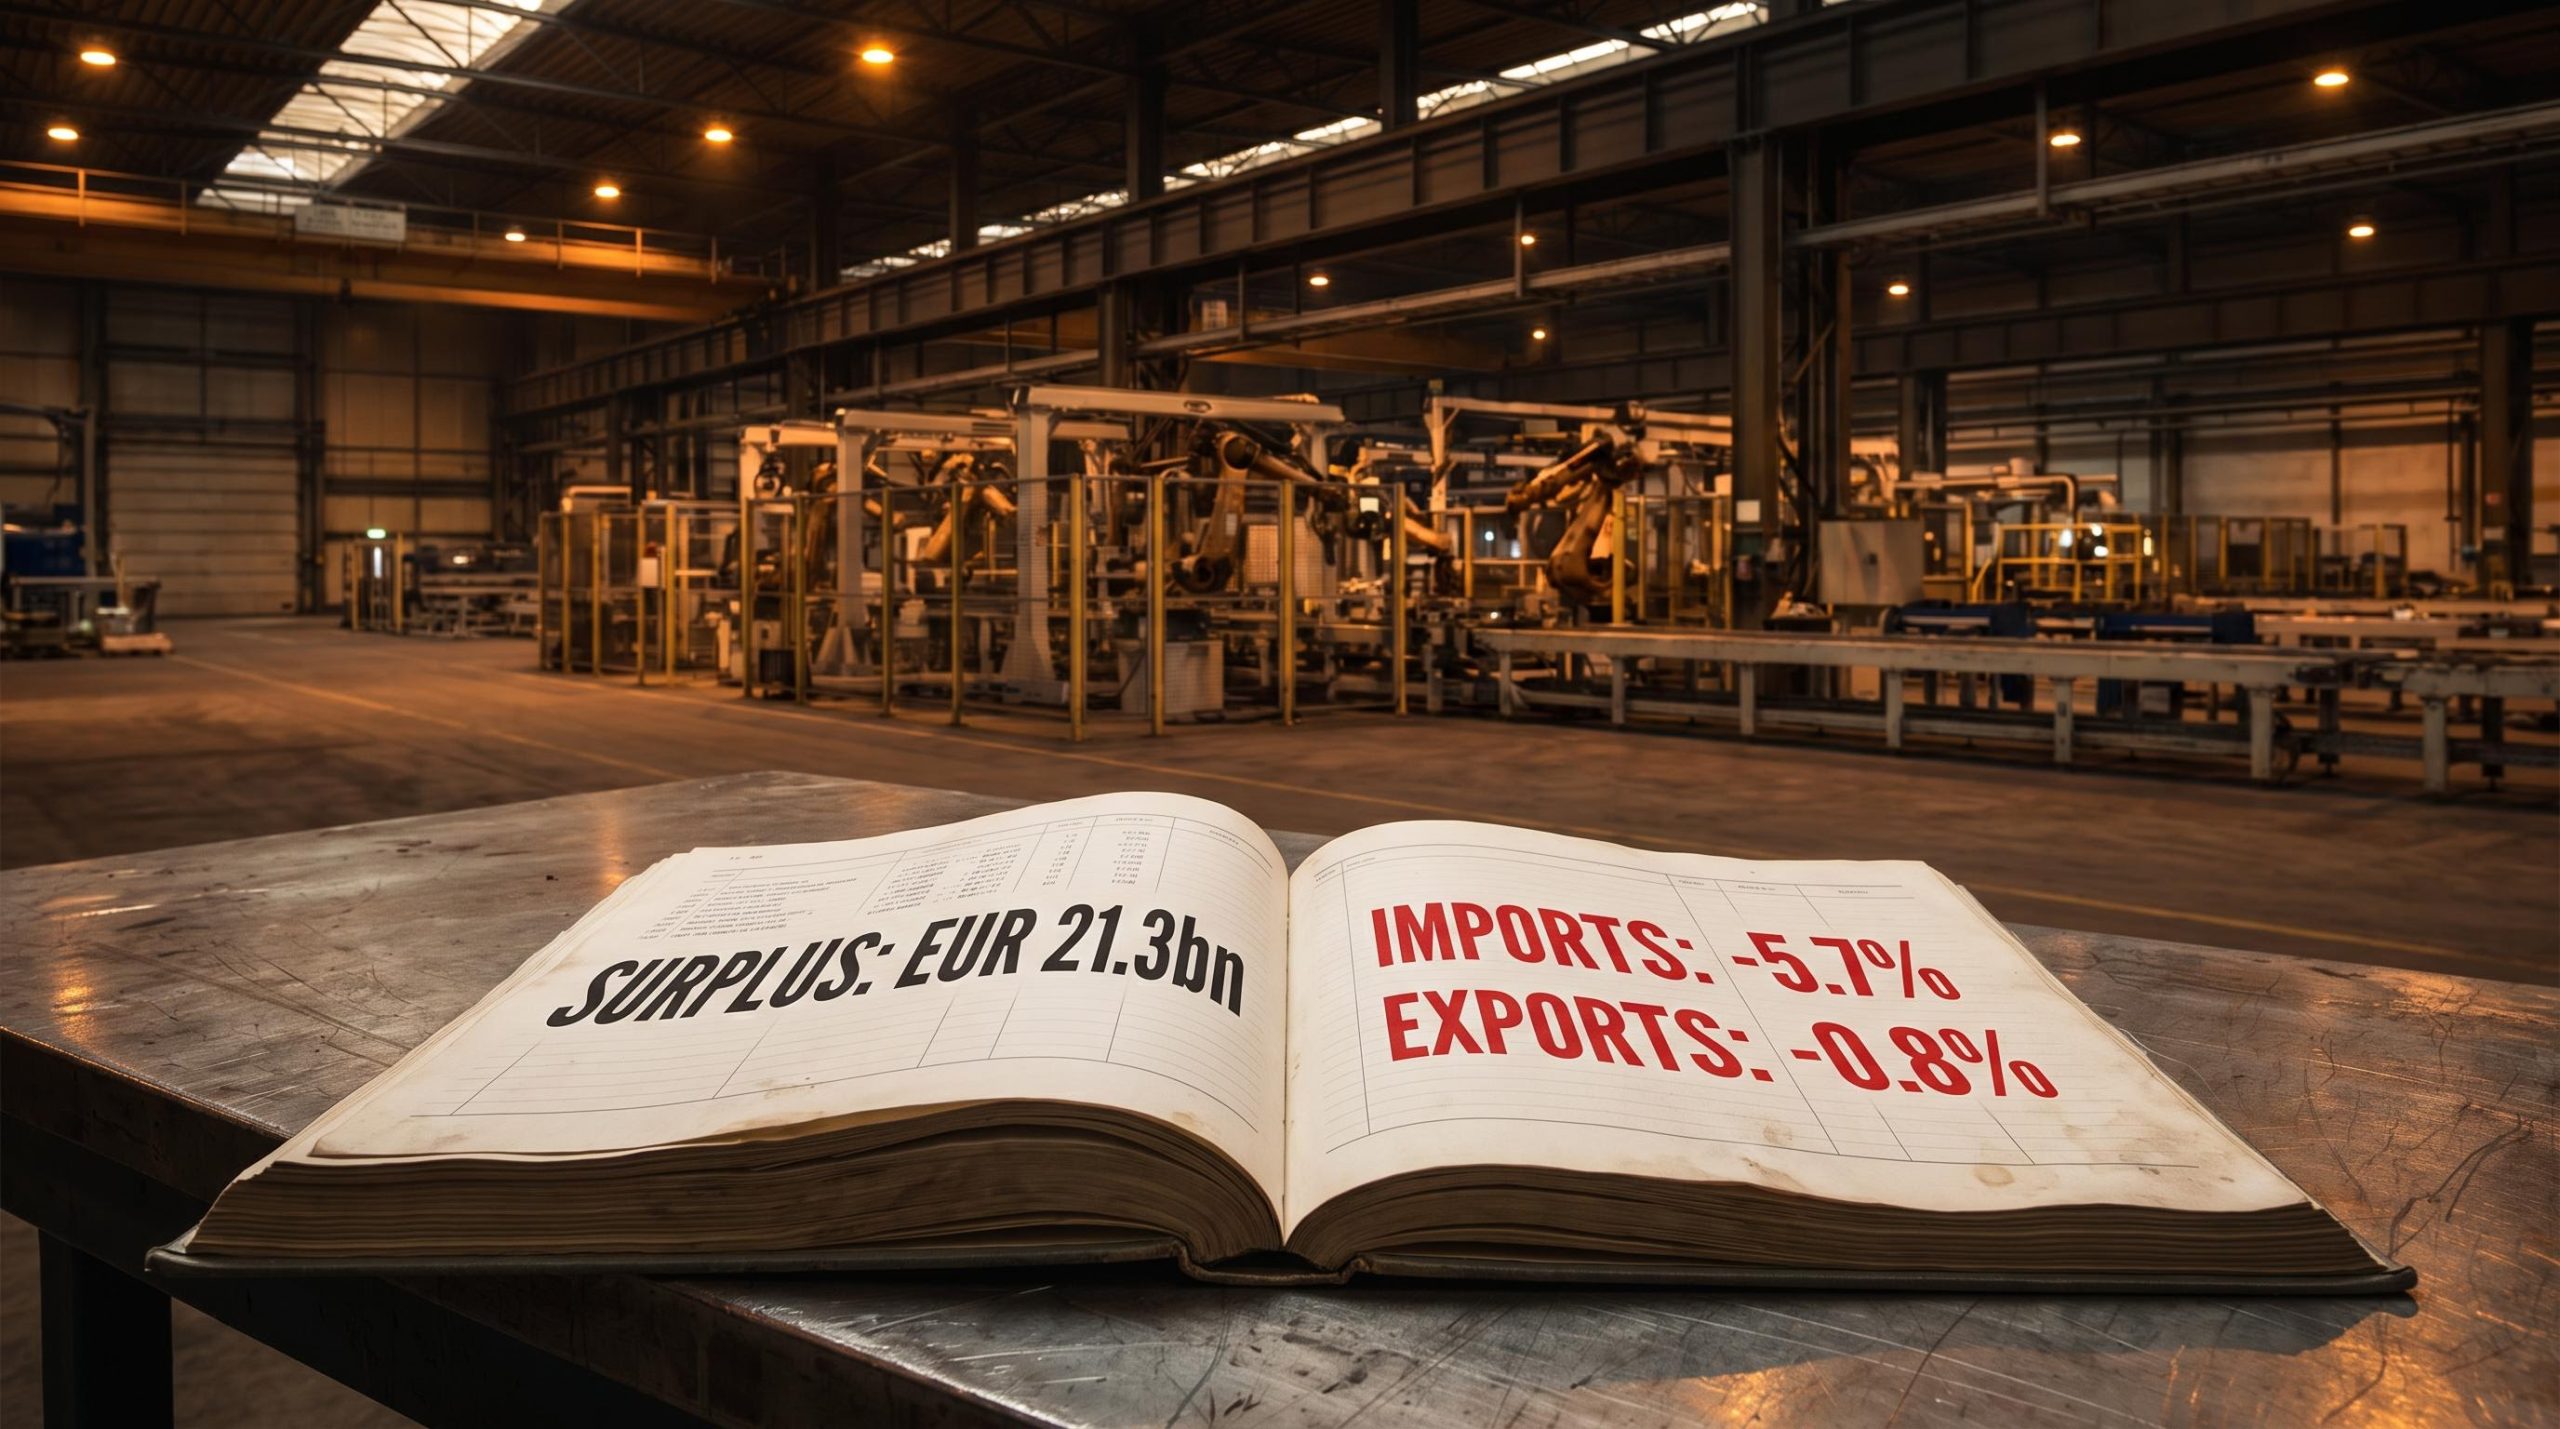
Two German data releases landed in the same week, and both pointed the same way. Industrial production fell 1.1% in July when markets had pencilled in a 0.3% expansion. The trade surplus beat forecasts comfortably, but the beat came from a 5.7% collapse in imports, not from export strength.
Here is the practical payoff. After this, you will be able to look at a German data release and know almost immediately whether it is likely to move EUR/GBP, why a positive Eurozone GDP figure often fails to override a Germany-specific signal, and what the structural picture means for how long this euro softness might last.
What the German numbers actually said this week
Start with the surface reading, because that is where most people stop. Germany’s July trade surplus came in at EUR 21.3 billion, well above the EUR 16 billion consensus and up sharply from EUR 15.4 billion in June. Read alone, a wider surplus sounds like an export machine firing on all cylinders.
Then read the composition. Exports actually fell 0.8% in July. The surplus widened only because imports dropped 5.7%, more than offsetting the export decline. A surplus built on shrinking imports is not a competitiveness story. It is a demand story, and the demand is going the wrong way.
The industrial production figure told the same story with less ambiguity.
The Destatis industrial production data covering July 2026 confirms the sector-level breakdown behind the headline miss, with automotive output identified as the primary drag on the monthly contraction.
German industrial production contracted 1.1% in July against a consensus expectation of a 0.3% expansion, according to Germany’s Federal Statistics Office, with a pronounced downturn in the automotive sector identified as a key driver. That miss was the single sharpest negative surprise in the week’s data.
Here is how the two readings compare once you separate the headline from the mechanics:
- Surface reading, trade balance: surplus jumps to EUR 21.3 billion, beating consensus by more than EUR 5 billion.
- Corrected interpretation, trade balance: the beat is entirely an import collapse of 5.7%, while exports still fell 0.8%, signalling retreating domestic demand.
- Surface reading, industrial output: a monthly figure that markets expected to tick higher.
- Corrected interpretation, industrial output: a 1.1% contraction, led by autos, extending a run of factory weakness.
The data point to watch is the import collapse, not the headline surplus. Falling imports tell you domestic demand is pulling back, and that is the opposite of the kind of signal that supports a currency. Read together, both releases describe an economy where output is shrinking and demand is retreating, which is why EUR/GBP kept sliding rather than bouncing on a stronger surplus.
When big ASX news breaks, our subscribers know first
How economic data moves a currency pair: the transmission mechanism explained
You saw two German numbers move the euro this week. The next question is why German data punch so far above their weight, given that Germany is one of nineteen economies sharing the currency.
The answer is size and signal. Germany is the largest economy in the euro area and a dominant contributor to the bloc’s industrial output and exports. When German factories slow, markets treat it as a leading read on where the whole euro-area growth picture is heading, not as one country’s local problem.
The ECB’s symmetric 2% mandate and the outsized weight that German PMI and Ifo readings carry in currency markets are two of the euro valuation fundamentals that explain why a single German industrial release can move EUR/GBP more sharply than a positive aggregate Eurozone figure.
That signal then travels through interest rate expectations. The European Central Bank (ECB) sets one policy rate for the entire euro area, so German weakness cannot be met with a German-specific rate cut. Instead, incoming German data shift market expectations about future euro-area growth, and those shifting expectations reprice the euro. Here is the chain in three steps:
- A German data release comes in weaker than expected, signalling softer euro-area growth ahead.
- Traders reprice the ECB’s likely rate path lower, or mark down the euro’s growth premium.
- EUR/GBP moves as the euro’s expected return relative to sterling adjusts.
This is also why a decent Eurozone aggregate number failed to rescue the euro. Euro-area Q2 2025 GDP was revised up to 0.6% from a preliminary reading, and growth stayed positive through the rest of the year at 0.2% in Q3 and 0.3% in Q4. Yet the currency still leaned on the German signal.
The reason is that aggregate figures lag turning points and can mask divergence inside the bloc. Germany-specific surprises arrive first and carry signal value about where the aggregate is heading, so markets treat them as the live read. The fact that Eurozone GDP held up while Germany deteriorated is not reassuring for the euro. It means the market had two competing signals and chose the German one, which tells you which level of data currency traders actually price.
| Quarter | Eurozone GDP growth (q/q) | Germany industrial signal | EUR/GBP direction |
|---|---|---|---|
| Q2 2025 | 0.6% (revised up) | Weakening | Soft, capped below 0.8600 |
| Q3 2025 | 0.2% | Weak | Range-bound |
| Q4 2025 | 0.3% | Weak | Range-bound |
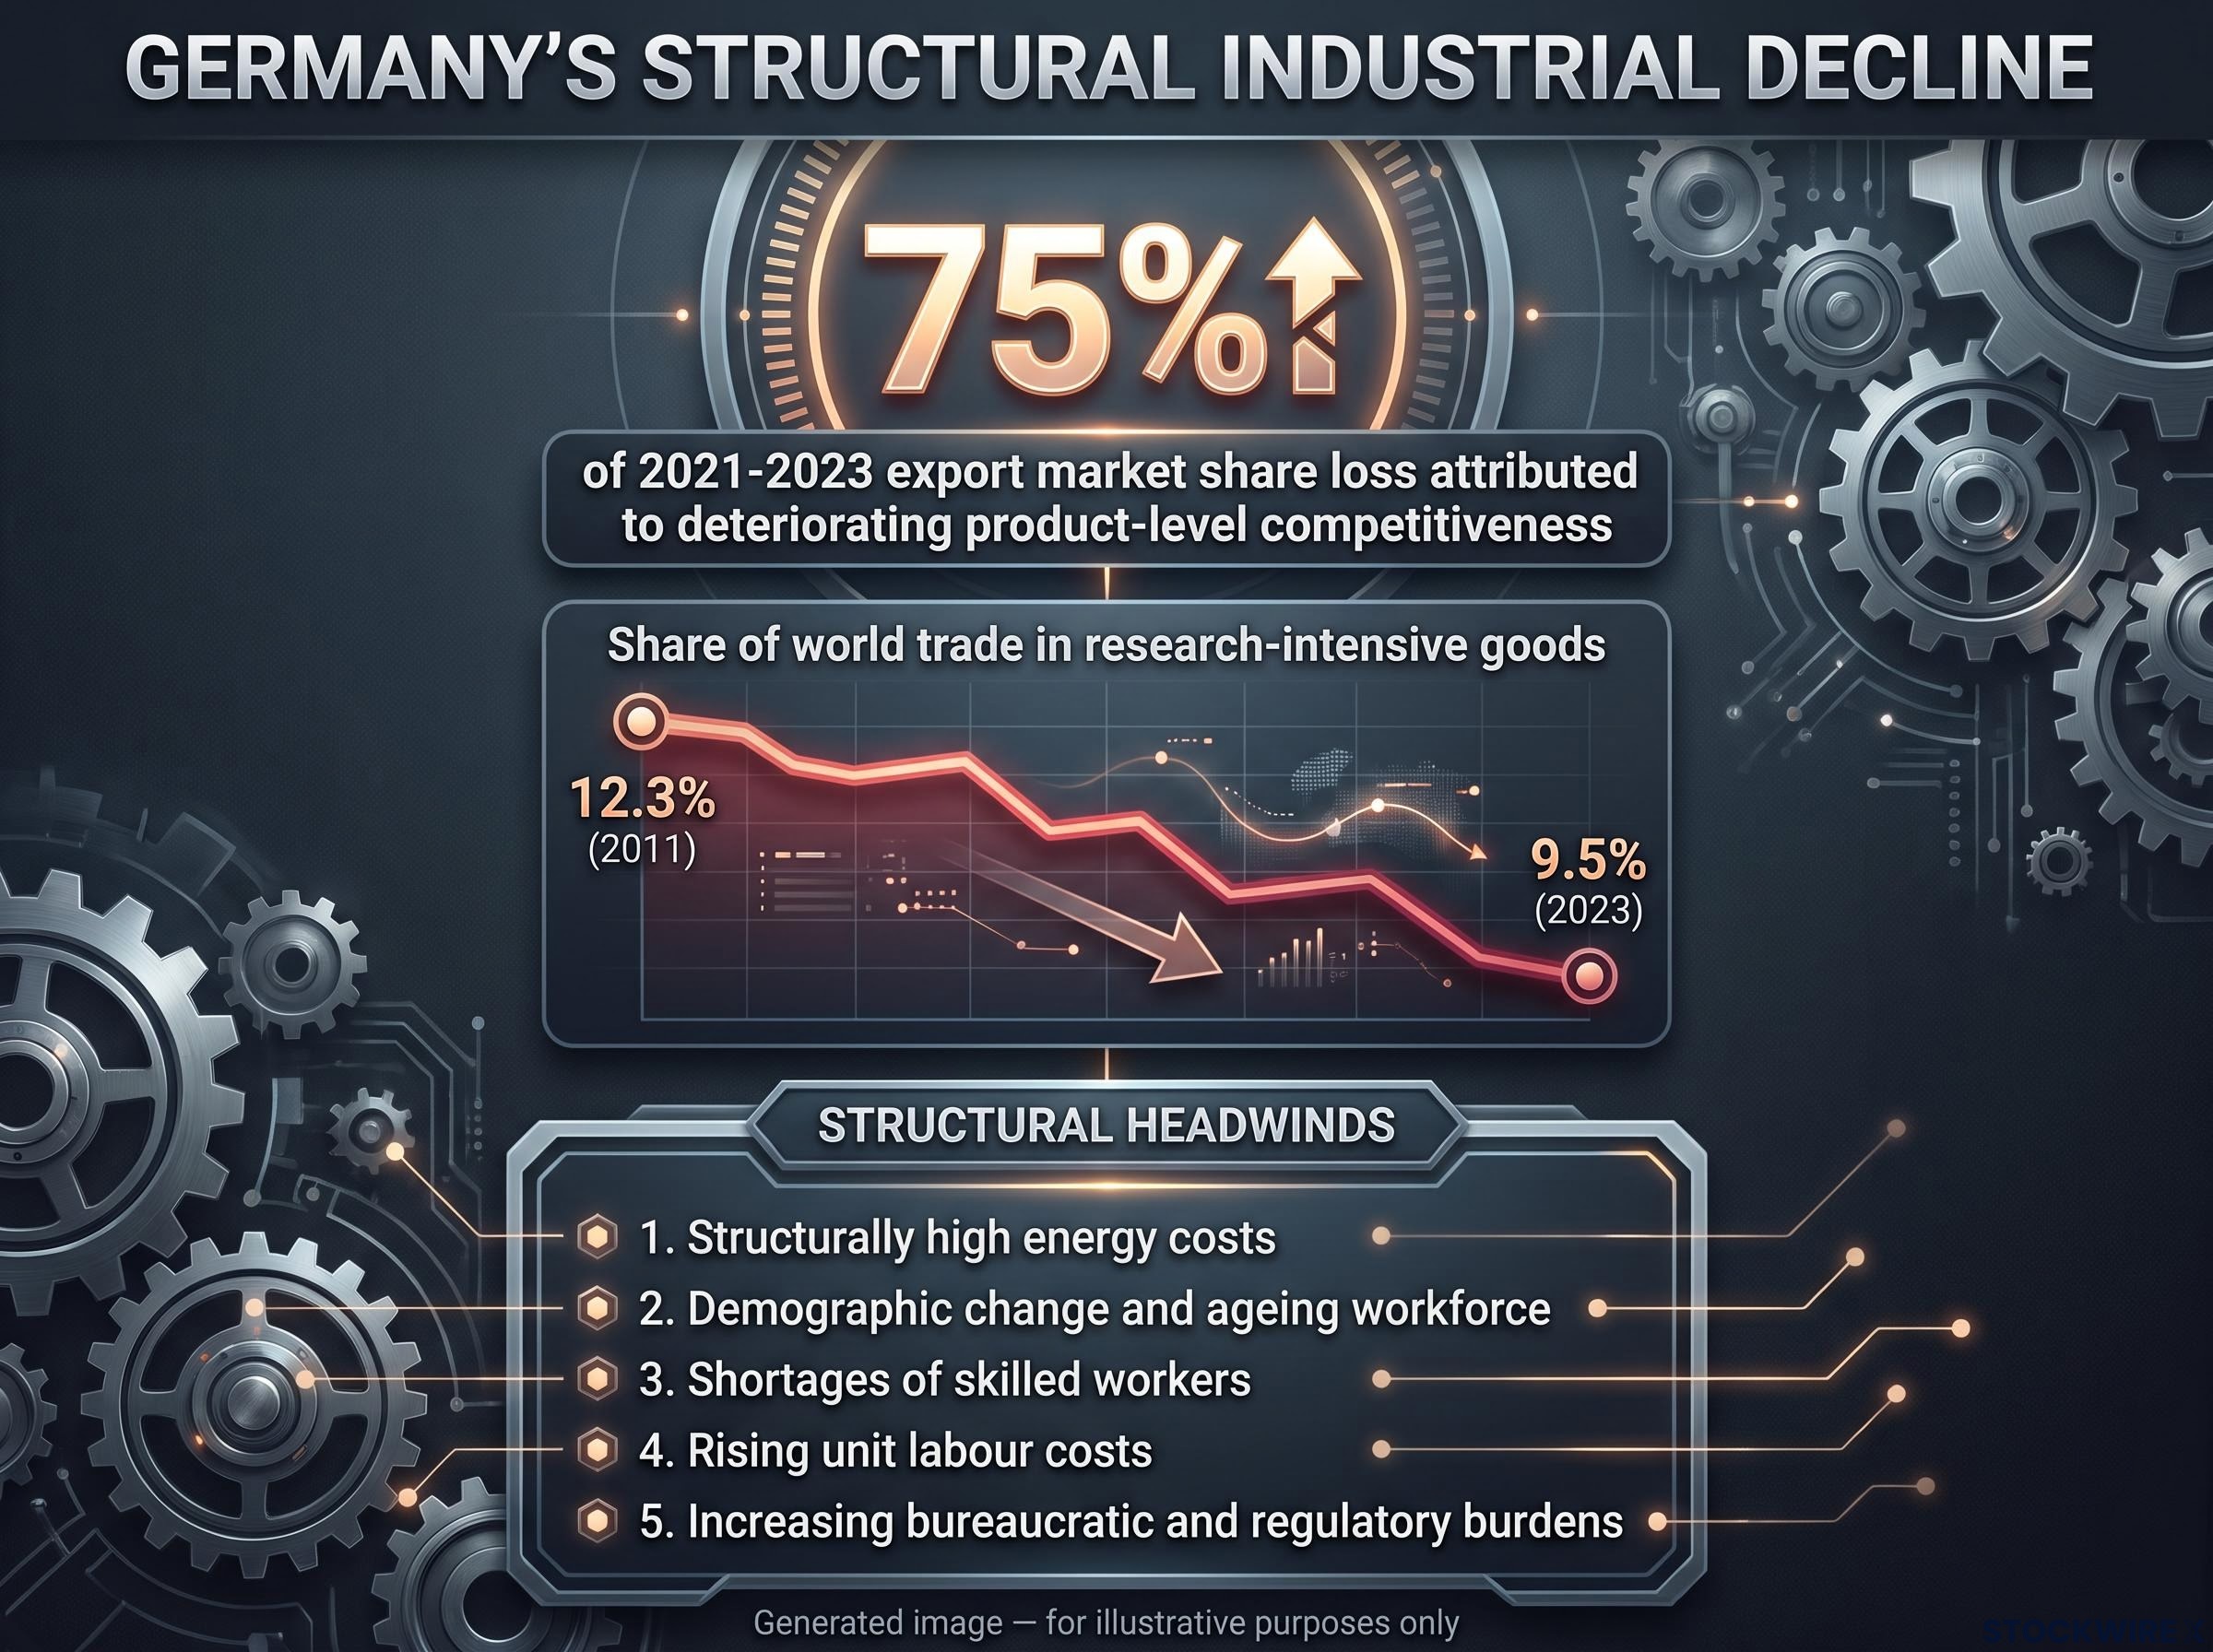
The relative-weight point is not abstract. Germany’s share of world trade in research-intensive goods fell from 12.3% in 2011 to 9.5% in 2023, according to the BMWK Annual Economic Report 2025, a concrete measure of how much its competitive standing shapes the bloc’s export story.
Why the ECB connection matters
Here is the feature that makes German weakness stickier for the euro than it would be for a country with its own central bank. When a standalone economy weakens, its central bank can cut rates to cushion the blow, and that cut can support demand and, sometimes, offset currency softness. Germany has no such lever.
The ECB responds to euro-area aggregates, not German-specific conditions, so German softness tends to be priced into the euro as a growth discount rather than met with a targeted policy response. That is why this kind of weakness acts as a more persistent drag on EUR than comparable weakness would for a currency backed by its own monetary authority. It also sets up the sterling side of the trade, where the Bank of England’s policy room becomes part of the story.
A bad week or a broken engine? Germany’s structural industrial decline
One weak month can be noise. The reason this week’s data matter is that they extend a trend that has been building for years, not quarters.
The BMWK Annual Economic Report 2025 states that German industrial production has been on a downward trajectory since 2018, with especially steep declines in energy-intensive sectors since the 2022 energy-price shock. Read against that backdrop, July’s 1.1% drop is a continuation, not an outlier.
The automotive sector restructuring announced by Volkswagen, targeting up to 100,000 positions and the closure of German plants, represents the same supply-side competitiveness erosion the Bundesbank attributes to deteriorating product-level performance rather than weak external demand.
The competitiveness data sharpen the point. The Bundesbank finds that German export market shares have been contracting since 2017 and accelerating since 2021. That could still be a demand problem, a world buying fewer German goods. The Bundesbank closes that door.
More than three-quarters, over 75%, of Germany’s 2021 to 2023 export market share loss is attributed to deteriorating product-level competitiveness across sectors rather than weak external demand, according to the Bundesbank Monthly Report of July 2025.
That is the single most important finding in the structural case. It tells you that even if global demand recovers, Germany’s export engine may not respond the way it once did, because the problem is on the supply side. The Bundesbank and BMWK name the specific headwinds a recovery would have to overcome:
- Structurally high energy costs relative to international peers
- Demographic change and an ageing workforce
- Shortages of skilled workers
- Rising unit labour costs
- Increasing bureaucratic and regulatory burdens
None of these reverse on a single good data print. They are the kind of obstacles that take years and credible reform to shift, which is why the official diagnosis increasingly leans on the word structural rather than cyclical.
For anyone holding euro assets or trading EUR/GBP, that distinction changes the time horizon. Cyclical weakness fades with the business cycle. Structural weakness tends to compress a currency’s equilibrium range over years, because it lowers the economy’s expected growth path and, with it, the euro’s growth premium. You are not looking at a dip that snaps back next quarter. You are looking at a discount that may need reform or structurally lower energy prices to lift.
Sterling’s role, and the two scenarios that decide where EUR/GBP goes next
So far this has read as a Germany problem. It is not. EUR/GBP is a two-sided pair, and the sterling side carries constraints that cap how far the euro can actually fall against the pound.
The UK has its own fiscal subplot. Ahead of the 28 October Budget, signals from the Chancellor pointed to a mix of tax increases and spending cuts, and analysts estimate that elevated borrowing costs have roughly halved the government’s fiscal headroom.
UK fiscal headroom has been cut by around half to approximately £12 billion by higher borrowing costs, according to Brown Brothers Harriman, a constraint that limits how much room the Chancellor has before further tightening becomes necessary.
UK gilt yield dynamics carry a specific structural buffer that the fiscal headroom figure alone does not capture: with an average debt maturity of 13.9 years, short-term yield spikes feed through to the government’s actual interest bill far more slowly than the fiscal headlines around the October Budget tend to imply.
The monetary side reinforces it. Brown Brothers Harriman (BBH) strategists point out that the Bank of England’s policy rate sits above the midpoint of its estimated neutral range of 2% to 4%, that a UK output gap exists, and that tighter fiscal policy collectively reduces the case for further monetary tightening. Sterling’s support from rate differentials may therefore be more limited than it looks.
That is the underappreciated part of the equation. UK fiscal tightening means the euro does not need to recover on its own merits to push EUR/GBP higher. If sterling weakens on a fiscal squeeze, the pair can climb even while Germany stays soft, which changes the risk and reward for anyone positioned on sterling strength against the euro.
| Scenario | Key conditions | EUR/GBP implication |
|---|---|---|
| A: Structural EUR weakness persists | German competitiveness keeps eroding, euro-area growth drifts toward Germany’s trajectory | Trades in or below the current range, discount extends |
| B: Euro-area resilience plus UK fiscal drag | Aggregate euro-area growth holds, Germany reforms or benefits from lower energy costs, UK Budget tightens | Pushes back toward and through 0.8600 |
Neither scenario is a certainty. What you have are the two variables that matter most, the German structural trajectory and the UK fiscal outcome, and a pair that will tell you in real time which force is winning.
The levels that matter in EUR/GBP right now
The near-term resistance is 0.8600, the level that already rejected the pair once this trading week. The support zone sits at 0.8568 to 0.8580, defined by the 2 September intraday low and the current spot area, and confirmed by ECB reference rates that ranged from 0.85655 on 1 September to 0.86055 on 3 September before settling at 0.85898 on 4 September.
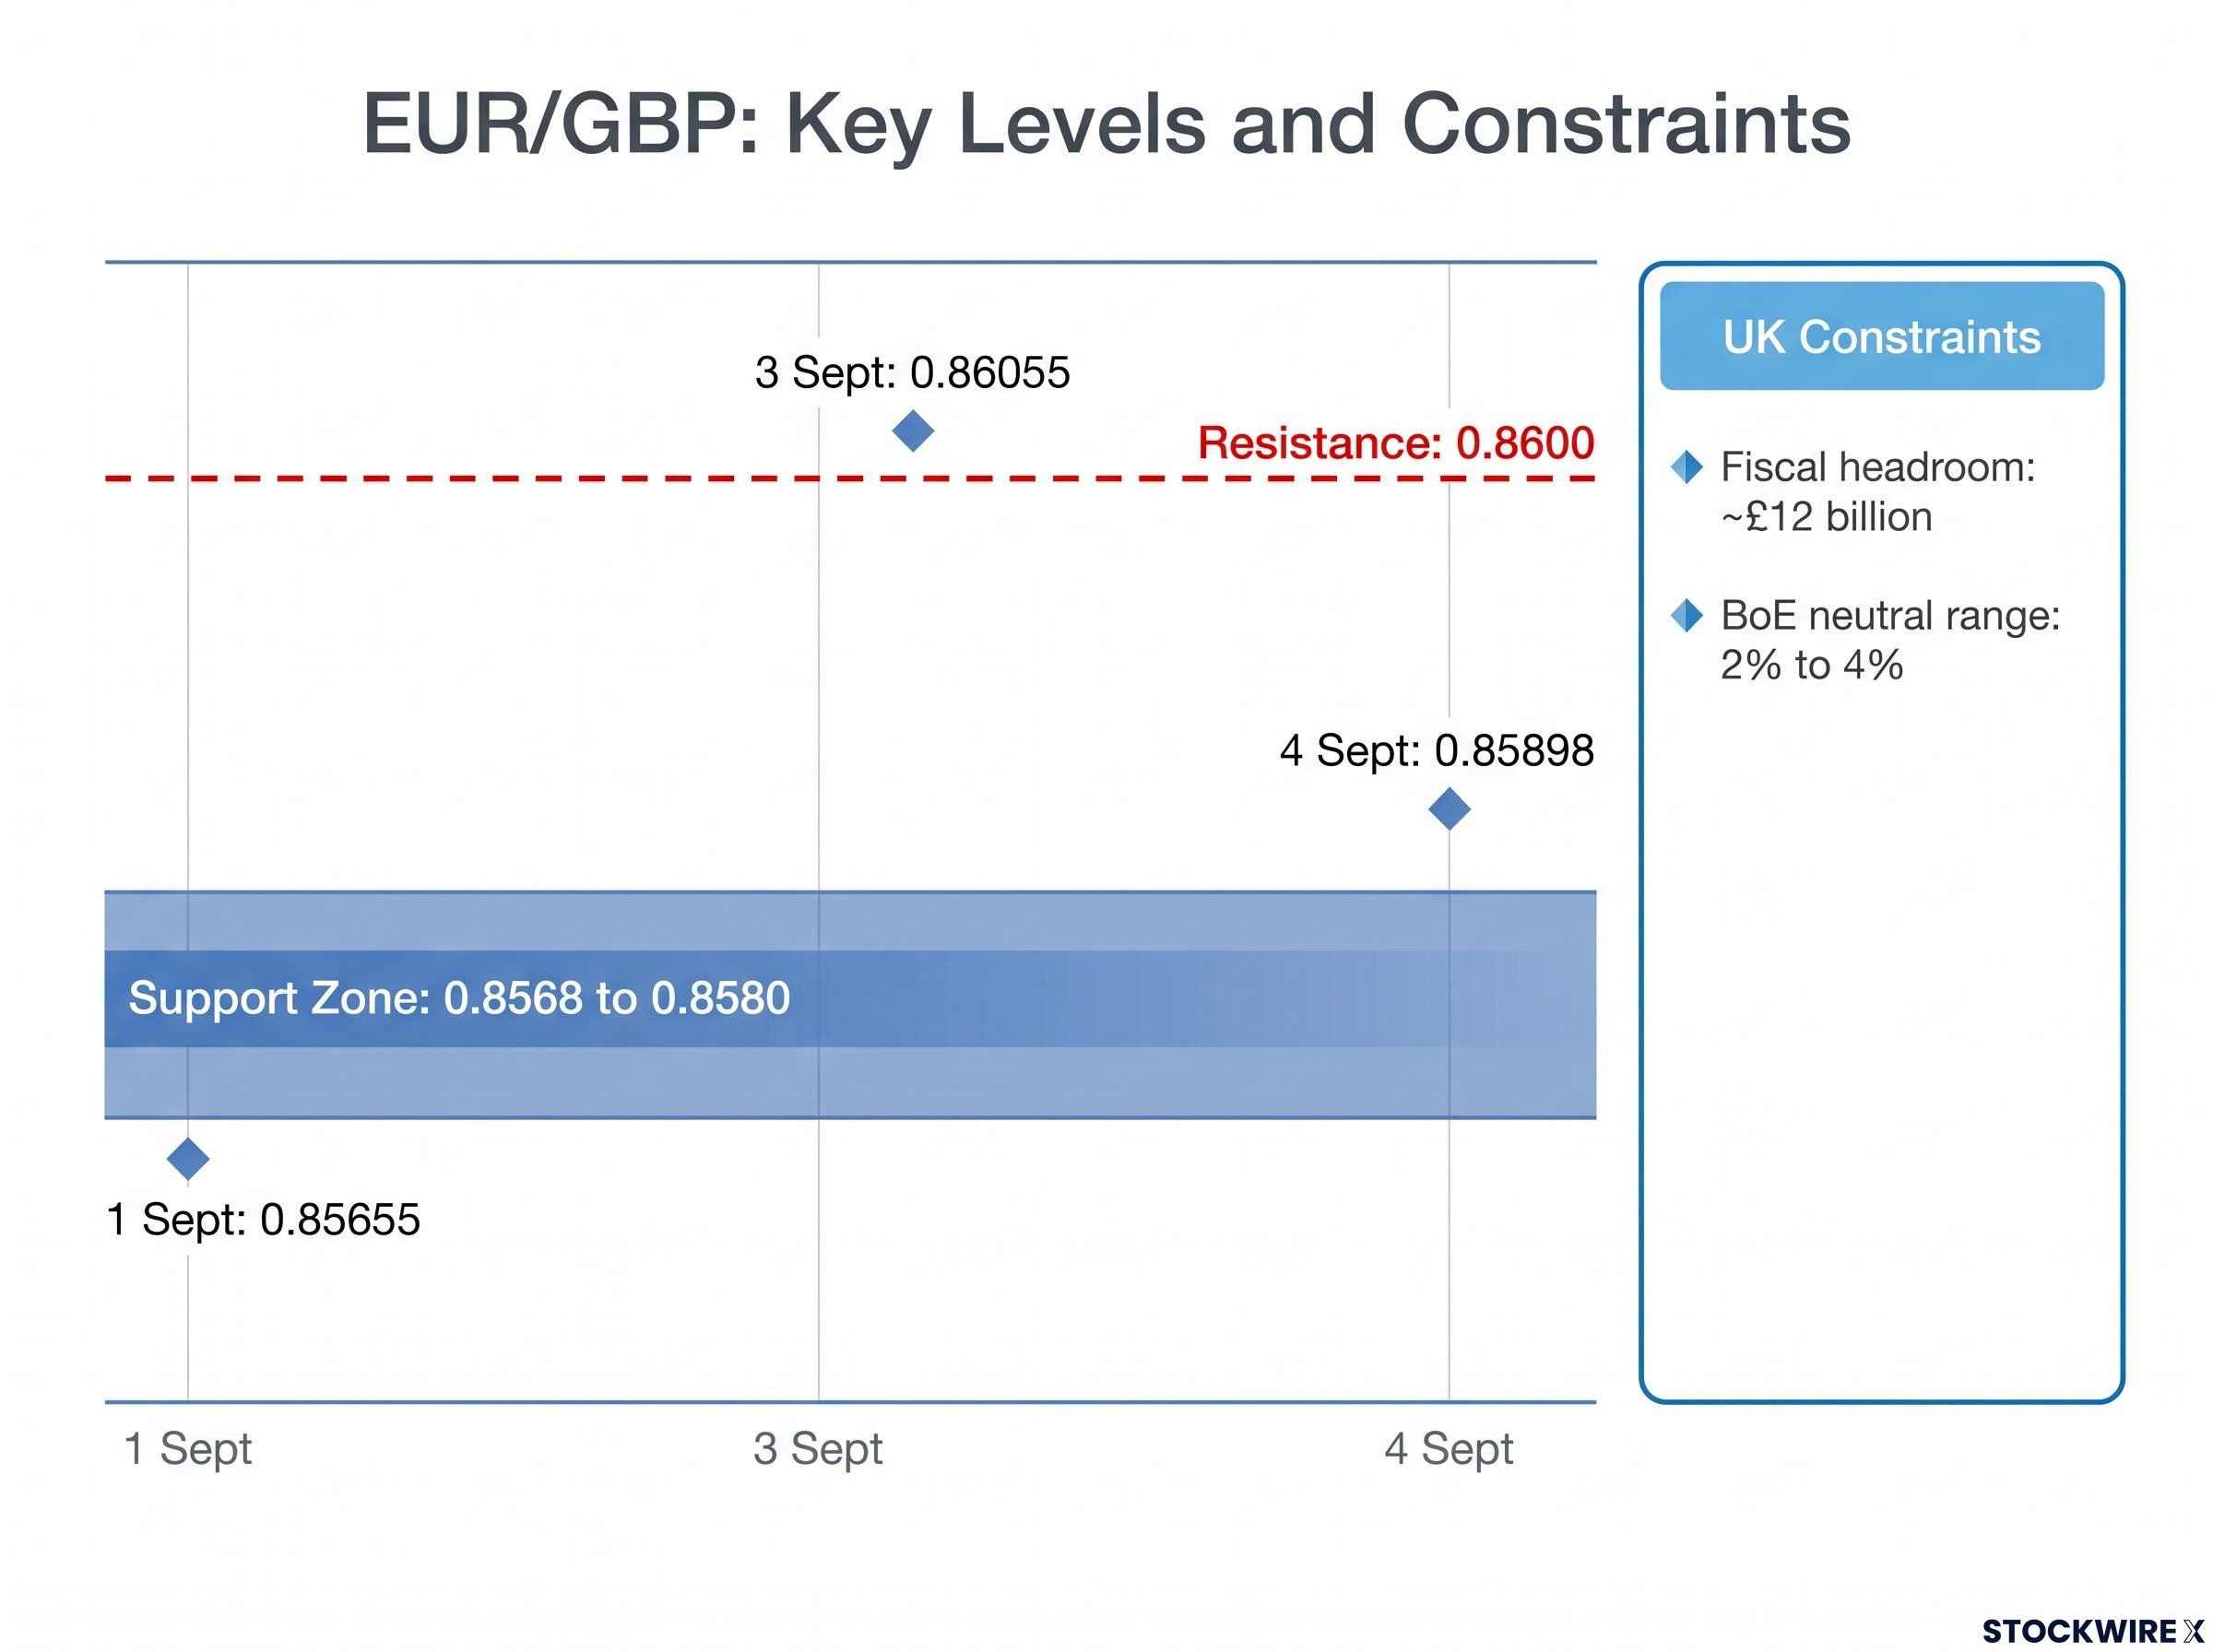
A sustained break above 0.8600 would be an early signal that Scenario B conditions are asserting themselves. A break below 0.8568 would reinforce Scenario A and extend the structural discount thesis.
When the headline misleads and the details decide
Two lessons carry beyond this week. A wider trade surplus built on a 5.7% import collapse is a weakness signal, not a strength signal. And a positive Eurozone GDP revision does not override a Germany-specific structural deterioration in how currency markets set prices.
From here, watch two things. The first is whether Germany’s export market shares stabilise, the credible test of whether the industrial engine is repairing. The second is the 28 October UK Budget, with EUR/GBP price action around 0.8600 and 0.8568 serving as the market’s live verdict on which force is winning.
The portable principle is simple. When a headline looks good but the composition points to weakness, trust the composition, because that is what the currency market is pricing. Aggregate economic figures often obscure the structural signals that actually move a pair, and the skill worth building is knowing which level of data granularity the market is treating as the signal.
Trade balance composition carries the same interpretive lesson across economies: the US May 2026 deficit that looked alarming at the headline level was driven by capital goods and vehicle imports, a spending and investment signal rather than a contraction signal, illustrating how the same analytical discipline applied to Germany’s import collapse applies globally.
This article is for informational purposes only and should not be considered financial advice. Investors should conduct their own research and consult with financial professionals before making investment decisions. These scenarios are speculative and subject to change based on market developments, and past performance does not guarantee future results.