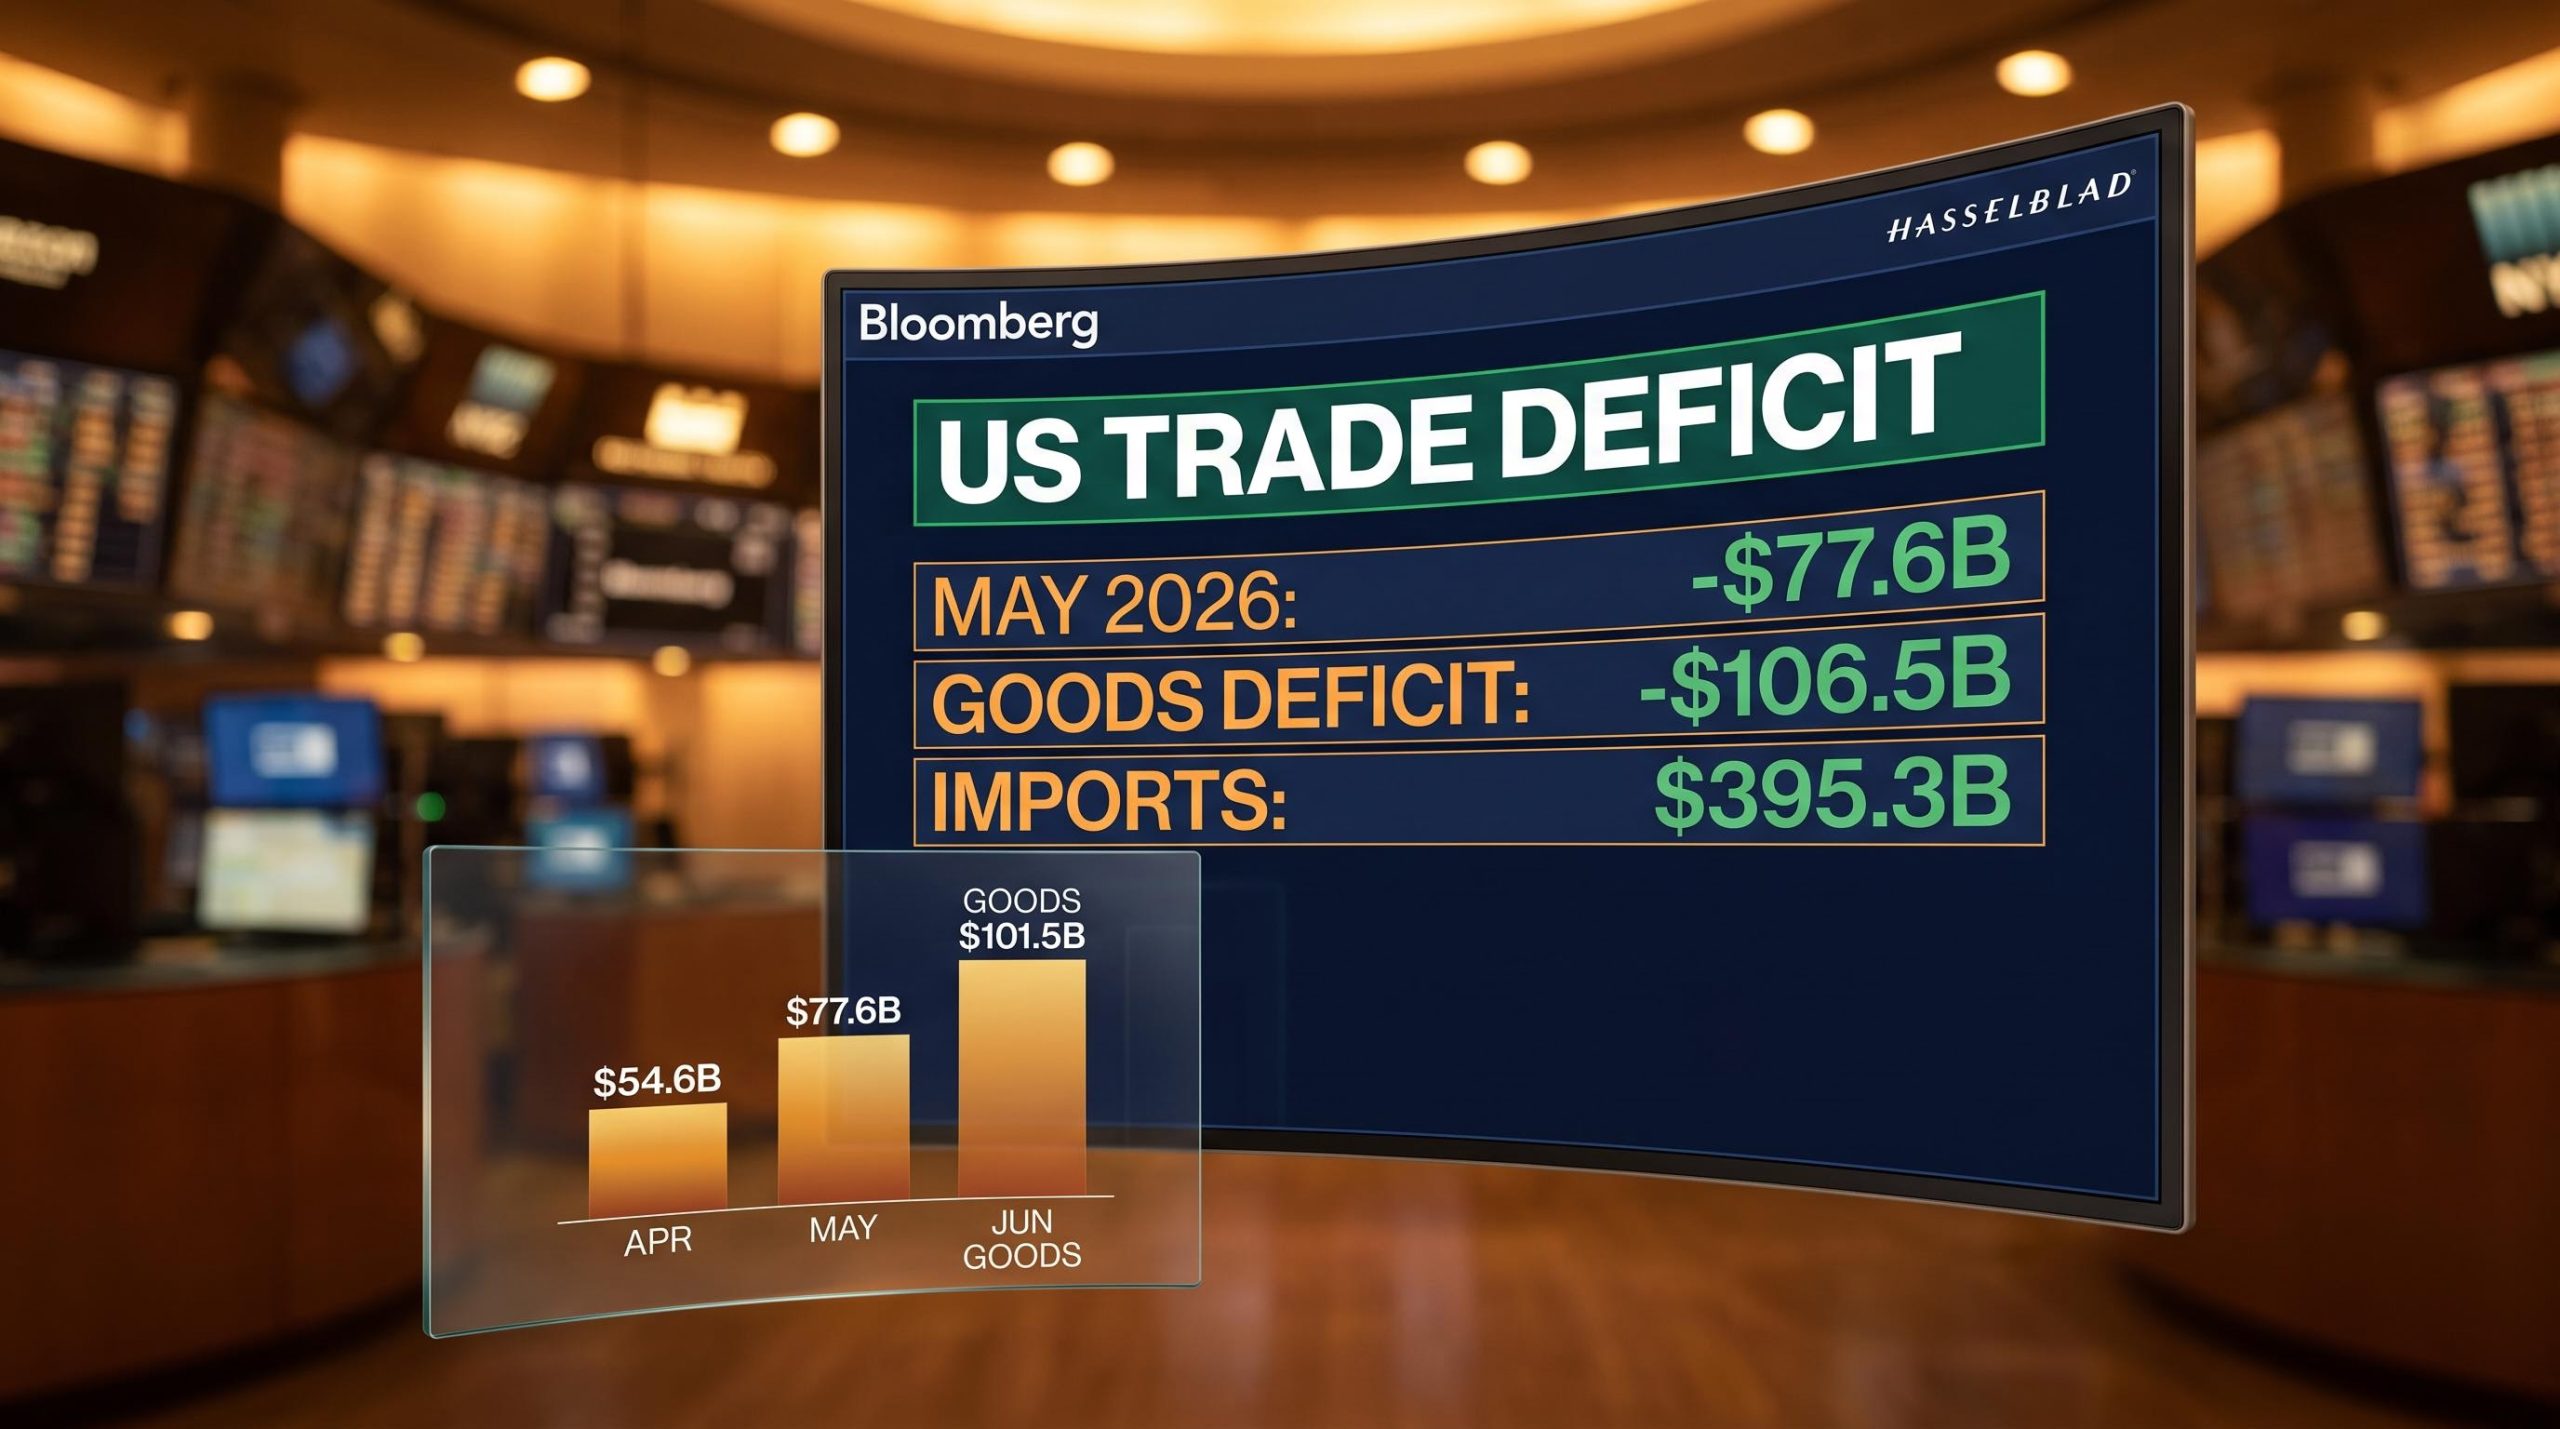
A $77.6 billion trade deficit sounds like a problem. The May 2026 print, released on 7 July by the Bureau of Economic Analysis (BEA) and the US Census Bureau, widened by more than $23 billion from April’s revised figure, and every headline treated it accordingly. But the composition of that number tells a story the headlines missed, and it is not the story of an economy in trouble.
The full June 2026 goods-and-services trade balance lands tomorrow, 5 August. When it does, investors will face another large number and another round of commentary framing the deficit as a warning sign. Most of that commentary will focus on the wrong thing. The size of the deficit is not the signal. What is driving it, and where the trend is heading, is.
Here is the analytical lens that changes how you read every trade release from here. This piece breaks down the mechanism behind the deficit, walks through the May and June data category by category, calibrates the tariff effect, and gives you a three-question framework for evaluating the August 5 print on your own terms.
How national trade accounting differs from personal finance
The assumption is understandable: a country running a $77.6 billion monthly trade deficit is spending beyond its means, just like a household carrying more debt than it can service. The intuition feels right. It is also wrong.
A household that consistently spends more than it earns faces a hard constraint. It cannot print its own currency, and it cannot issue financial claims that the rest of the world wants to hold. A country issuing the world’s reserve currency operates under structurally different conditions.
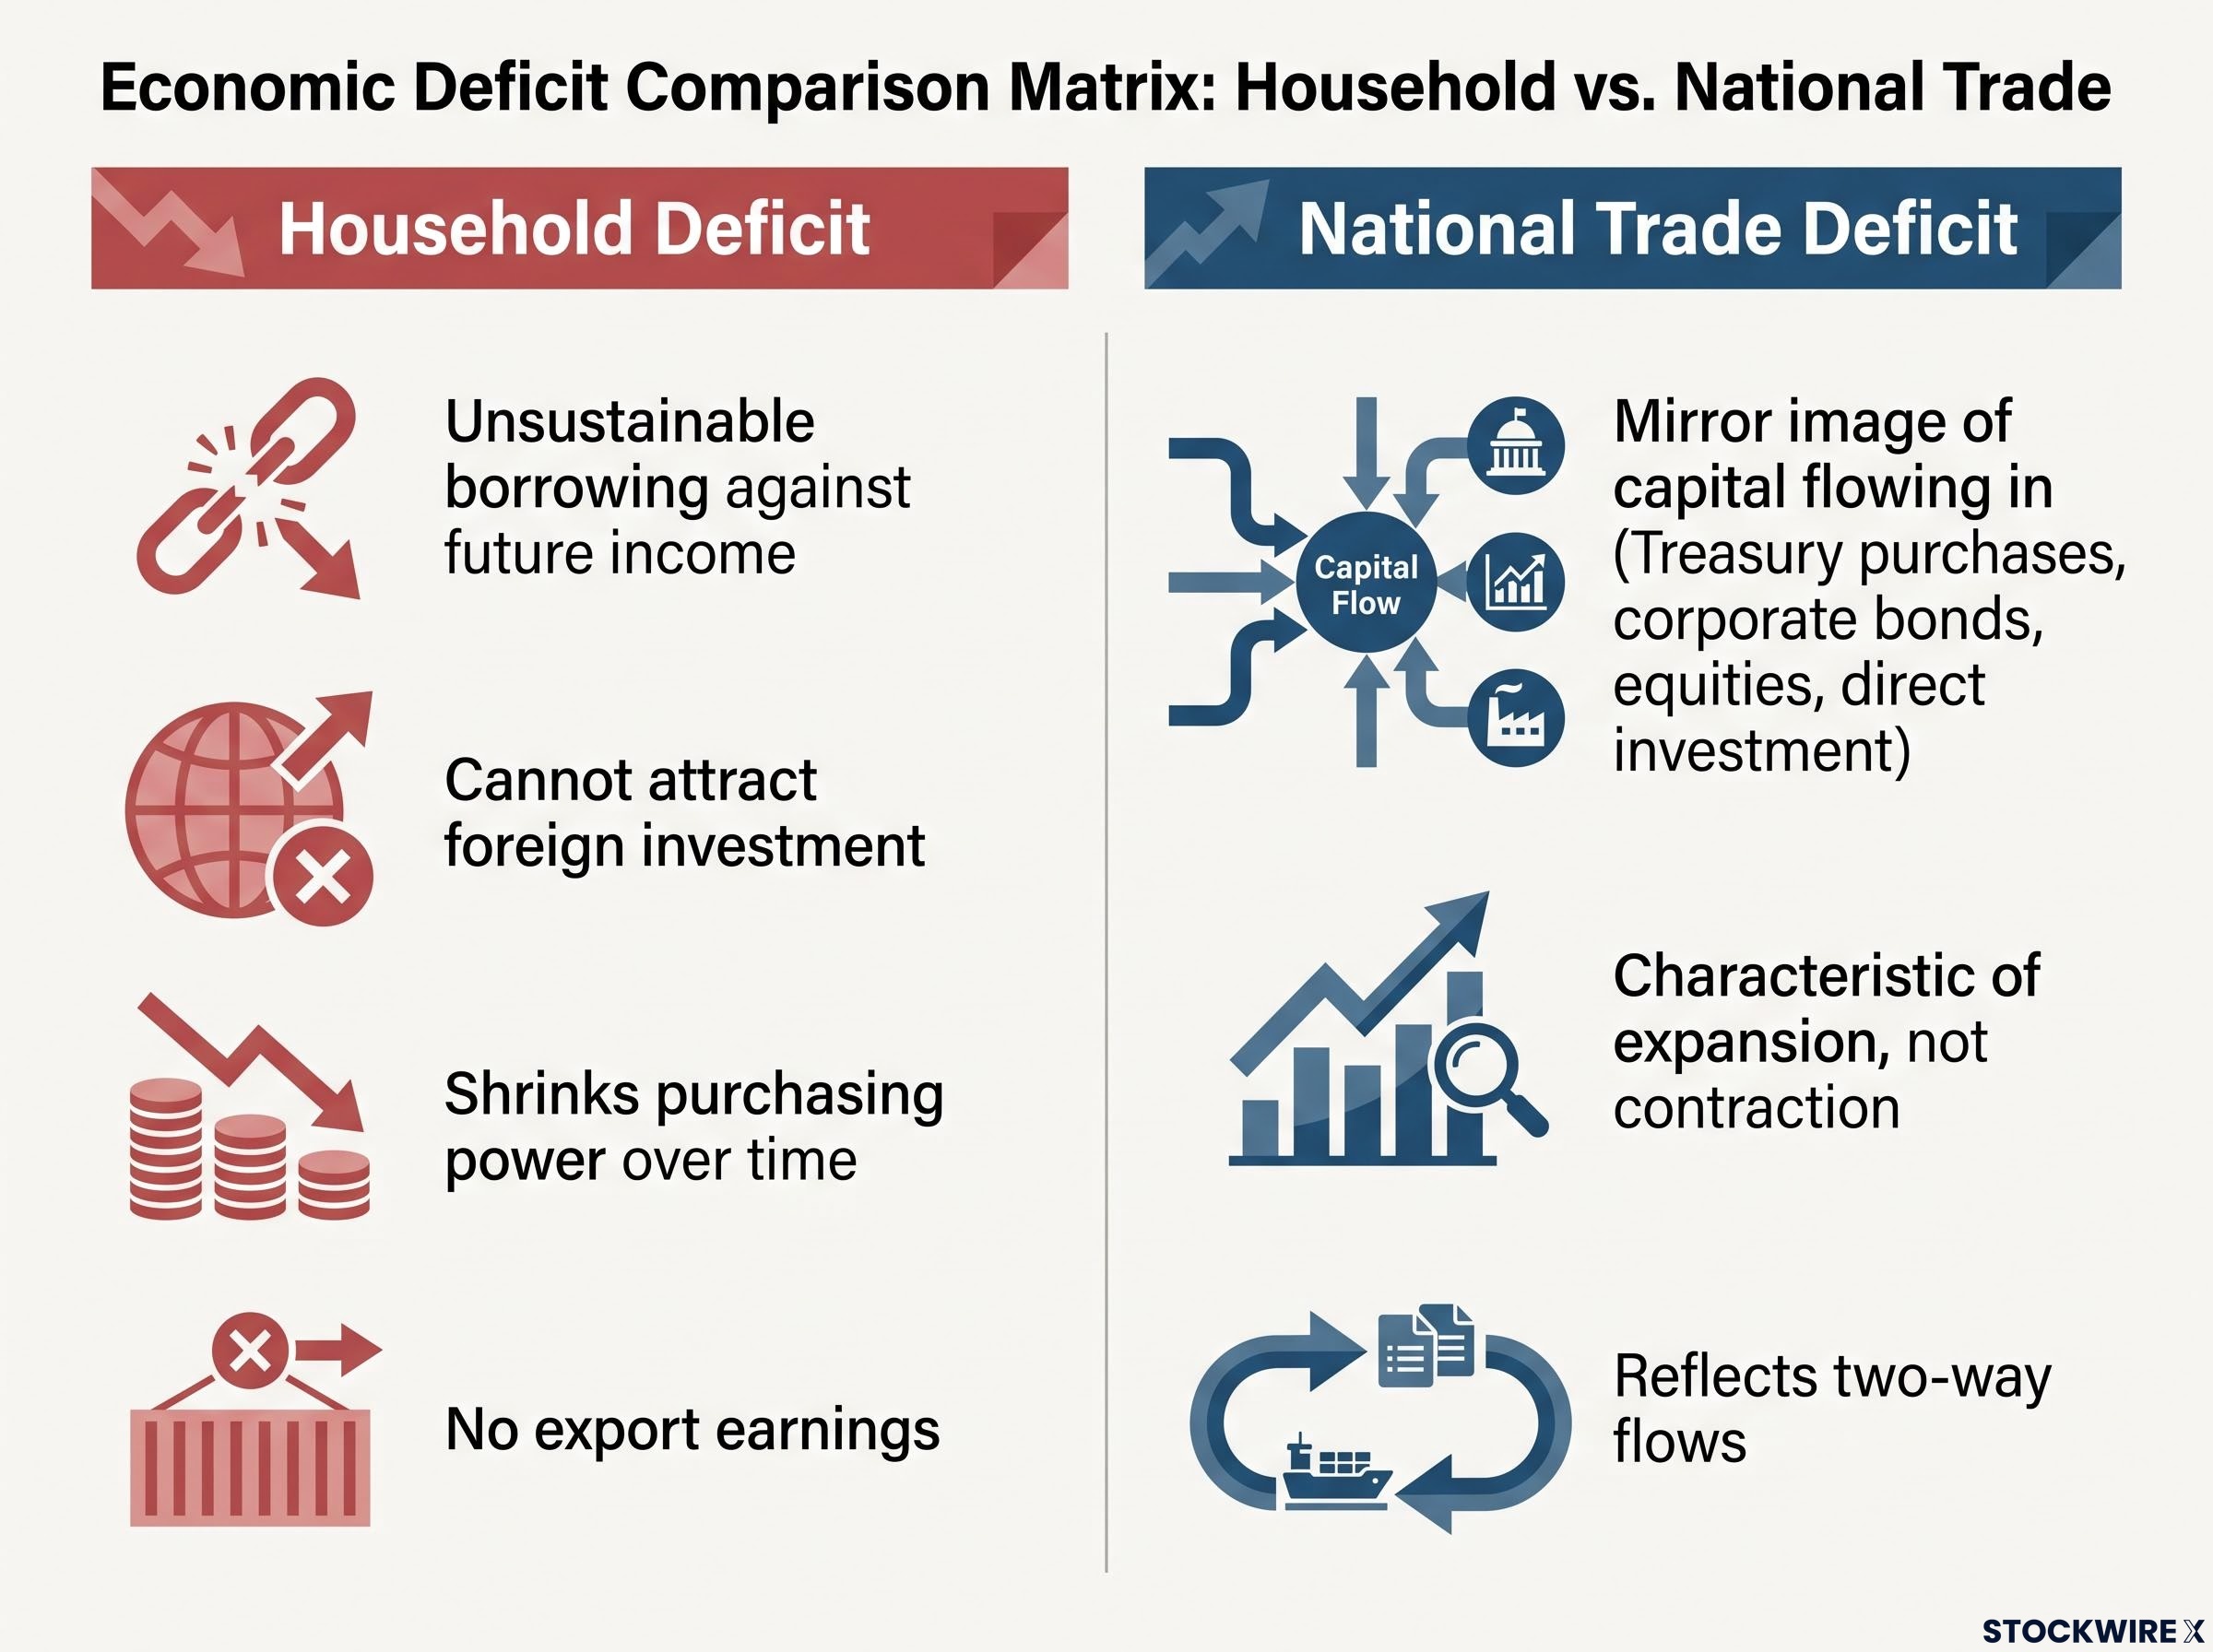
The key differences:
- A household deficit means unsustainable borrowing against future income. A national trade deficit is the mirror image of capital flowing into the country.
- A household cannot attract foreign investment to offset its spending. The US attracts hundreds of billions in Treasury purchases, equity investment, and direct investment annually.
- A household deficit shrinks purchasing power over time. A national deficit driven by consumption and investment spending is characteristic of expansion, not contraction.
- A household has no export earnings to offset imports. A nation’s trade balance reflects two-way flows where both sides carry information.
How global capital flows complete the picture
When the US runs a trade deficit, the offsetting entry in the national accounts is capital flowing into the US from abroad. Foreigners who sell goods and services to American consumers and businesses acquire dollars, and those dollars flow back as purchases of US Treasuries, corporate bonds, equities, and direct investment in American companies.
According to Fisher Investments, the trade deficit is not insolvency; it is a funding relationship with global capital markets. A larger deficit typically means domestic spending, including consumption, investment, and government expenditure, is running ahead of domestic production. That pattern tracks expansions, not recessions. The implication for you: stop treating a large deficit headline as automatic bad news and start asking what is driving the import side.
Foreign capital flows into US assets are the offsetting entry that makes the trade deficit arithmetically coherent, but foreign ownership of US equities has now reached approximately $16.9 trillion, a concentration level that Capital Economics identifies as a procyclical amplifier in any correction scenario.
When big ASX news breaks, our subscribers know first
What the May numbers are actually telling you
The headline shift was significant. The total goods and services deficit widened from $54.6 billion in April (revised) to $77.6 billion in May. The goods deficit alone reached $106.5 billion, the highest level since the March 2025 record. Total imports hit $395.3 billion, with goods imports climbing to their highest point since that same March 2025 peak.
Now look at what was actually being imported. The primary drivers were capital goods, passenger vehicles, crude oil, and consumer goods spanning pharmaceuticals through to mobile handsets. These are not the categories of an economy under stress. An economy contracting under pressure shows falling consumer imports, collapsing capital equipment orders, and plunging energy consumption. The May data showed the opposite.
| Period | Goods & services deficit | Goods deficit | Total imports | Key notes |
|---|---|---|---|---|
| April 2026 | $54.6B (revised) | — | — | Prior month baseline |
| May 2026 | $77.6B | $106.5B | $395.3B | Full BEA/Census release, 7 July |
| June 2026 (advance goods) | — | $101.5B | $306.2B (goods) | Advance Census report, 28 July |
$395.3 billion in May imports represents goods imports at their highest level since the March 2025 tariff-front-loading peak, a one-off distortion explicitly not what drove May 2026.
Consumer goods, phones, autos, and capital equipment are the import categories of an economy that is spending and investing. The headline number’s size is almost irrelevant compared to the composition breakdown, which is the real analytical signal in every trade release.
The import categories driving the May deficit, vehicles, pharmaceuticals, and consumer electronics, are the same categories generating household tariff costs estimated at $1,830 to $2,600 annually, making the composition of the deficit directly relevant to the cost pressures American consumers are already navigating.
Tariffs in context: measuring the drag, not the disaster
Tariffs are a legitimate concern. Fisher Investments characterises them as a net economic negative and a drag on real GDP growth. That assessment is fair, and dismissing it would be dishonest. The question is whether “drag” means the same thing as “crisis trigger.” The data say it does not.
The sequence matters:
- Tariff increases were announced in early 2025, prompting importers to front-load purchases.
- That front-loading produced a record goods deficit in March 2025, a one-off distortion that inflated the data.
- As the front-loading effect unwound, the deficit normalised through subsequent months.
- Firms adapted, adjusting supply chains and pricing strategies. Broader market reaction remained relatively subdued.
Fisher Investments’ position: the tariff levels currently in place fall well short of what would be needed to bring the bull market to an end.
The distinction between “tariffs are a drag” and “tariffs are a crisis trigger” is the difference between trimming a growth rate and ending an expansion. The current data sit firmly in the former category. If you conflate tariff noise with structural economic risk, you will misread every deficit print that arrives after a tariff announcement.
GDP drag is arithmetic, not alarm
Here is how the trade deficit feeds into GDP, broken into three steps:
- The identity equation. GDP equals consumption plus investment plus government spending plus net exports. Net exports equal exports minus imports. When imports exceed exports, net exports are negative, and that negative number subtracts from the GDP total.
- What subtracts from growth. A persistent trade deficit means net exports mechanically reduce the reported GDP growth rate. This is accounting, not economics. It tells you nothing about whether the economy is healthy or sick.
- What conditions would make that subtraction genuinely concerning. The drag becomes a real warning only if accompanied by deteriorating domestic demand, falling household incomes, or signs of funding stress, meaning foreign investors pulling back from US assets. None of those conditions characterise the current data.
The BEA expenditures approach to GDP confirms the C+I+G+X-M identity, with imports subtracted as a mechanical accounting step, which is exactly why a widening deficit reduces the reported growth rate without necessarily signalling deteriorating economic conditions.
What the year-over-year figures reveal
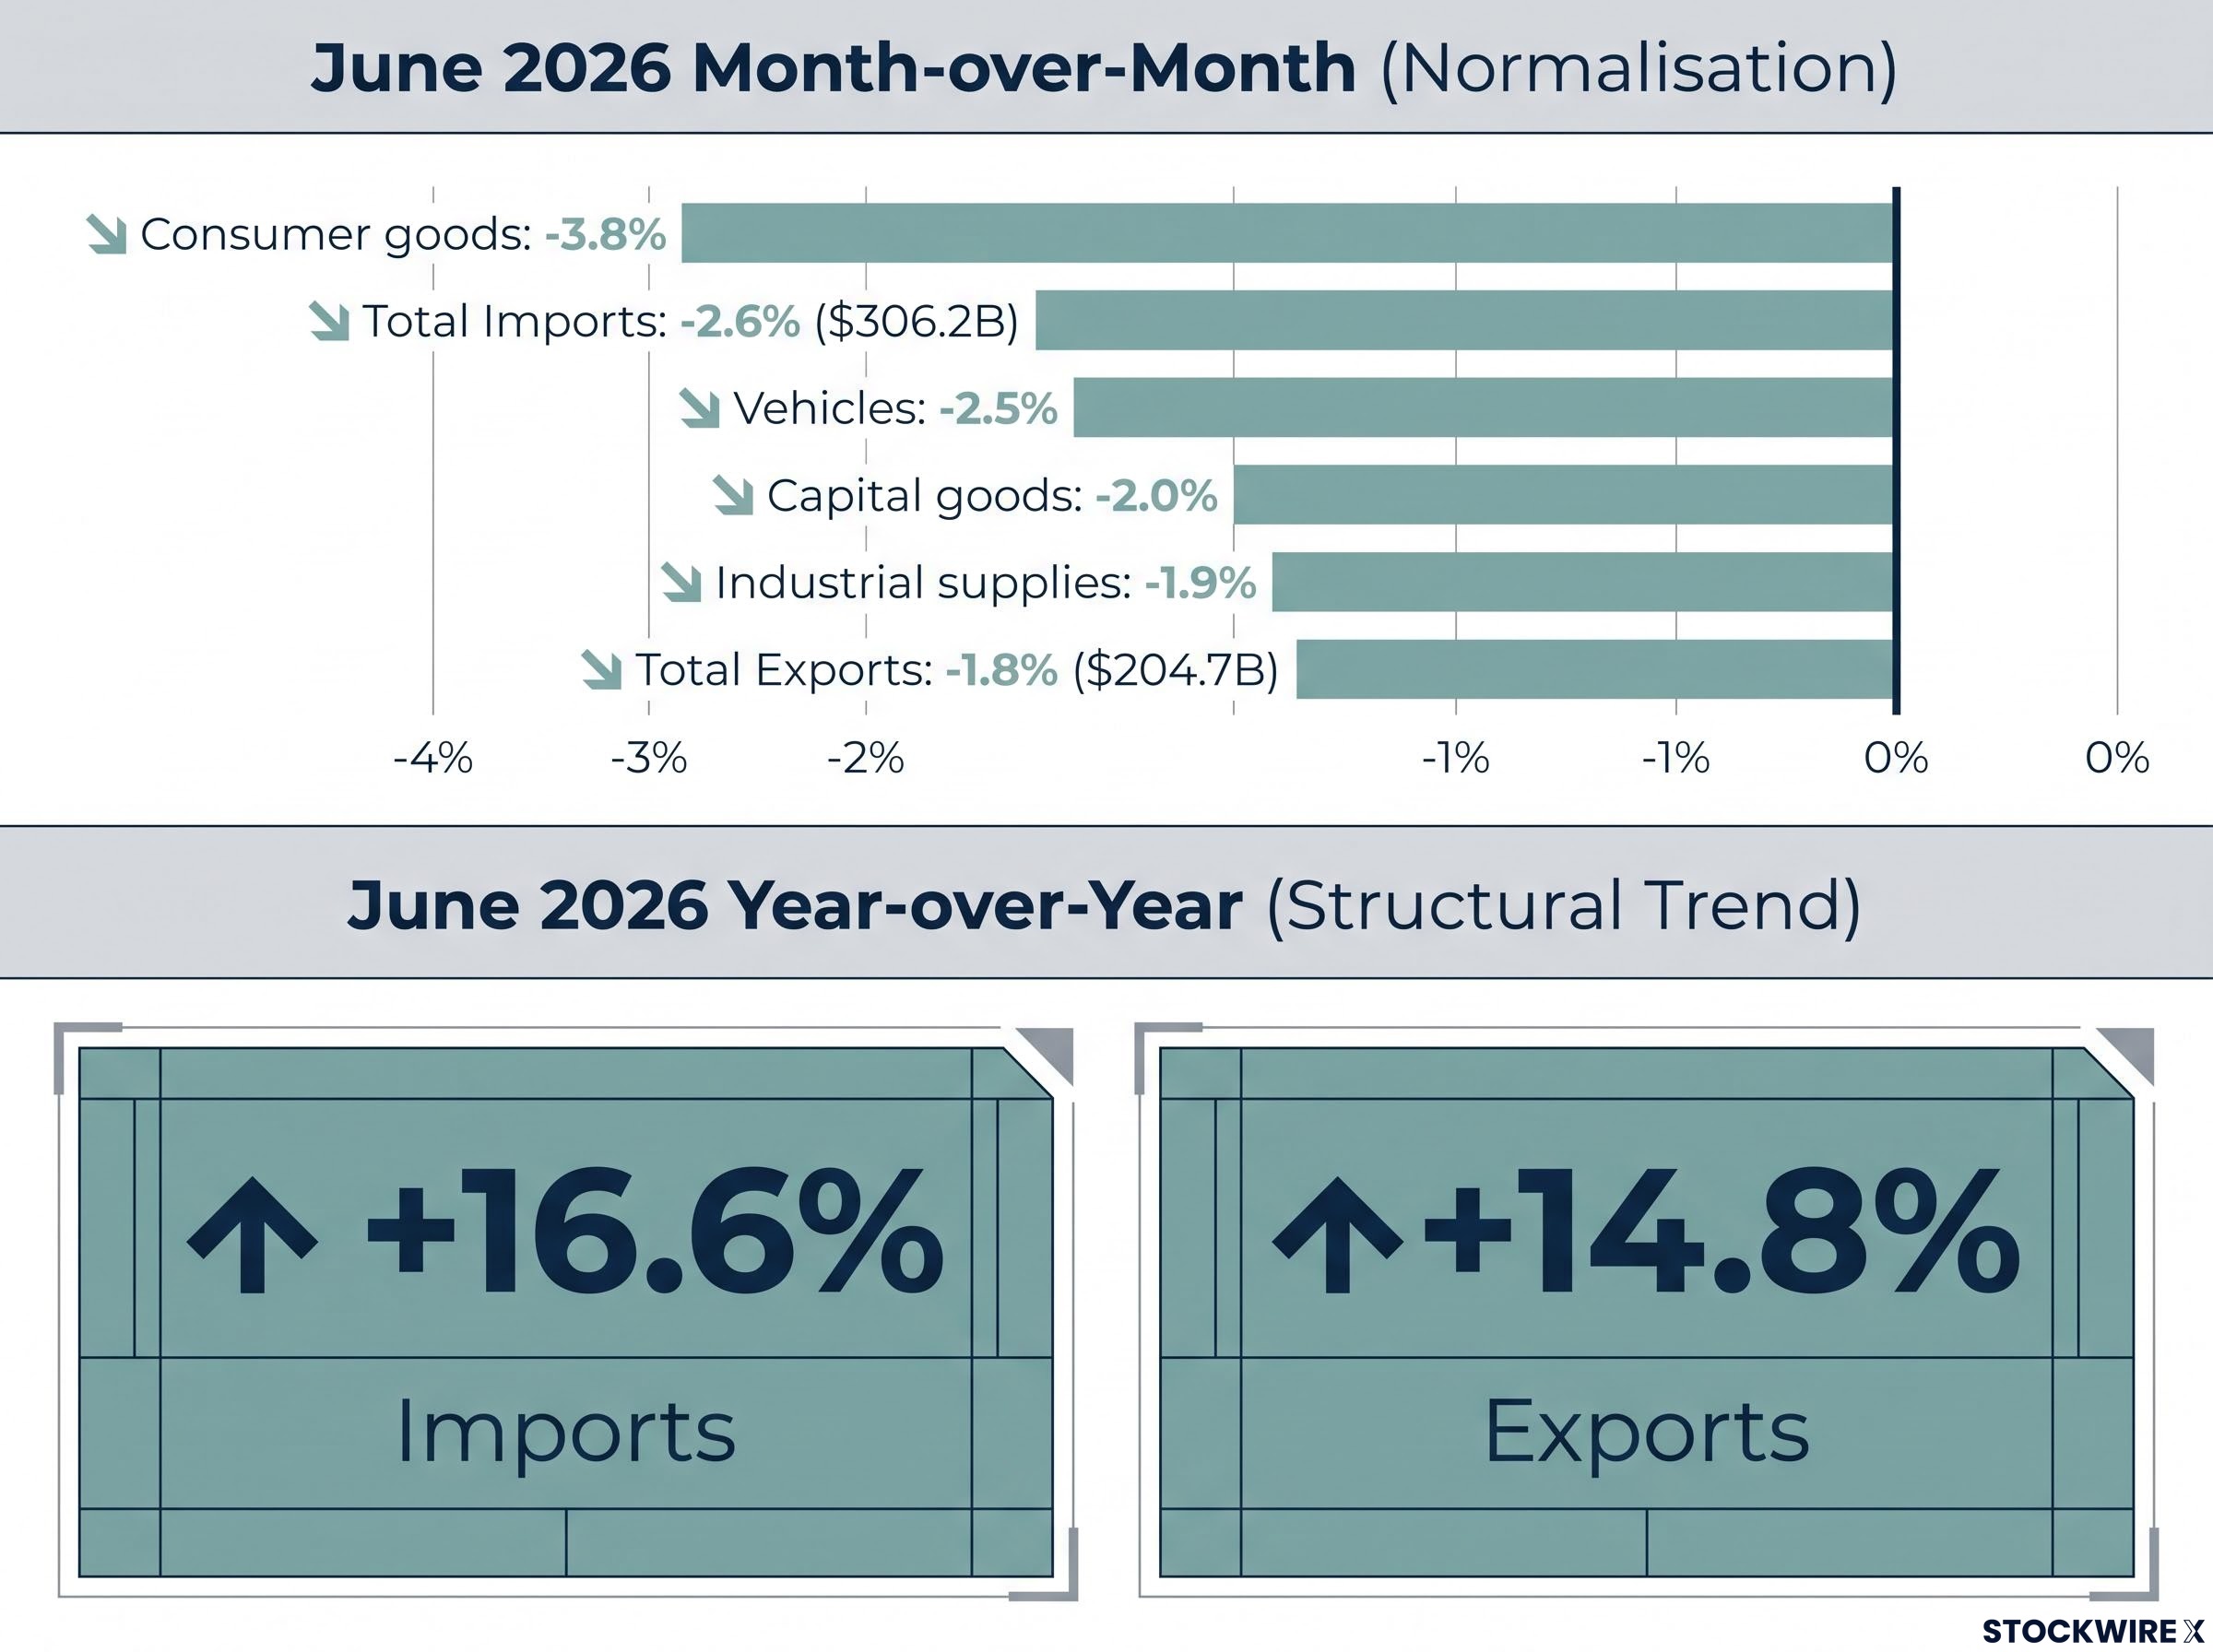
The June 2026 advance goods report provides the trend context that a single monthly print cannot. Imports fell 2.6% month-over-month to $306.2 billion, the first monthly decline since January. Exports fell 1.8% to $204.7 billion.
Those monthly declines, taken alone, might look worrying. The year-over-year figures tell a completely different story. Imports were up 16.6% from a year earlier. Exports were up 14.8%. Double-digit year-over-year gains in both directions are not the profile of an economy sliding toward contraction. They are the profile of a busy economy where two-way trade is running well above prior-year levels. A single-month dip inside a structurally elevated trajectory is normalisation, not a demand collapse.
Reading the August 5 release with the right framework
The advance goods report released on 28 July already provides the early read. The goods deficit narrowed from $106.5 billion in May to $101.5 billion in June, with broad-based import declines across every major category: consumer goods fell 3.8% month-over-month, capital goods 2.0%, vehicles 2.5%, and industrial supplies 1.9%.
That broad-based but modest decline, inside a high year-over-year base, tells you this is normalisation after May’s elevated print, not a demand deterioration signal. The elevated level of capital goods imports is partly structural: AI-related infrastructure spending continues to support import volumes in ways that are a feature of the current investment cycle, not a distortion.
AI infrastructure import volumes are partly structural: Section 301 tariffs covering 60 countries took effect on 24 July 2026 while mega-cap technology firms simultaneously faced AI capital intensity scrutiny, creating compounding headwinds that affect both the cost of the capital goods being imported and the equity valuations of the companies driving that demand.
Three questions to ask when the August 5 data drops:
- What is driving the import and export movements by category? Consumer goods and capital goods rising means domestic demand is active. Sharp falls across every category simultaneously would warrant closer scrutiny.
- What is the two-to-three month directional trend? The April-May-June sequence ($54.6 billion / $77.6 billion / goods-only $101.5 billion) is far more informative than any single print treated in isolation.
- Is any single category falling sharply enough to signal genuine demand cooling? Broad, moderate declines are not the same as a concentrated drop in one critical area.
| June category | Month-over-month change | Framing |
|---|---|---|
| Consumer goods | -3.8% | Largest decline; normalisation from May spike |
| Capital goods | -2.0% | Still elevated by AI infrastructure spending |
| Vehicles | -2.5% | Modest pullback within elevated base |
| Industrial supplies | -1.9% | Broad-based, not concentrated weakness |
What a $77.6 billion deficit actually means for your investment outlook
Three principles hold across every trade release, not just this one. Composition over headline: a deficit driven by consumer goods and capital equipment tells you about spending and investment, not about economic fragility. Trend over single print: one month’s widening or narrowing is noise; two or three months of consistent direction in volumes and categories is signal. GDP drag versus recession signal: the deficit subtracts from the growth rate calculation, but that arithmetic only becomes a genuine concern when accompanied by falling demand, declining incomes, or capital flight.
The May 2026 print of $77.6 billion arrived in an economy where both imports and exports are running well above prior-year levels, driven by consumer goods, capital equipment, and AI-related investment. Fisher Investments’ position is that the deficit reflects economic strength, not weakness, and the evidence available does not point to conditions that would place the ongoing bull market at risk.
For investors wanting to connect the trade deficit’s capital account mirror to where global investment is actually moving, our deep-dive into global capital flows in 2026 examines how the AI-driven semiconductor cycle is concentrating capital in US chip equities while European markets face structural headwinds, with $86 billion in April inflows anchored by a projected $630-$700 billion infrastructure build.
Tomorrow’s August 5 release will likely generate alarming headlines. The framework you now hold is the reason those headlines deserve scrutiny rather than reaction. Evaluate the print against its composition and year-over-year context, not its raw size relative to the prior month. That is the difference between reacting to noise and reading a signal.
This article is for informational purposes only and should not be considered financial advice. Investors should conduct their own research and consult with financial professionals before making investment decisions. Past performance does not guarantee future results. Financial projections are subject to market conditions and various risk factors.