Following the news is not enough to understand why a currency moves. Most retail traders who watch the Euro do exactly that: they read the headline, note the direction, and assume the explanation is obvious. The Euro is the world’s second most traded currency, generating roughly $2.3 trillion in daily turnover according to the Bank for International Settlements (BIS) 2022 Triennial Survey, and yet the forces behind its price moves are frequently misread even by attentive market participants.
The Euro’s value is not simply a product of “Europe doing well or badly.” It is shaped by an institutional architecture (the European Central Bank), a policy mandate with specific mechanics, a hierarchy of national economies whose data releases carry unequal weight, and structural dynamics like fragmentation risk that most beginners have never encountered. The difference between watching the scoreboard and understanding the game is the difference between reacting to EUR moves and anticipating them.
Here is the framework for understanding all four layers. You will know which ECB decisions move the Euro and why, which economic releases deserve your attention and which you can safely deprioritise, and which structural signals professionals monitor that rarely appear in beginner-level coverage.
The Euro’s footprint in global FX markets
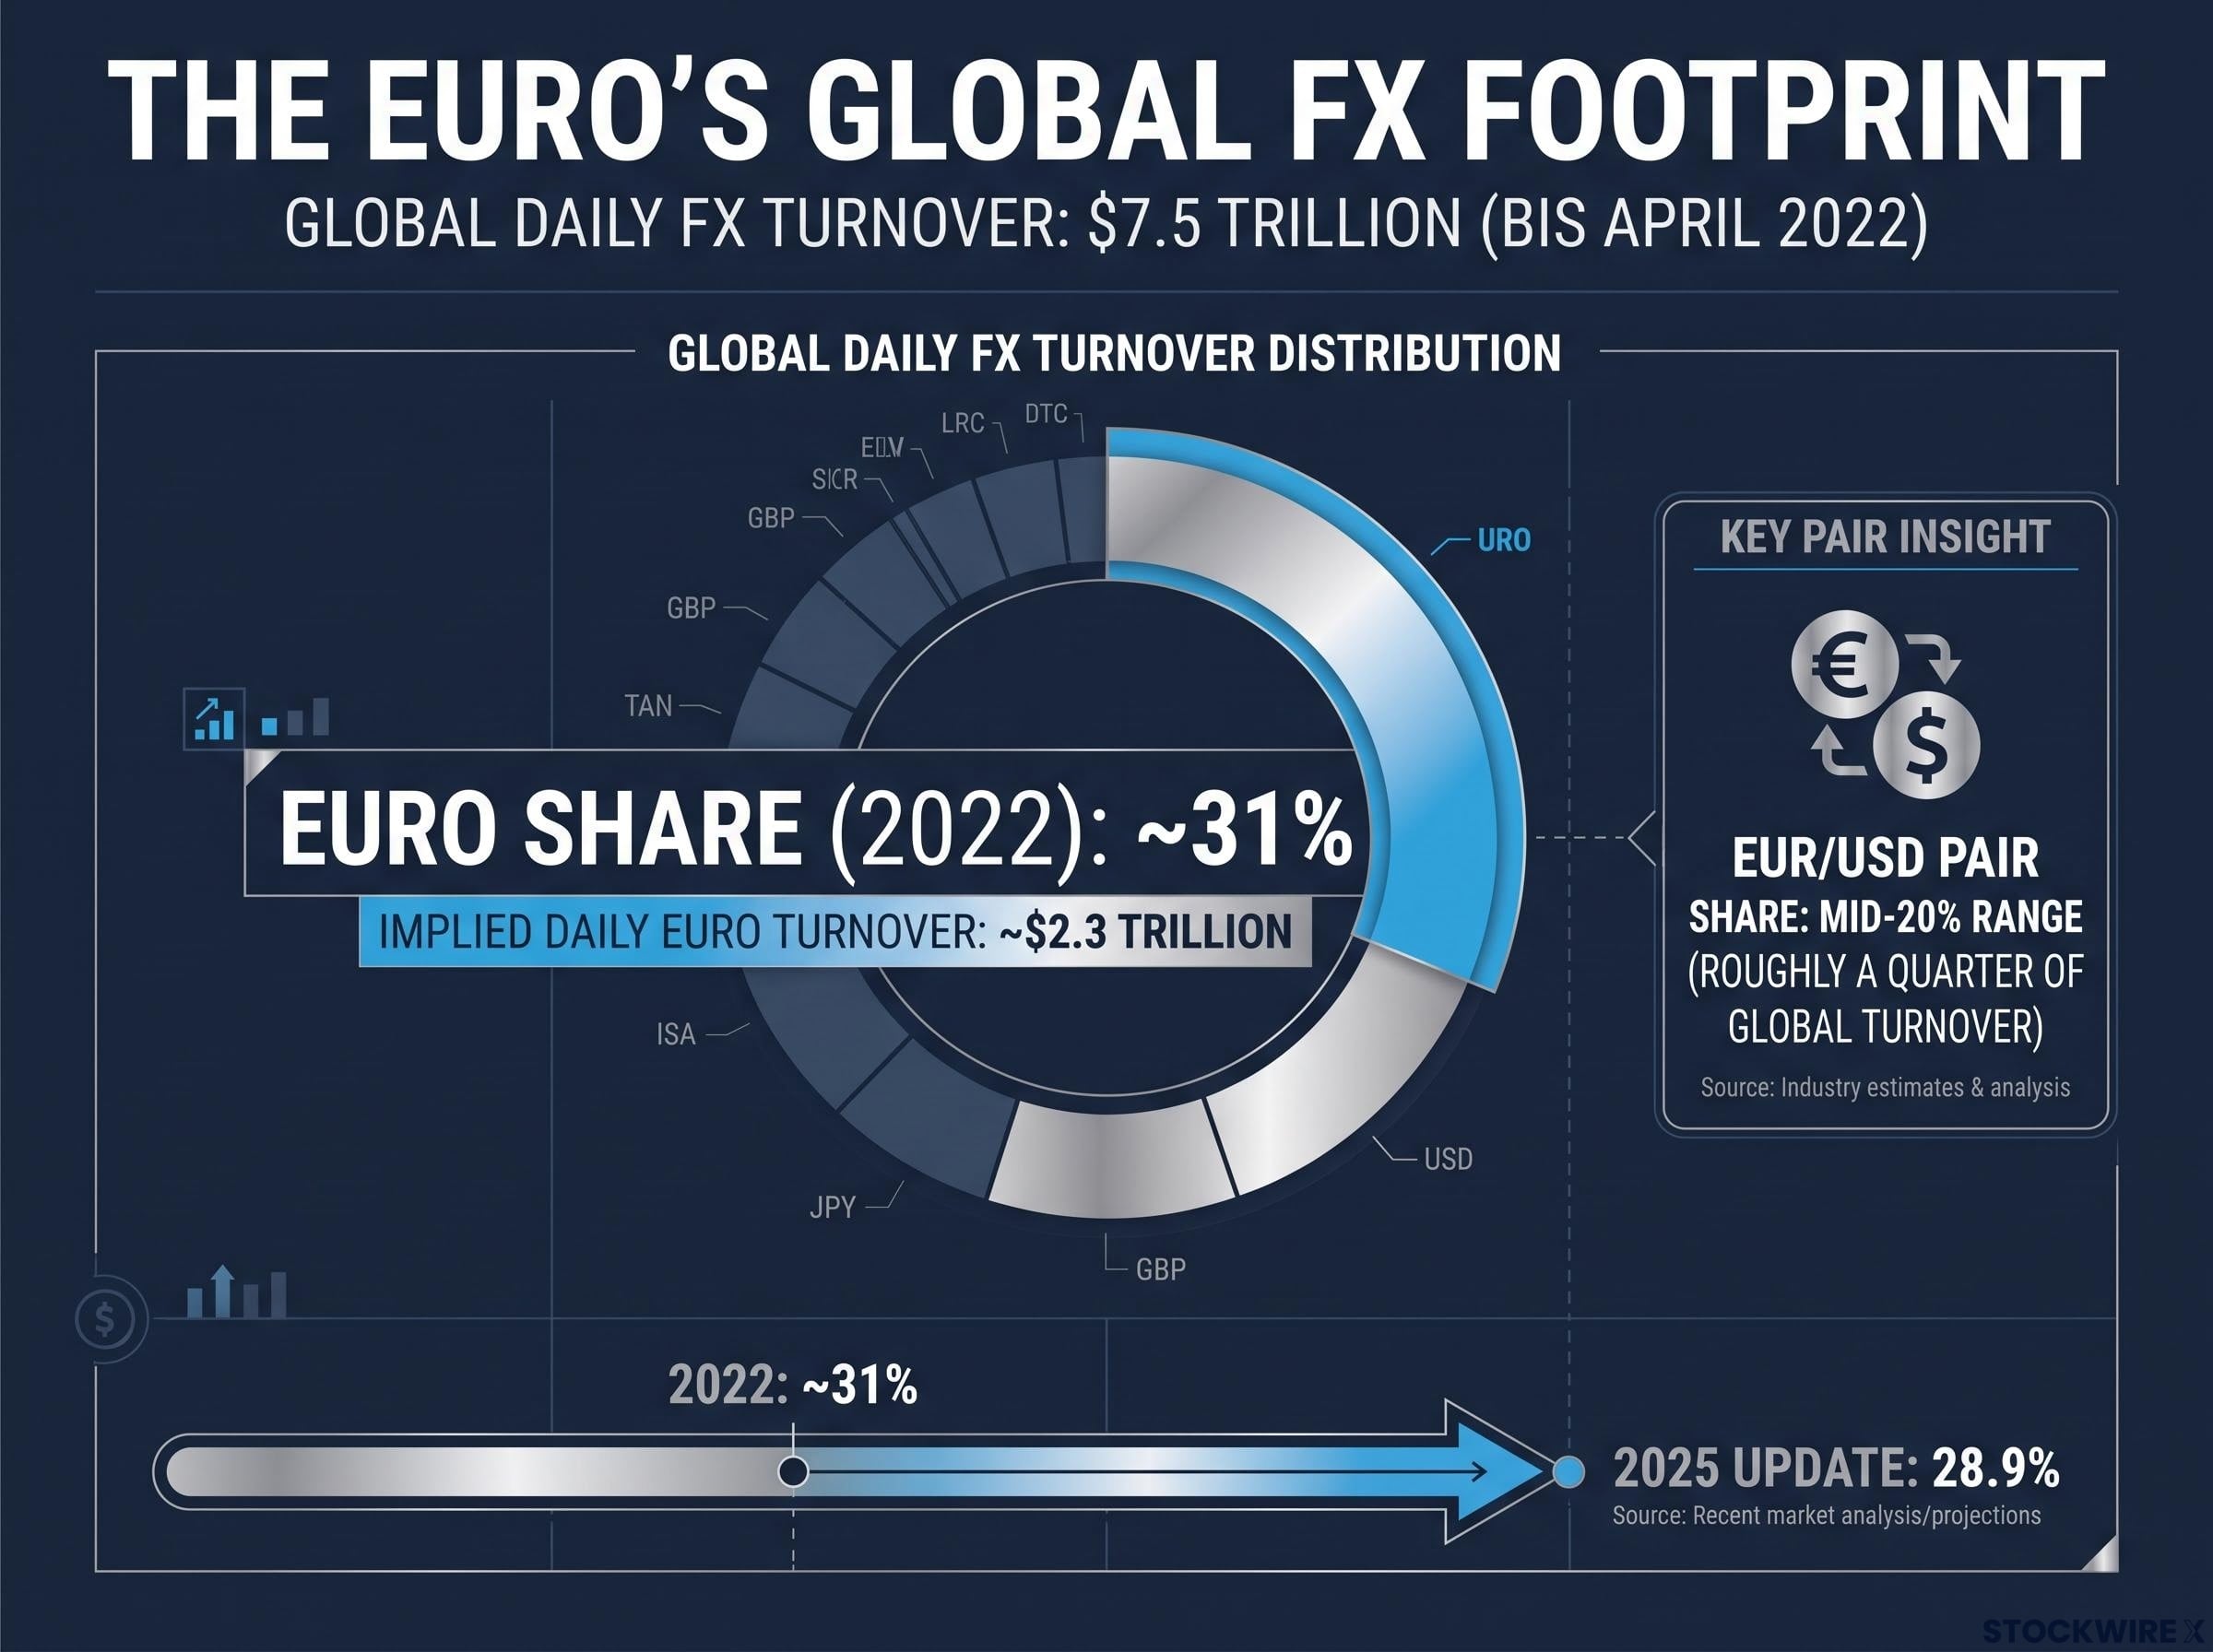
The scale of EUR trading is worth sitting with for a moment. Global foreign exchange markets turn over $7.5 trillion per day, measured in the BIS April 2022 survey. The Euro’s share of that figure is approximately 31%, which implies roughly $2.3 trillion in daily euro-related transactions. No other currency apart from the US dollar commands that kind of volume.
US dollar dominance in global FX markets is the structural backdrop against which every Euro share figure should be read: the dollar appears on one side of 89.2% of all daily transactions, according to the BIS April 2025 survey, which is why even the Euro’s 28.9% share represents a remarkable footprint for a secondary reserve currency.
EUR/USD is the single most traded currency pair in the world.
EUR/USD accounts for roughly a quarter of all global FX turnover, making it the primary lens through which euro valuation is discussed and the pair where liquidity is deepest.
That dominance is why EUR/USD is the default reference point for euro analysis. When analysts, strategists, or central bankers talk about “Euro strength” or “Euro weakness,” they are almost always referencing this pair first. Beyond it, EUR/JPY, EUR/GBP, and EUR/AUD extend the Euro’s relevance across Asian, British, and commodity-linked economies, though precise pair-by-pair share figures carry some measurement uncertainty at the margins.
| Metric | Figure | Source |
|---|---|---|
| Global daily FX turnover (April 2022) | $7.5 trillion | BIS Triennial Survey 2022 |
| Euro share of global FX trades (2022) | ~31% | BIS Triennial Survey 2022 |
| Euro share of global FX trades (2025 update) | 28.9% | BIS Triennial Survey 2025 |
| EUR/USD pair share | Mid-20% range | BIS Triennial Survey 2022 |
| Implied daily euro turnover | ~$2.3 trillion | BIS-derived |
The sheer volume of euro-denominated trading means that understanding the Euro is not a specialist exercise. It is foundational for anyone participating in global financial markets, because EUR moves ripple into asset prices, commodity costs, and portfolio valuations well beyond the forex desk. The 2025 BIS update shows the Euro’s share has slipped modestly to 28.9%, but this is a declining share within a growing overall market. The Euro’s footprint remains enormous. The question is what drives it.
When big ASX news breaks, our subscribers know first
How the ECB’s mandate and structure shape Euro policy
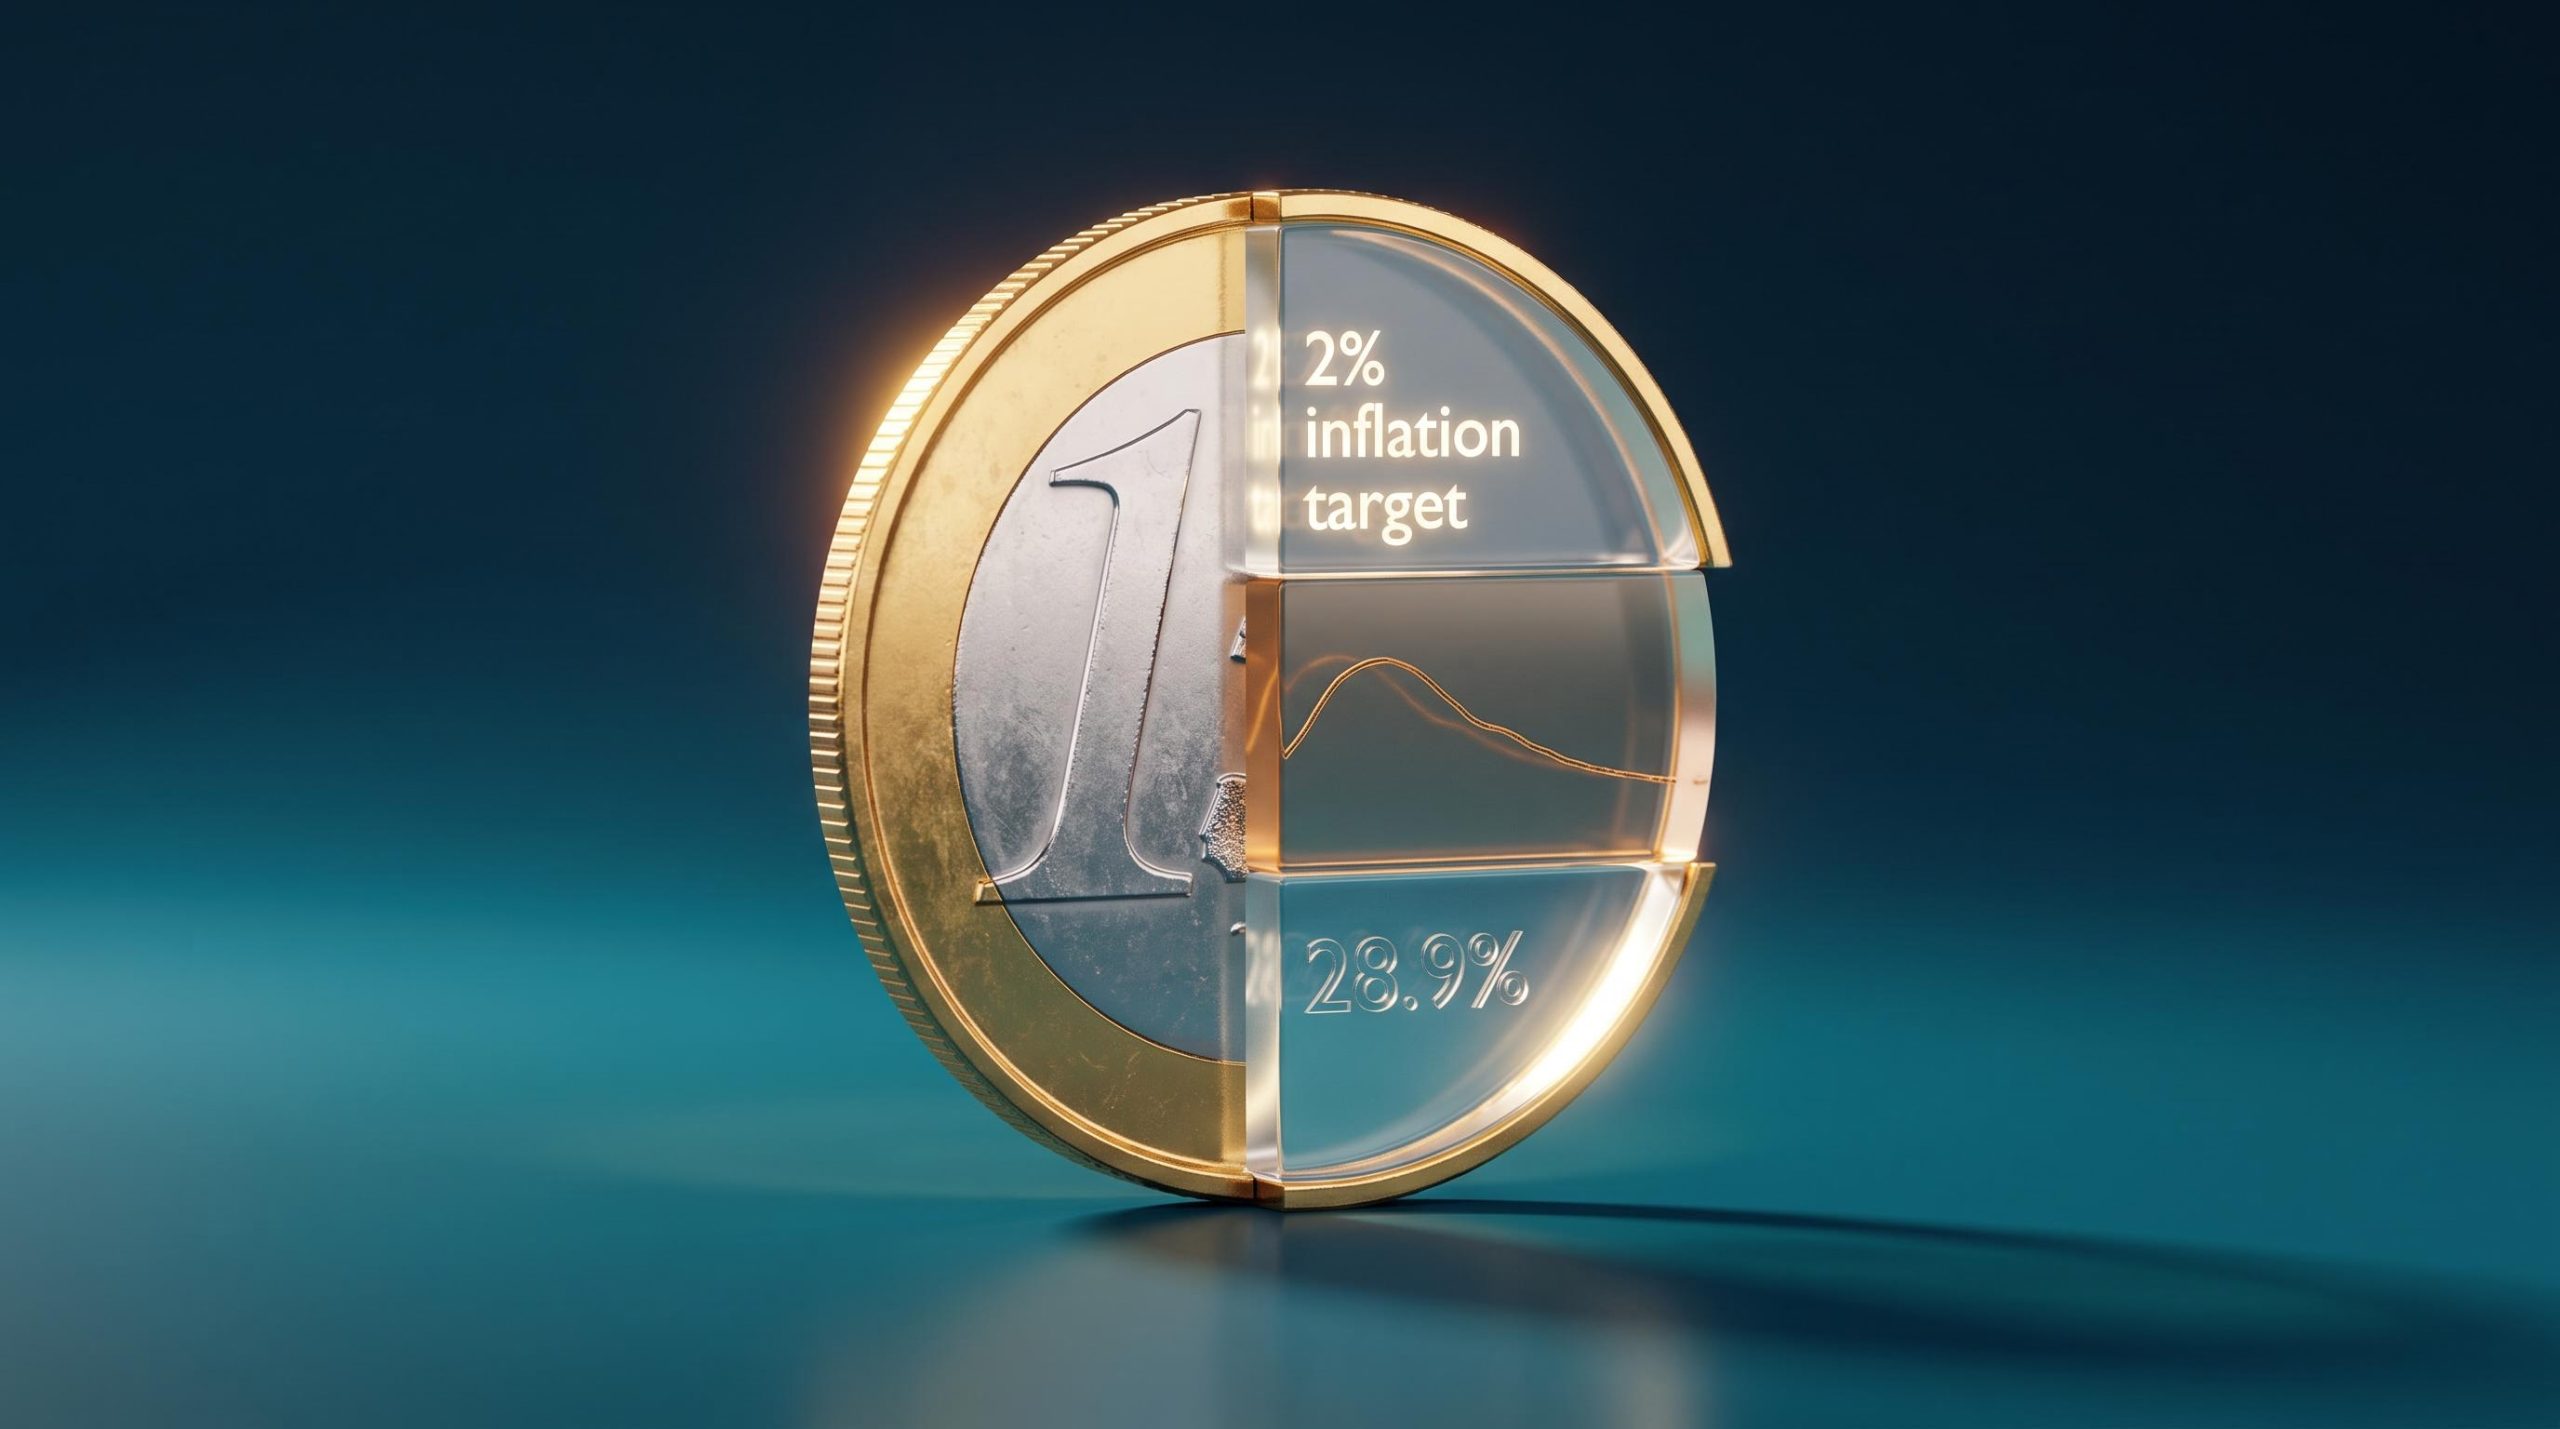
Based in Frankfurt, Germany, the European Central Bank (ECB) operates under a primary mandate that looks deceptively simple: price stability. Since the 2021 strategy review, reconfirmed through 2026, that mandate is defined as a symmetric 2% inflation target over the medium term, measured using the Harmonised Index of Consumer Prices (HICP), which is the standardised inflation measure used across the euro area.
The ECB 2021 strategy review formally established the symmetric 2% inflation target and confirmed that the Harmonised Index of Consumer Prices remains the appropriate price measure, setting the precise mandate framework that governs every Governing Council rate decision today.
Two words in that definition carry more weight than they first appear. “Symmetric” means the ECB treats 2% undershoots and overshoots with equal concern. It will not tolerate inflation persistently below 2% any more than it would tolerate it persistently above. “Medium term” means the ECB does not need to react to every temporary spike or dip. It gives the Governing Council room to look through short-lived price moves and focus on where inflation is heading, not just where it is today. Both features make the ECB’s reaction function harder to predict than a simple “inflation up, rates up” rule would suggest.
Why the press conference often matters more than the rate decision itself
Rate-setting authority rests with the Governing Council, whose membership is structured as follows:
- Six Executive Board members, including President Christine Lagarde and the Vice-President
- 20 national central bank governors, one from each euro-area member state
That composition matters. Those 20 governors represent economies in very different conditions. Germany might be contracting while Spain is growing. Greece might face fiscal stress while the Netherlands runs a surplus. Every rate decision is a synthesis of 20 national positions filtered through one mandate. The policy tension is real and ongoing.

Policy meetings are scheduled eight times across the calendar year, each followed by a press conference. This is where you should focus your attention. Rate decisions are frequently priced in by markets before the announcement, meaning the surprise element is often minimal. The press conference is where new information surfaces. Forward guidance, the language the President uses to signal future policy direction, shapes rate expectations in real time.
A subtle shift in phrasing can trigger large EUR moves even when the rate itself is unchanged. If the President removes “data dependent” language or changes how inflation risks are characterised, markets recalibrate their rate expectations within minutes. When you listen to an ECB press conference, you are hearing a synthesis of 20 national economic realities. Every word of guidance is a signal about where rates, and therefore the Euro, are likely headed next.
Which economic indicators carry the most weight for EUR traders
Not all Eurozone data releases are created equal. Your time and attention are limited, and the market prices them differently too.
Germany, France, Italy, and Spain together account for around two-thirds of euro-area GDP and close to 60% of total EU GDP, according to Eurostat. That concentration is why data from these four economies, particularly Germany, carries disproportionate weight in EUR analysis.
A German Ifo Business Climate reading or a German manufacturing PMI (Purchasing Managers’ Index, a survey-based measure of business activity where readings above 50 indicate expansion) often moves the Euro more than a data release from a smaller member state. The market interprets German data as a read on the engine room of the bloc: when Germany slows, the ECB’s room to tighten narrows.
Here is the hierarchy of indicators that professional EUR analysts prioritise:
| Category | Indicator | Why it moves EUR |
|---|---|---|
| Inflation | HICP (headline and core) | Directly tied to the ECB’s 2% mandate; readings above target sustain hawkish expectations |
| Growth | GDP (area-wide and big-four country-level) | Signals the bloc’s economic trajectory and constrains or expands ECB policy space |
| Leading indicators | Composite PMI, Ifo Business Climate, ZEW Economic Sentiment | Arrive before GDP data; signal where economic momentum is heading next |
| Labour market | Unemployment rate | Influences wage inflation and consumption expectations |
| External sector | Trade balance | Sustained surplus supports currency demand; deficit can weaken it |
Leading indicators versus lagging data: why PMIs and Ifo move markets first
The distinction between leading and lagging indicators matters more than most beginner resources explain. GDP data tells you what already happened. Unemployment confirms conditions that were in place weeks or months earlier. These are lagging indicators: useful for confirming a trend, but not for anticipating one.
PMIs, the Ifo index, and the ZEW survey are leading indicators. They measure expectations and current activity before the official data confirms the picture. FX markets are forward-looking. They price what is coming, not what has passed. That is why a weaker-than-expected German PMI print can move the Euro sharply on the day it is released, while a GDP figure from two months ago may barely register.
If you are building an economic calendar for EUR analysis, weight the leading indicators first. They are where the real-time signal sits.
The forces behind the Euro that most beginners overlook
Even a perfect read of the ECB calendar and the macroeconomic data will leave you with an incomplete picture. The Euro responds to forces that sit entirely outside the standard data release schedule, and these structural dynamics often override the fundamentals.
The first is risk sentiment. The Euro behaves as a pro-cyclical currency, meaning it tends to strengthen in global risk-on environments when investors are allocating to growth-sensitive assets and higher-yielding positions. In risk-off episodes, whether triggered by geopolitical shocks, equity market stress, or financial contagion, capital flows toward the US dollar and Swiss franc as safe havens. The Euro comes under pressure regardless of how strong the Eurozone data looks. Monitoring equity volatility indices like the VIX gives you context for EUR moves that appear disconnected from European economic releases.
The second is fragmentation risk. The BTP-Bund spread (the difference in yield between Italian government bonds and German Bunds) acts as the market’s real-time proxy for stress within the euro area. A widening spread signals that investors are demanding higher compensation to hold Italian debt relative to German debt, which suggests rising concern about fiscal or political cohesion within the bloc. This matters for EUR valuation because a widening spread constrains ECB hawkishness: tighter policy raises peripheral borrowing costs further, which could destabilise the very economies the ECB is trying to support.
Bond yield mechanics underpin the BTP-Bund spread as a fragmentation indicator: because the coupon on each sovereign bond is fixed, a rising Italian yield signals falling bond prices and rising investor demand for a risk premium on Italian debt relative to German Bunds, not simply a change in the ECB’s policy rate.
- Risk sentiment dynamics: Euro strengthens in risk-on environments; weakens in risk-off as capital flows to USD and CHF safe havens
- Fragmentation risk indicators: BTP-Bund spread widening signals intra-bloc stress and constrains ECB policy flexibility
- Rate differential monitoring: EUR versus USD short-term yields or OIS (Overnight Index Swap) curves determine whether ECB policy is relatively tightening or loosening compared to other major central banks
Why the ECB hiking cycle did not always strengthen the Euro
The third structural force, rate differentials, is best understood through a concrete example. In 2022, the ECB began raising interest rates for the first time in over a decade. On a simple reading, higher rates should have strengthened the Euro. Instead, EUR/USD fell sharply.
The reason was the Federal Reserve. The Fed was tightening at a faster pace, pushing the interest rate gap between US and European yields in the dollar’s favour. Capital followed the higher yield, and the Euro weakened despite the ECB hiking.
Interest rate differentials between the ECB and the Federal Reserve are the single most powerful fundamental driver of EUR/USD over multi-month horizons, which is why the 2022 episode where ECB hikes failed to strengthen the Euro is best understood as a differential story rather than a failure of rate mechanics.
This is why tracking the ECB in isolation is insufficient. You must always ask how ECB policy compares to the Fed, the Bank of England, and the Bank of Japan to form a directionally accurate EUR view. If you watch only the ECB calendar and the German PMI but ignore the BTP-Bund spread and the direction of Federal Reserve policy, you are monitoring perhaps half the information set that actually explains day-to-day EUR moves.
Building your EUR monitoring framework
The four layers covered in this article (market footprint, ECB structure, data hierarchy, structural forces) are not separate topics. They are a single analytical framework, and the value is in using them together.
- Track the ECB meeting calendar and press conference language. Eight meetings per year set the fixed rhythm. The press conference, not the rate decision headline, is where the signal sits.
- Watch the big-four economic releases, starting with Germany. Prioritise leading indicators (PMI, Ifo, ZEW) over lagging data (GDP, unemployment) for real-time directional reads.
- Monitor the BTP-Bund spread and VIX for structural and risk signals. These tell you whether the ECB’s policy space is constrained and whether the Euro’s pro-cyclical character is working for or against it.
- Always interpret ECB decisions in the context of other major central banks. EUR/USD OIS curve comparisons are the primary tool professionals use for relative rate positioning.
The ECB does not move the Euro in isolation. Every rate decision, every data release, every press conference phrase gains or loses its significance depending on what the Fed, the Bank of England, and the Bank of Japan are doing at the same time.
The beginner error is treating each indicator as a standalone signal. The more useful approach is layered: start with the ECB’s current rate direction, add the key data releases, then adjust for risk sentiment and relative rate context. The relative weight of each layer shifts across different market regimes. In a low-volatility environment, data releases dominate. In a crisis, risk sentiment and fragmentation risk take over. Your job is to understand the framework well enough to reweight it as conditions change.
What understanding Euro valuation actually gives you
You now hold the full conceptual map, from the ECB’s 2% mandate through to the BTP-Bund spread and the relative rate dynamics that can override everything else. The value of this map is not that it predicts Euro movements. It is that it explains them after they happen and frames the right questions before they do.
This framework is also transferable. The same institutional, data, and structural logic that drives EUR analysis underlies your understanding of GBP, JPY, and AUD. The specifics change; the analytical architecture does not.
The Euro’s position is not fixed. Its share of global FX turnover slipped from roughly 31% in 2022 to 28.9% in the 2025 BIS update, a modest decline in a growing overall market. Even structural dominance evolves. The framework you use to analyse the Euro needs to evolve with it.
This article is for informational purposes only and should not be considered financial advice. Investors should conduct their own research and consult with financial professionals before making investment decisions.