It is the most quoted number in American finance. Every weekday afternoon, a news anchor reads it aloud, and millions of people nod along, taking it as the verdict on how “the market” did that day.
Here is the strange part. Most of those same people cannot explain how the Dow Jones Industrial Average is actually calculated, or why a stock trading at $500 pushes the number around more than a stock at $50, regardless of which company is larger or more important to the economy.
That gap matters, because the Dow is roughly 130 years old, tracks only 30 stocks, and runs on a methodology almost no modern index designer would choose from scratch. Yet it remains the shorthand for “the market” in headlines, in dinner-table conversation, and in trillions of dollars of benchmarked investment products.
That tension is what this piece is about. After reading it, you will know exactly how the Dow works, what actually moves it, where its critics are right, and the specific ways you can invest through it. Think of this as a personal briefing on a number you hear more often than almost any other in finance.
A 130-year-old index built from 30 stocks: how the Dow came to be
On 26 May 1896, a financial editor named Charles Dow published a single average of a handful of large industrial companies and gave American investors something they had never had: a daily read on how big business was doing, condensed into one figure.
Dow co-founded Dow Jones and Company with Edward Jones and Charles Bergstresser, the same partnership that had begun publishing The Wall Street Journal in 1889. The index was, at heart, an editorial tool. It was meant to be a barometer, a quick pulse-check for readers, and that basic function has never really changed across 130 years and countless constituent swaps.
What has changed is the roster. Today the average holds 30 companies with a combined market capitalisation of more than $22 trillion, spanning technology, finance, healthcare, retail, and heavy industry.
Here is the current lineup, grouped loosely by sector so you can see the shape of it:
- Technology and communications: Apple, Microsoft, IBM, Cisco Systems, Salesforce, NVIDIA, Alphabet
- Finance: American Express, Goldman Sachs, JPMorgan Chase, Visa, Travelers
- Healthcare: Amgen, Johnson and Johnson, Merck, UnitedHealth Group
- Consumer and retail: Amazon, Coca-Cola, McDonald’s, Nike, Procter and Gamble, Walmart, Home Depot, Walt Disney
- Industrials and materials: 3M, Boeing, Caterpillar, Honeywell, Sherwin-Williams, Chevron
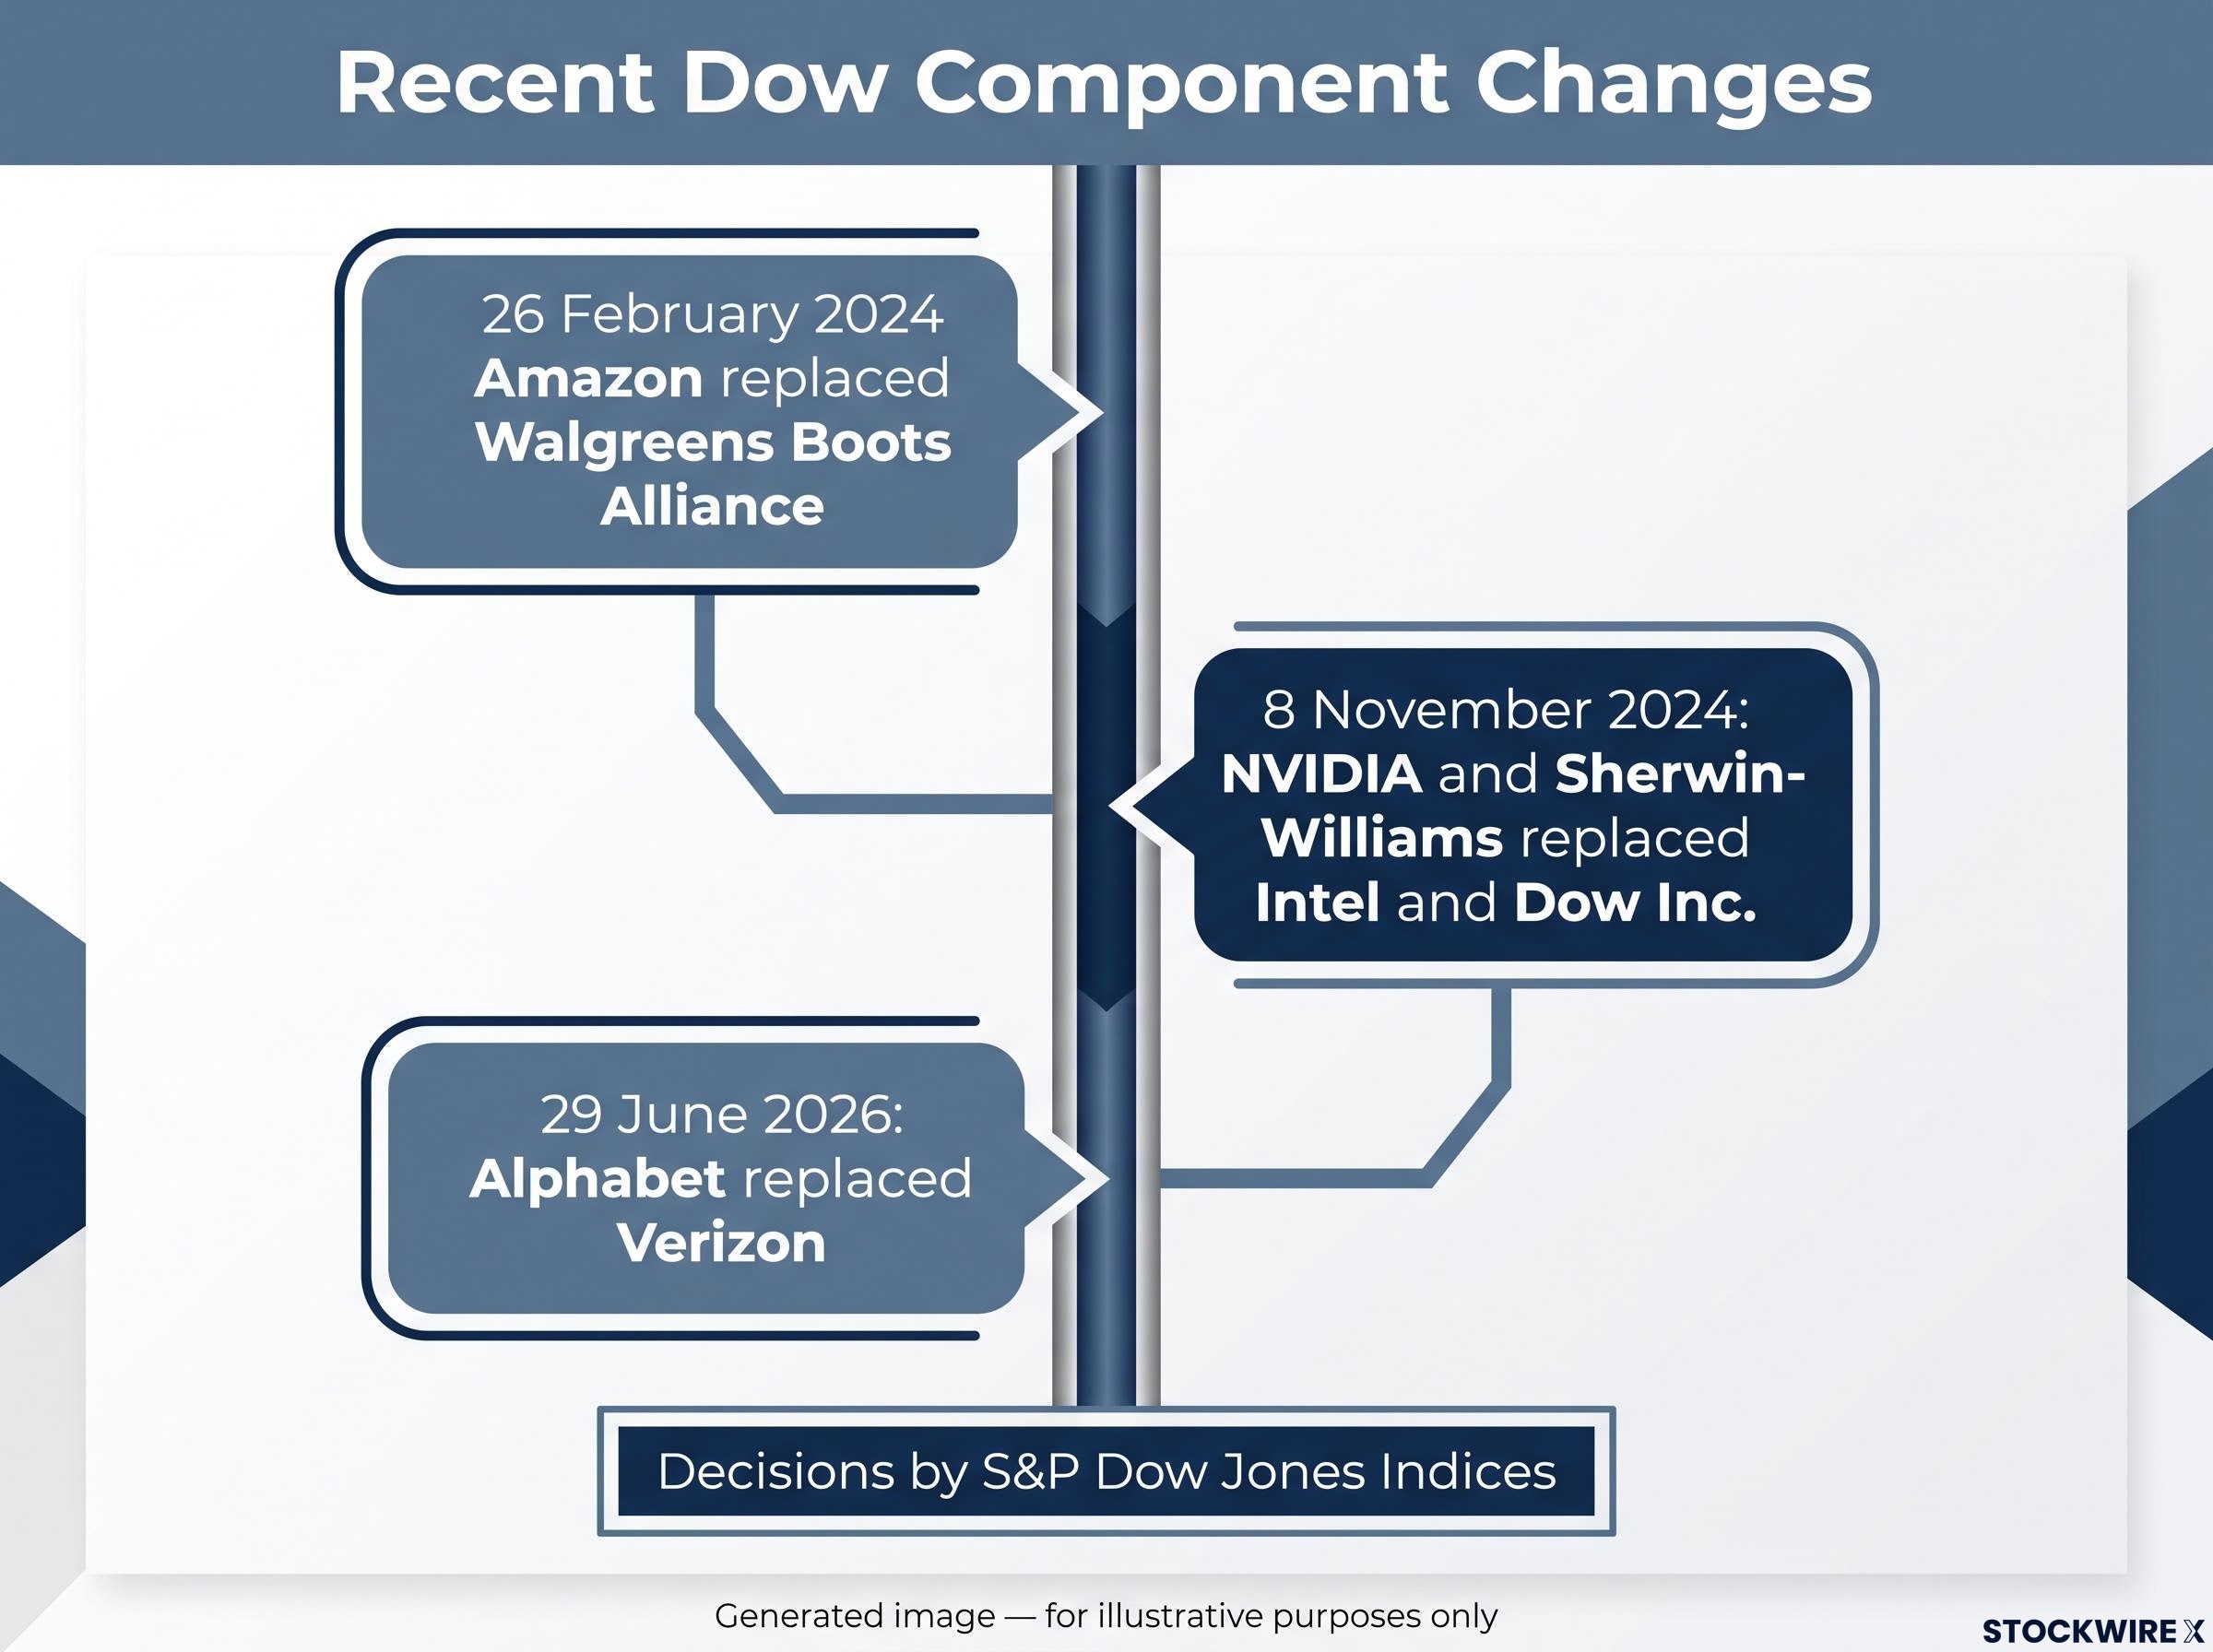
The list turns over more than you might expect. Amazon replaced Walgreens Boots Alliance on 26 February 2024, NVIDIA and Sherwin-Williams replaced Intel and Dow Inc. on 8 November 2024, and Alphabet replaced Verizon on 29 June 2026.
Three changes in roughly two and a half years tells you something important. The Dow is not a fixed, objective snapshot of the American economy. It is a curated list of whoever a committee considers representative of American business at a given moment, which means the number carries a point of view.
Who decides what goes in?
The selection sits with S&P Dow Jones Indices, not Congress, not the Federal Reserve, and not any public vote. There is no fixed quantitative screen a company must pass to get in.
Instead, inclusion reflects a judgment about a firm’s reputation, its sustained growth, how well it represents its sector, and how much investor interest it commands. That editorial discretion is both the Dow’s flexibility and its most frequent target for criticism, because “we picked these because they felt representative” is a harder thing to audit than a hard rule.
Blue-chip credentials are not a legal designation or a hard quantitative threshold; they reflect a quality profile built on market capitalisation above $10 billion, major index membership, and a track record of financial resilience, which is exactly the profile the Dow committee uses as its informal selection filter.
When big ASX news breaks, our subscribers know first
Why a $500 stock moves the Dow more than a $50 stock: the price-weighting explained
The number you watch tick up and down all day is the output of one deceptively simple sum. To understand why the Dow behaves the way it does, you have to look underneath the headline figure at the arithmetic driving it.
The formula is this: add up the share prices of all 30 components, then divide by the Dow Divisor. That is it. The index equals the sum of 30 nominal share prices over a single small number.
The consequence is the thing most people miss. Because the calculation uses share price and nothing else, a stock’s influence on the Dow is set by its price tag, not by the size of the company, its revenue, or its market capitalisation. A stock at $500 exerts five times the daily pull of a stock at $100, even if the $100 company is far larger and more economically important.
Price weighting in practice produces some counterintuitive outcomes: Moderna’s 120% single-session surge on 19 August 2026 contributed exactly zero points to the Dow because the company holds no seat in the index, while Merck’s comparatively modest 10% gain drove the bulk of that day’s 230-point move.
This is exactly where the Dow diverges from almost every other index you follow. Here is the distortion in a simple, hypothetical illustration:
| Company | Share price | Market cap (hypothetical) | Weight under price weighting | Weight under cap weighting |
|---|---|---|---|---|
| Company A | $500 | $50 billion | Higher (driven by price) | Lower (smaller company) |
| Company B | $100 | $250 billion | Lower (driven by price) | Higher (larger company) |
Company B is five times larger, yet under the Dow’s method Company A swings the index more. Share price alone carries no economic information, so this weighting has no economic content in itself.
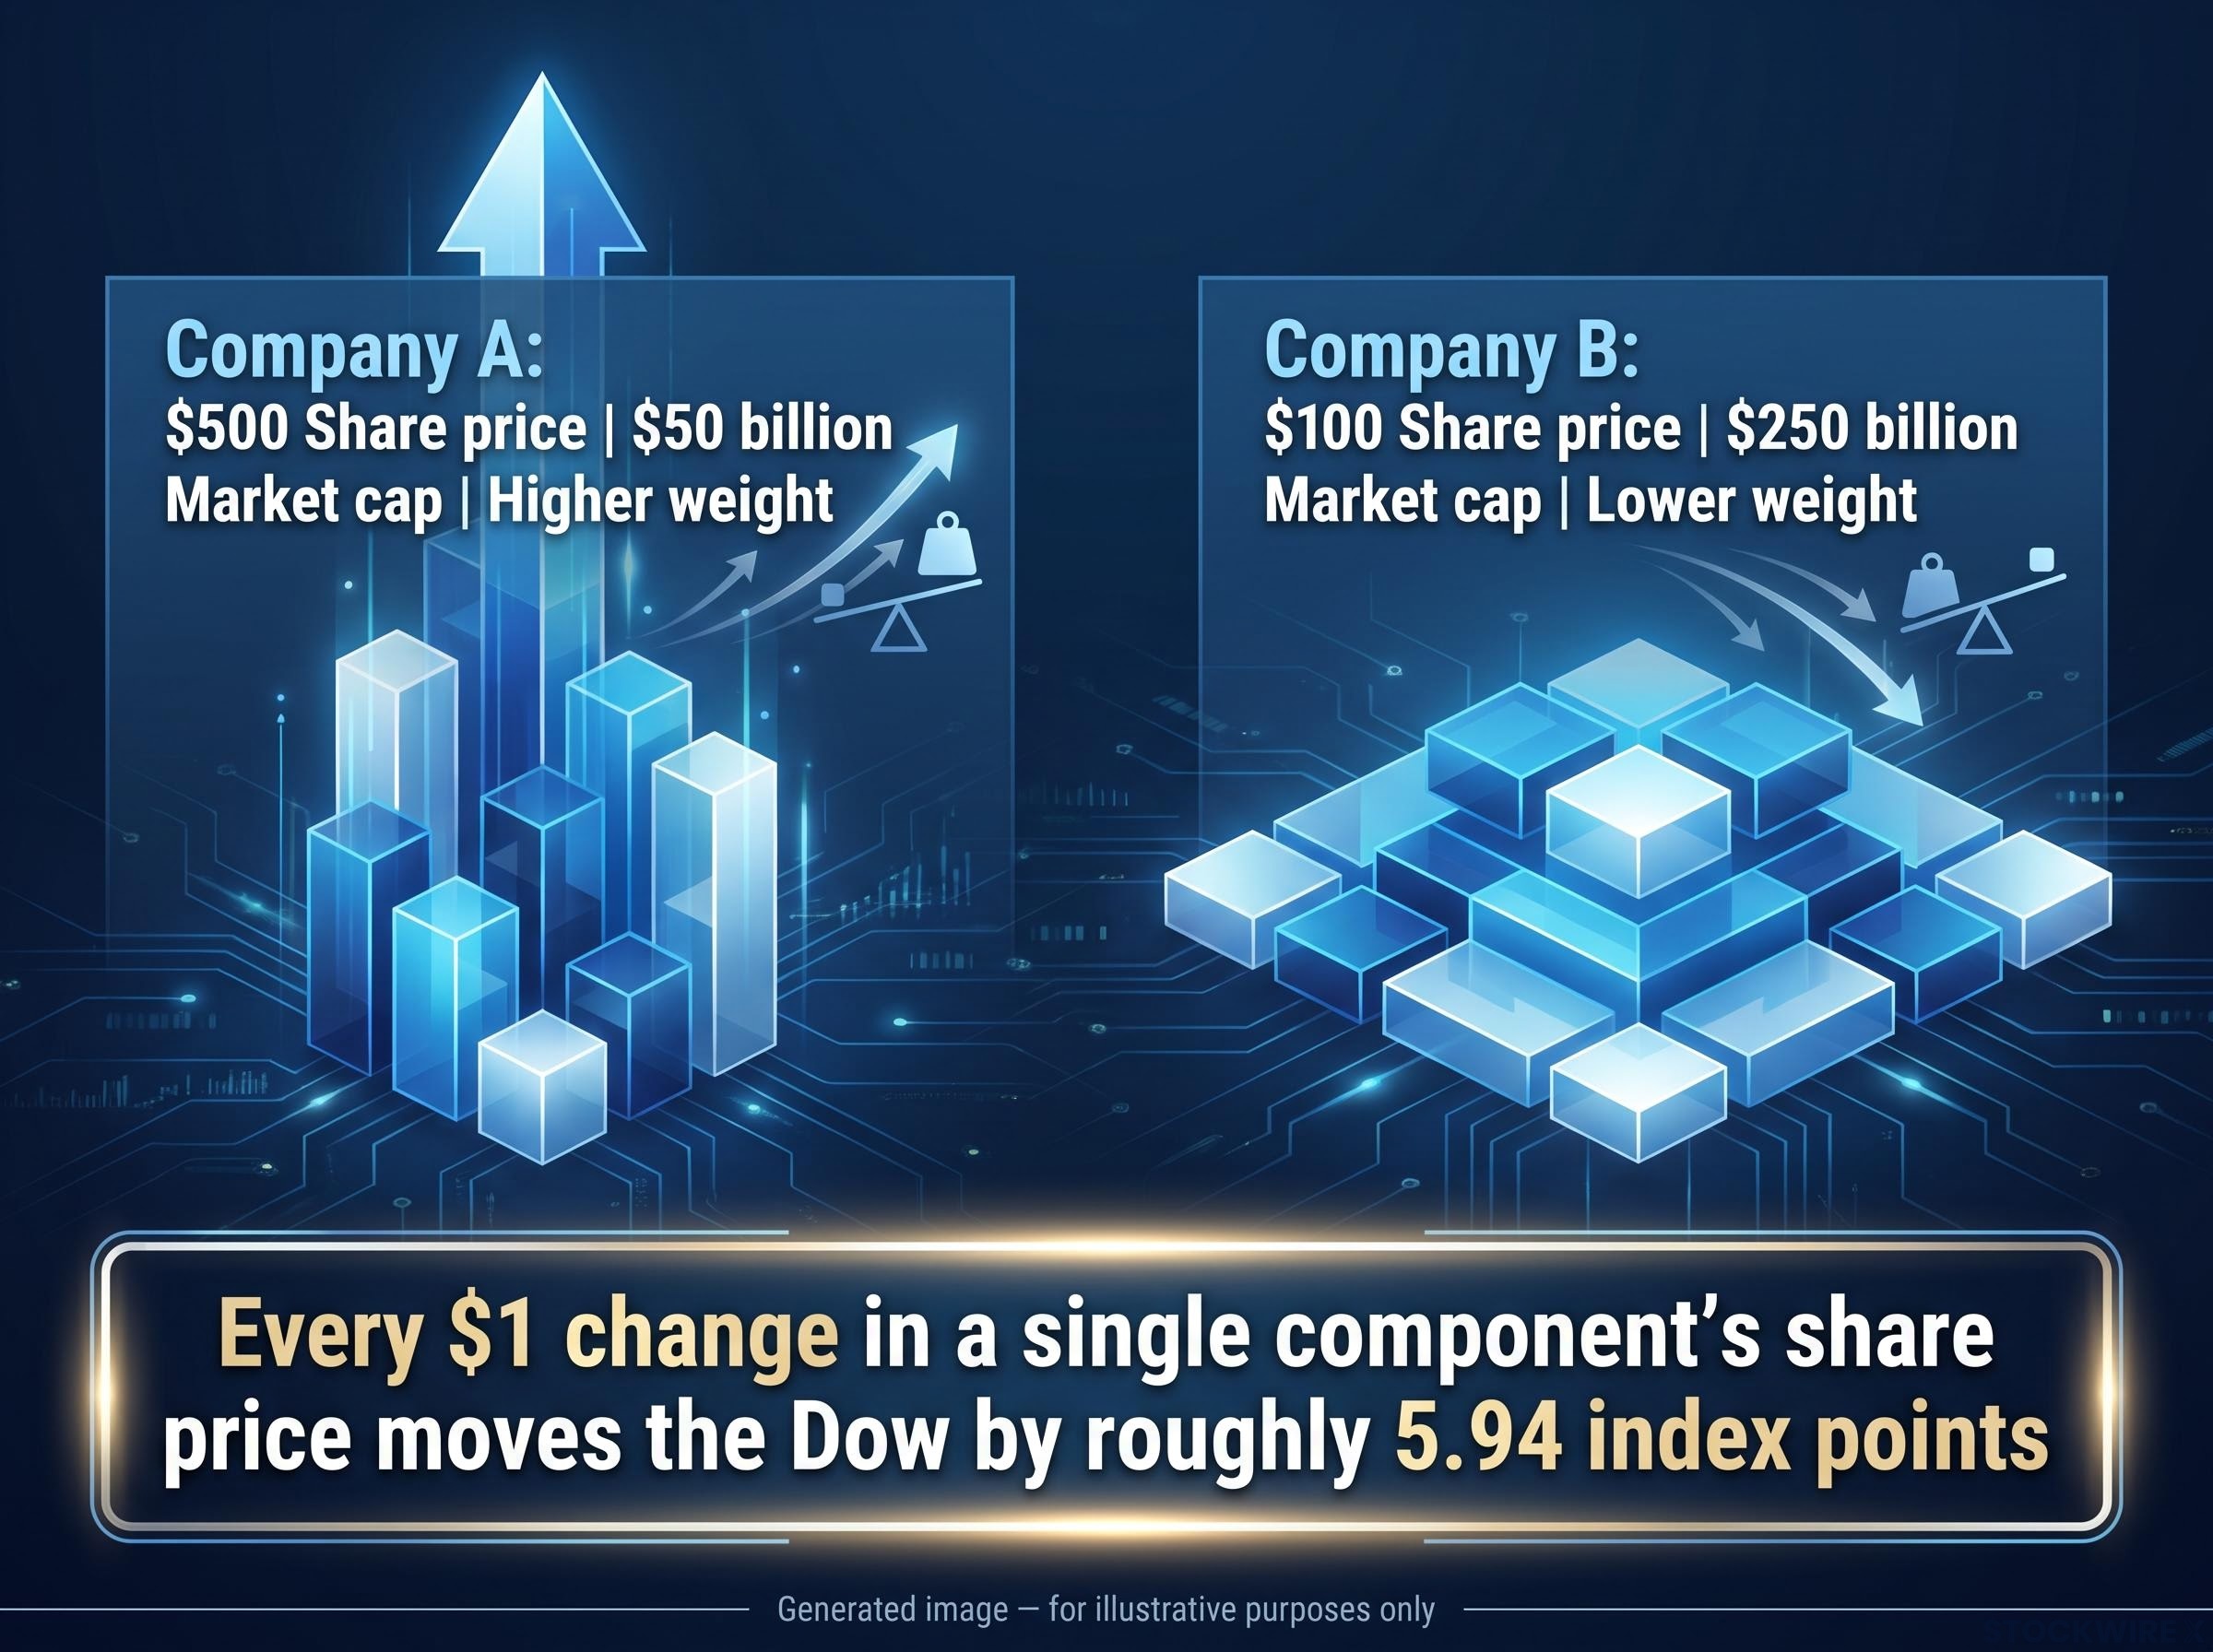
Every $1 change in a single component’s share price moves the Dow by roughly 5.94 index points at the current divisor.
What the Dow Divisor actually does
The divisor is the piece that keeps the whole thing coherent. Without it, an ordinary corporate action would wreak havoc on the number.
Consider a stock split. If a $400 stock splits and becomes a $200 stock overnight, the company is worth exactly the same, but the sum of the 30 share prices just fell by $200. Left alone, that would show up as a fictitious drop in the index. The divisor adjusts to absorb the change so the index series stays continuous.
The current divisor sits at approximately 0.168 (precisely 0.16824816528350, effective 29 June 2026, following the adjustment that accompanied Alphabet’s addition). Back on 23 May 2016 it stood at 0.14602128057775, which shows you the figure drifts up and down as corporate actions accumulate. It has been published daily in The Wall Street Journal and reflects the cumulative effect of every split, spinoff, and swap since the divisor was first introduced in 1928.
The practical lesson matters for how you read the news. When the Dow lurches, you are watching 30 share prices divided by a shifting denominator, which means one high-priced company having a rough week can move the headline number more than dozens of other companies having a good one. According to Investopedia, AIG’s collapse from roughly $292 to $45 in 2008 contributed to a nearly 3,000-point fall in the Dow, a vivid example of price weighting amplifying a single-stock event. Treating daily Dow moves as a precise read on the broad economy is a mistake the mechanics themselves warn against.
What Dow Theory actually says, and where it falls short today
Charles Dow left behind more than an index. He also left a framework for reading markets that technical analysts still cite by name, and understanding it helps you judge any commentary that leans on it.
The core idea is confirmation. Under Dow Theory, a primary market trend is only valid when both the Dow Jones Industrial Average and the Dow Jones Transportation Average (DJTA) move in the same direction, with trading volume expanding in that direction. The logic was that industrials made the goods and the railroads shipped them, so the two should agree before you trust the signal.
Dow Theory also breaks a market trend into three phases, and the order is the whole point:
- Accumulation: informed investors buy quietly while pessimism still dominates and prices look unappealing to the crowd.
- Public participation: the wider market recognises the trend, momentum builds, and prices climb as more buyers pile in.
- Distribution: the same informed investors begin selling into peak public enthusiasm, quietly handing their positions to the crowd.
The confirmation requirement and why it creates lag
The confirmation rule is where the theory is most useful and most limiting. When the DJIA rises while the DJTA falls, that divergence is technically a non-confirmation, a caution flag, not an outright sell signal.
The confirmation rule is where the theory is most useful and most limiting, and treating it as a Dow Theory signal filter rather than a precision timing system is the practical adjustment most modern analysts make, because waiting for both averages to align means entering a trend already underway rather than getting ahead of one.
The problem is timing. Waiting for both averages to line up means, according to trading educators Bookmap (2026) and YouHodler (2025), that you routinely enter a move after a meaningful chunk of it has already been captured by earlier participants. If you use Dow Theory today, treat it as a trend-direction filter, not a precision timing tool. By the time it confirms, you are joining a move already underway, not getting ahead of one.
The broader criticisms of the framework are worth holding in mind:
- Lag: by the time both indices confirm, a significant portion of the move may have passed.
- Two-index dependence: the theory rests on just two averages, which critics say no longer capture a diversified, technology-heavy economy.
- A changed economic structure: the American Association of Individual Investors notes the old premise, industrials for production and rails for shipments, no longer maps cleanly onto a service-based economy where “transportation” now spans airlines, trucking, shipping, and leasing.
- Subjective interpretation: identifying trends requires judgment, and Fidelity notes that the composition of both averages has changed dramatically over more than a century, so different analysts reach different conclusions from the same chart.
It is not all dismissal. In a 2022 Forbes interview, Manuel Blay of TheDowTheory.com argued that Dow Theory, applied consistently, still reduces drawdowns and outperforms simple buy-and-hold. The fair read is that it remains a foundation for trend analysis, but one whose signals you should weigh with caution rather than accept as authoritative.
How does the Dow compare to the S&P 500, and which one should you watch?
If the Dow has this many structural quirks, a reasonable question follows: why do people still quote it ahead of broader measures, and when does each index actually tell you more?
The two differ on nearly every dimension that matters to you. The Dow holds 30 stocks and weights them by price. The S&P 500 holds 500 stocks and weights them by market capitalisation, which means company size drives its influence rather than share price. That single design difference makes the S&P 500 the more technically sound gauge of the total US equity market.
| Metric | DJIA | S&P 500 | What it means for you | When it matters most |
|---|---|---|---|---|
| Number of stocks | 30 | 500 | Breadth of exposure | Judging diversification |
| Weighting | Price-weighted | Market-cap weighted | What actually drives moves | Tech-led rallies, splits |
| Sector spread | Narrow, blue-chip | Broad | How representative it is | Sector rotations |
| History | ~130 years continuous | Shorter | Long-run comparison | Studying past crashes |
The Dow still has genuine advantages the S&P 500 cannot match. Per CNN’s 2024 coverage, it is the only index with continuous data reaching back before the 1929 crash, so if you want to study how stocks behaved into that collapse, the Dow is the only archive available. Fidelity describes its other strength plainly: it condenses top-company performance into one number for a quick, easy-to-understand daily read, and its blue-chip focus tracks America’s most established companies with unusual clarity.
An estimated US$115 billion was indexed or benchmarked to the Dow at the end of 2024, according to S&P Dow Jones Indices, so practitioners do assign it real money and weight.
Here is the read you should take. For tracking the health of the whole US equity market, the S&P 500 is the more accurate measure. The Dow is the cultural barometer you hear on the news, and the two can diverge meaningfully during tech-led rallies or sector rotations. Knowing the difference means you will not mistake a 30-stock blue-chip reading for a verdict on the entire market.
Index concentration risk extends well beyond the Dow’s 30-stock limit: in the cap-weighted S&P 500, five mega-cap names controlled roughly 23% of the broad market as of mid-April 2026, delivering more than half of April’s recovery but also driving approximately 70% of Q1 losses, a pattern that complicates the assumption that broader automatically means safer.
How to invest in the Dow: DIA, futures, options, and what each one actually costs you
You now know what the Dow is and how it moves. The practical question is how you actually buy exposure to it, and what you are taking on when you do.
For most retail investors, the front door is the SPDR Dow Jones Industrial Average ETF Trust (DIA), managed by State Street Global Advisors. It replicates the price-weighted index directly, carries a gross expense ratio of 0.16%, and held roughly $46.1 billion in assets as of early September 2026. That fee is genuinely cheap.
State Street’s DIA fund page confirms the ETF’s gross expense ratio of 0.16% and provides the current assets under management figure, giving you a direct view of the product’s cost structure and scale before you invest.
Cheap does not mean broad, though. Because DIA mirrors a 30-stock price-weighted basket, it is not the diversified market fund some investors assume it to be.
| Vehicle | Access method | Cost or margin | Key structural risk | Best suited for |
|---|---|---|---|---|
| DIA ETF | Buy like a share | 0.16% expense ratio | 30-stock concentration | Blue-chip exposure |
| DJIA futures | Futures account | Margin, embedded leverage | Amplified price-weight risk | Hedging, active traders |
| DJIA options | Options account | Premium, leverage | Losses can exceed outlay | Experienced traders |
| Dow-tracking mutual funds | Fund purchase | Varies by fund | Same 30-stock limits | Long-term index holders |
Futures and options are both priced off the same price-weighted index, so every quirk baked into the Dow is baked into the derivative. Standard derivatives education stresses that these contracts embed leverage and can produce losses larger than your initial outlay, which magnifies the concentration and price-weight risks already present in the index.
The Motley Fool warns that because the Dow holds just 30 stocks, an ETF like DIA is “somewhat riskier than a more diversified ETF” for investors seeking broad market exposure.
What the price-weighting quirk means for DIA specifically
Because DIA replicates the price-weighted index, it holds the same nominal-price exposure proportions the Dow does. A stock trading at $400 a share carries more DIA weight than one at $80, regardless of which company is larger by market capitalisation.
That is the opposite of almost every other major US equity ETF you may own, where weight follows market cap. Wealthfront characterises DIA as carrying both equity market risk and concentration risk, and Koala Gains notes the top 10 holdings account for roughly 56% of assets, with high-priced names such as Goldman Sachs, Caterpillar, and UnitedHealth driving a disproportionate share of daily moves.
The distinction to hold onto is this. Cheap access to a concentrated, price-weighted basket of 30 stocks is a different product from cheap access to the broad US market, and mixing up the two is where retail investors most often go wrong.
This article is for informational purposes only and should not be considered financial advice. Investors should conduct their own research and consult with financial professionals before making investment decisions.
The Dow’s real job, and what to do with it as an investor
Pull the threads together and the picture is consistent. The Dow is historically irreplaceable, culturally dominant, and genuinely useful as a blue-chip directional signal. It is also 30 price-weighted stocks, and it is not a precise measure of the US equity market.
Both things are true at once, and that is exactly why it needs handling with care. State Street describes it as a barometer of US economic health and a symbol of American business strength, and with roughly US$115 billion benchmarked to it, practitioners clearly still assign it real weight. Its 130 years of continuous history remain a resource no other US index can offer.
Here is a simple framework for using it well:
- Watch the Dow when you want a fast read on American blue-chip sentiment and daily market direction. It is fit for exactly that purpose.
- Watch the S&P 500 when your goal is measuring total US equity performance or building a diversified portfolio, because breadth and cap weighting serve you better there.
- Watch both together when you want the clearest picture, since divergences between them often reveal what a single headline number hides.
The number you hear on the news every night is a useful directional signal and a remarkable historical archive. It is not the US stock market, and building your strategy around it without grasping that distinction is the most avoidable mistake a retail investor can make. Understand both indices, and you can read financial news without being misled by one figure.