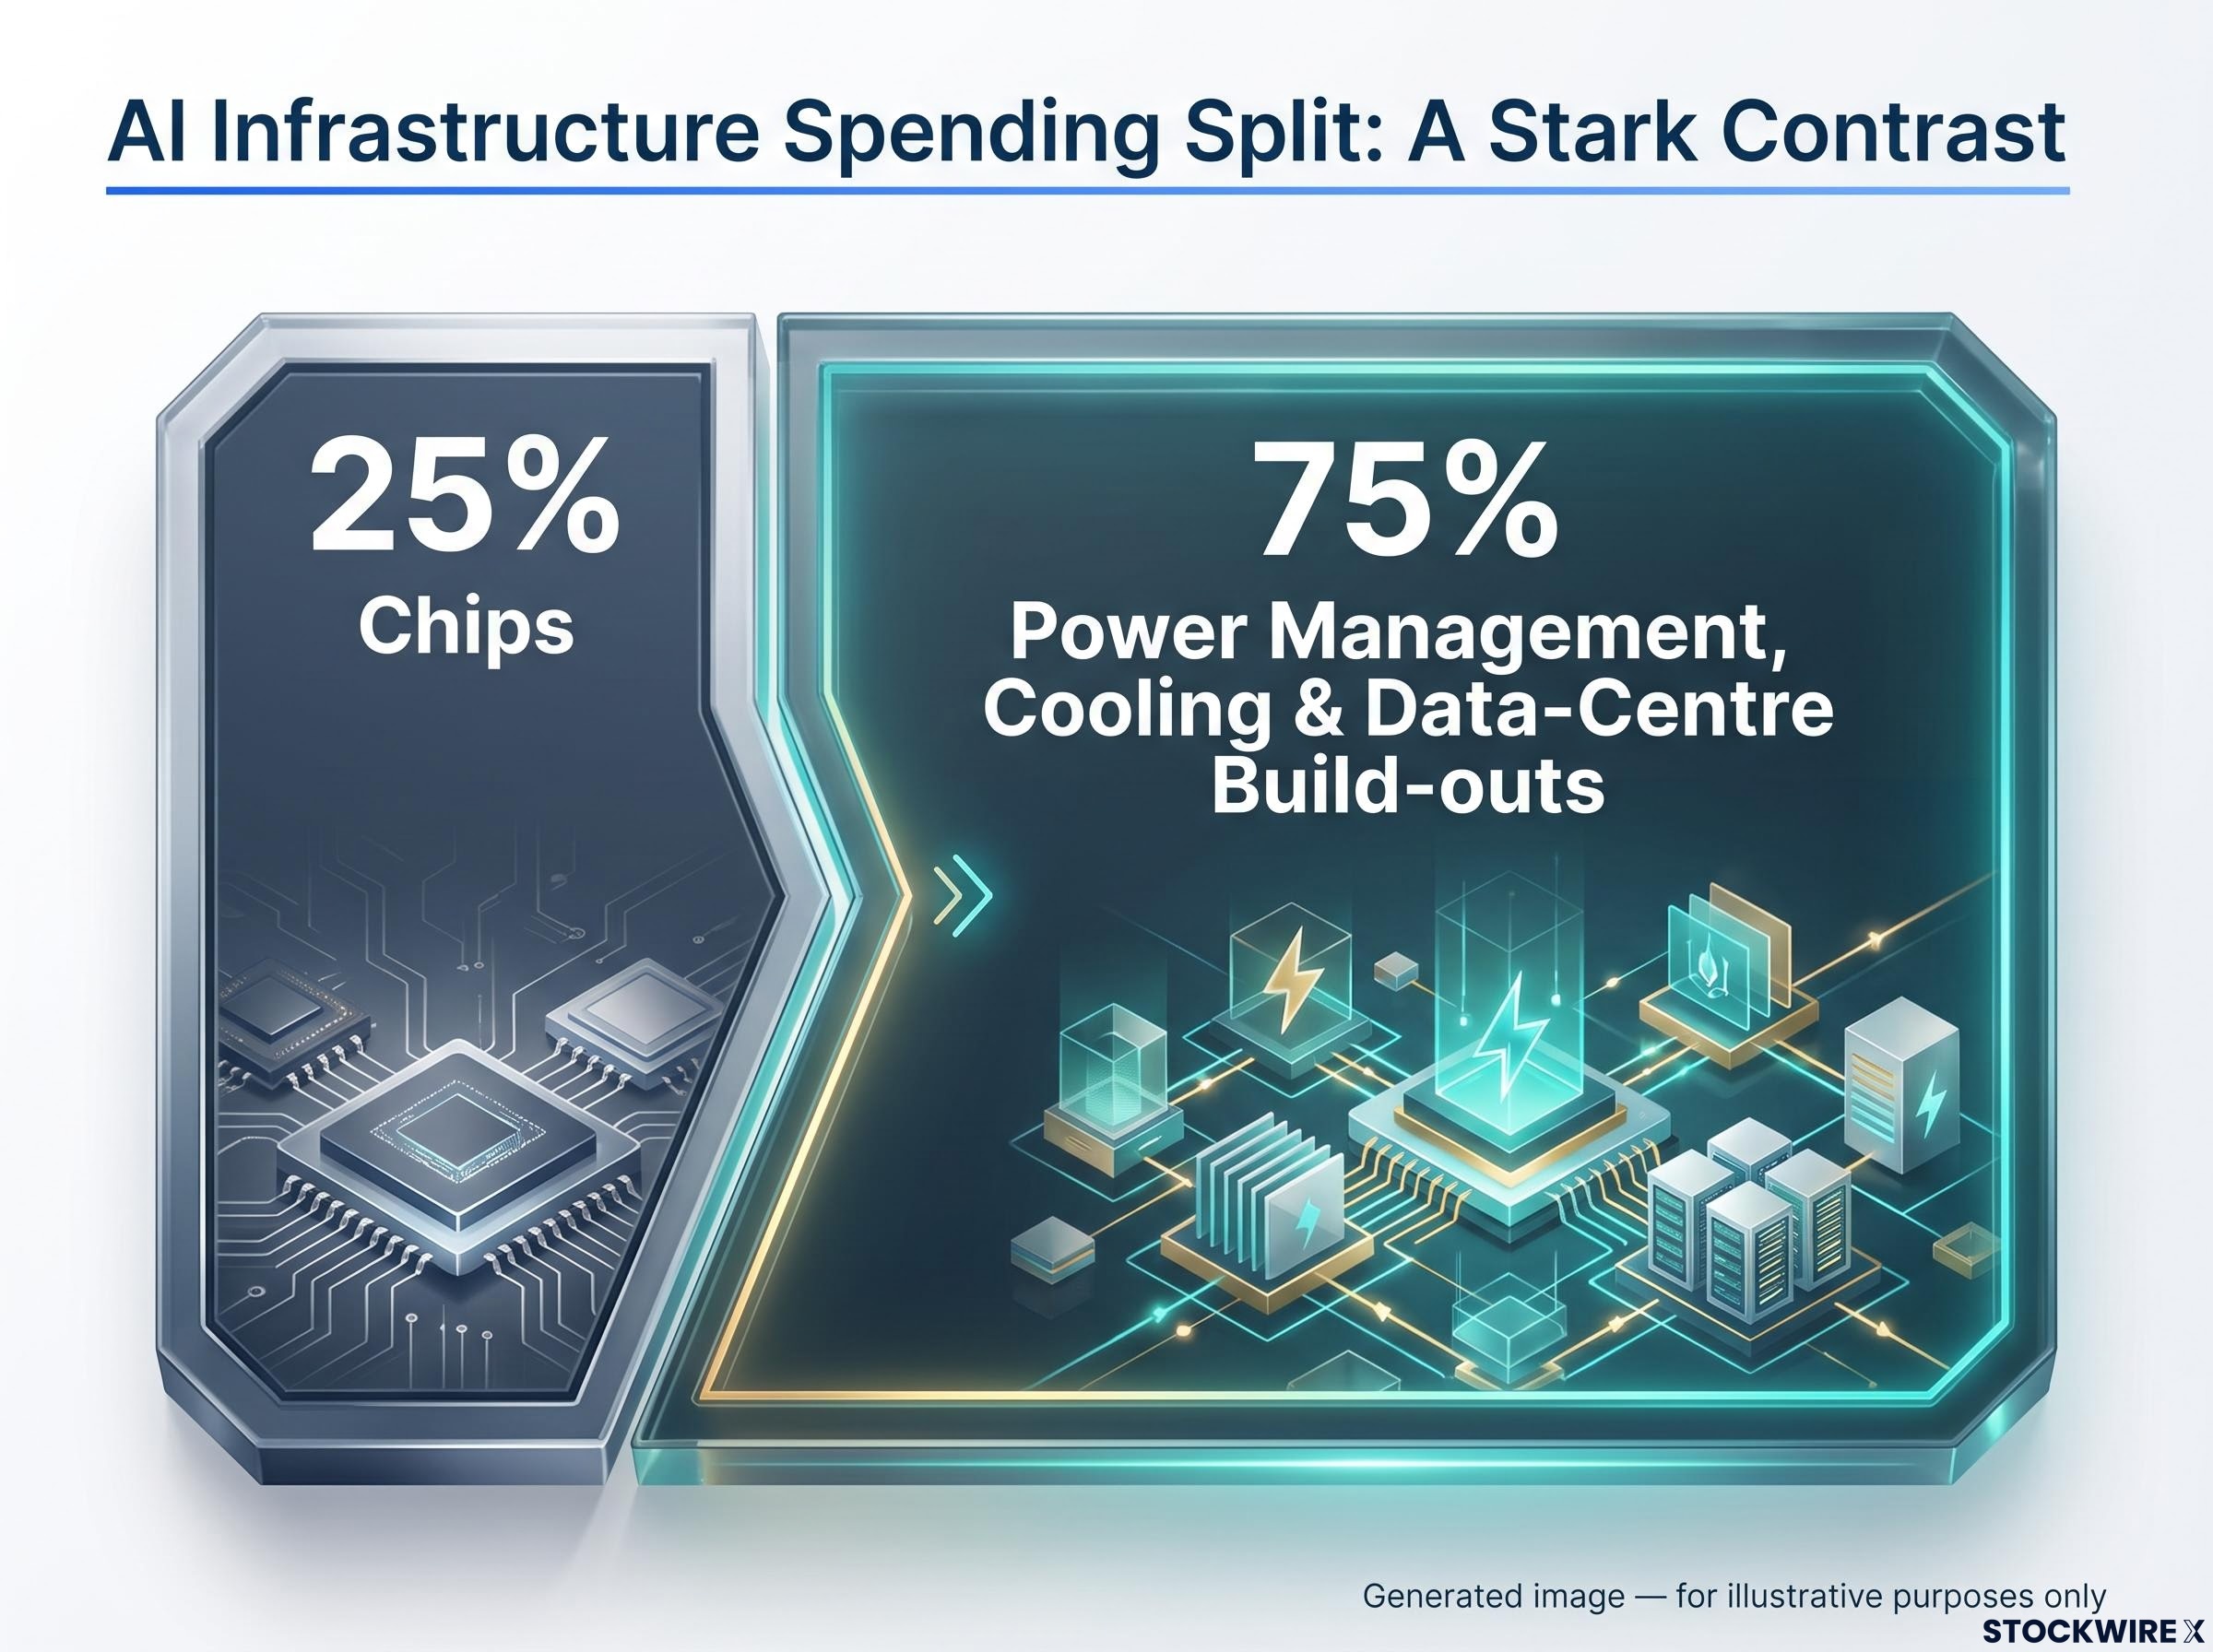
Chips were supposed to be the whole story. They are not. By recent estimates, semiconductors now account for only about 25% of total AI infrastructure spending, which means roughly 75 cents of every dollar poured into building out artificial intelligence is flowing somewhere other than the GPU designers that dominated the headlines.
The first phase of the AI trade, concentrated in a handful of chip names over roughly 18 months, has matured. Valuations have stretched, headline fatigue has set in, but the capital has not walked away from the theme. It has broadened, moving downstream into three distinct destinations, each with its own structural demand driver rather than a shared momentum story.
This analysis maps where that money is going, why each destination sits on a physical or operational constraint that cannot be resolved quickly, and what a disciplined deployment framework looks like now that the easy entry points on the momentum names have long since passed. Consider it a navigation guide for the second phase, not a recap of the first.
Why the chip trade is running out of road
Start with the tension buried inside the returns. According to Goldman Sachs Research, AI infrastructure stocks returned roughly 44% year-to-date in 2025, while consensus two-year forward earnings per share (EPS) estimates rose only 9%. Storage and server suppliers went further still, appreciating roughly 55% over the same period.
The gap that matters AI infrastructure stocks returned roughly 44% in 2025. Consensus two-year forward EPS estimates rose just 9%. That gap between price and earnings support is the signal.
That widening gap between price and earnings tells you something specific: the easy money in the chip trade has already been made. Continuing to concentrate there without a fresh catalyst is now a valuation bet, not a structural one.
The 44% return against 9% EPS growth that Goldman Sachs flagged is legible only when you understand the broader hyperscaler capital cycle, where capex is projected to consume approximately 94% of operating cash flow in 2026 against a historical average of around 40%, compressing the near-term free cash flow that would otherwise justify those multiples.
The architectural reason the capital is broadening sits in that spending split. With chips at roughly 25% of infrastructure spend and power management, cooling, and data-centre build-outs taking the other 75%, the bottleneck has physically moved downstream from the GPU itself. Rotation here is not a sentiment event. It is a capital-flow inevitability once the money follows the constraint.
Sophisticated allocators have already moved. In Q1 2026, the family office of Stanley Druckenmiller established new stakes in Broadcom, Intel, and Arm, a repositioning toward custom silicon, CPUs, and the wider ecosystem rather than doubling down on primary GPU exposure. When allocators of that calibre spread outward rather than concentrating, it is worth understanding where they are pointing.
Three secondary destinations have emerged, and each captures a different part of the value chain:
- Energy and power infrastructure, the physical constraint on compute
- High-bandwidth memory hardware, the operational bottleneck inside the system
- Enterprise software and cybersecurity, the application layer turning AI into recurring revenue
When big ASX news breaks, our subscribers know first
The gigawatt problem: energy infrastructure as the binding constraint
The scale of the power demand is not speculative. It has been measured and forecast with institutional precision, and the numbers are the story.
According to the International Energy Agency (IEA), global data-centre electricity consumption reached approximately 415 TWh in 2024, around 1.5% of global demand, and is projected to nearly double to roughly 945-950 TWh by 2030, close to 3% of the world’s electricity. Goldman Sachs Research projects global data-centre power demand reaching approximately 84 GW by 2027, with total demand up 50% by 2027 and as much as 165% by 2030 versus 2023 levels.
The IEA data centre electricity report, published April 2026, confirms that AI-focused data centres are on track to triple their power consumption by 2030, a trajectory that reinforces why grid connection bottlenecks represent a structural constraint rather than a temporary friction point for infrastructure investors.
| Metric | 2024 Baseline | 2027 Projection | 2030 Projection |
|---|---|---|---|
| Global data-centre electricity (IEA) | ~415 TWh | Rising sharply | ~945-950 TWh |
| Global data-centre power demand (Goldman Sachs) | Base year 2023 | ~84 GW (+50% vs 2023) | Up to +165% vs 2023 |
| US data-centre capacity (S&P Global) | ~62,242 MW (Mar 2026) | Rising | 151,734 MW |
S&P Global Market Intelligence projects US data-centre capacity climbing from approximately 62,242 MW in March 2026 to 151,734 MW by 2030. The demand is booked. The question is whether the grid can deliver it.
Where the grid constraint meets the investment opportunity
It cannot, at least not on the timeline AI needs. In the US, nearly 2,300 GW of generation and storage capacity sits backlogged in interconnection queues, with average wait times having more than doubled to roughly five years. Globally, grid connection timelines are stretching to 4-10 years, against data-centre build cycles of just 2-3 years.
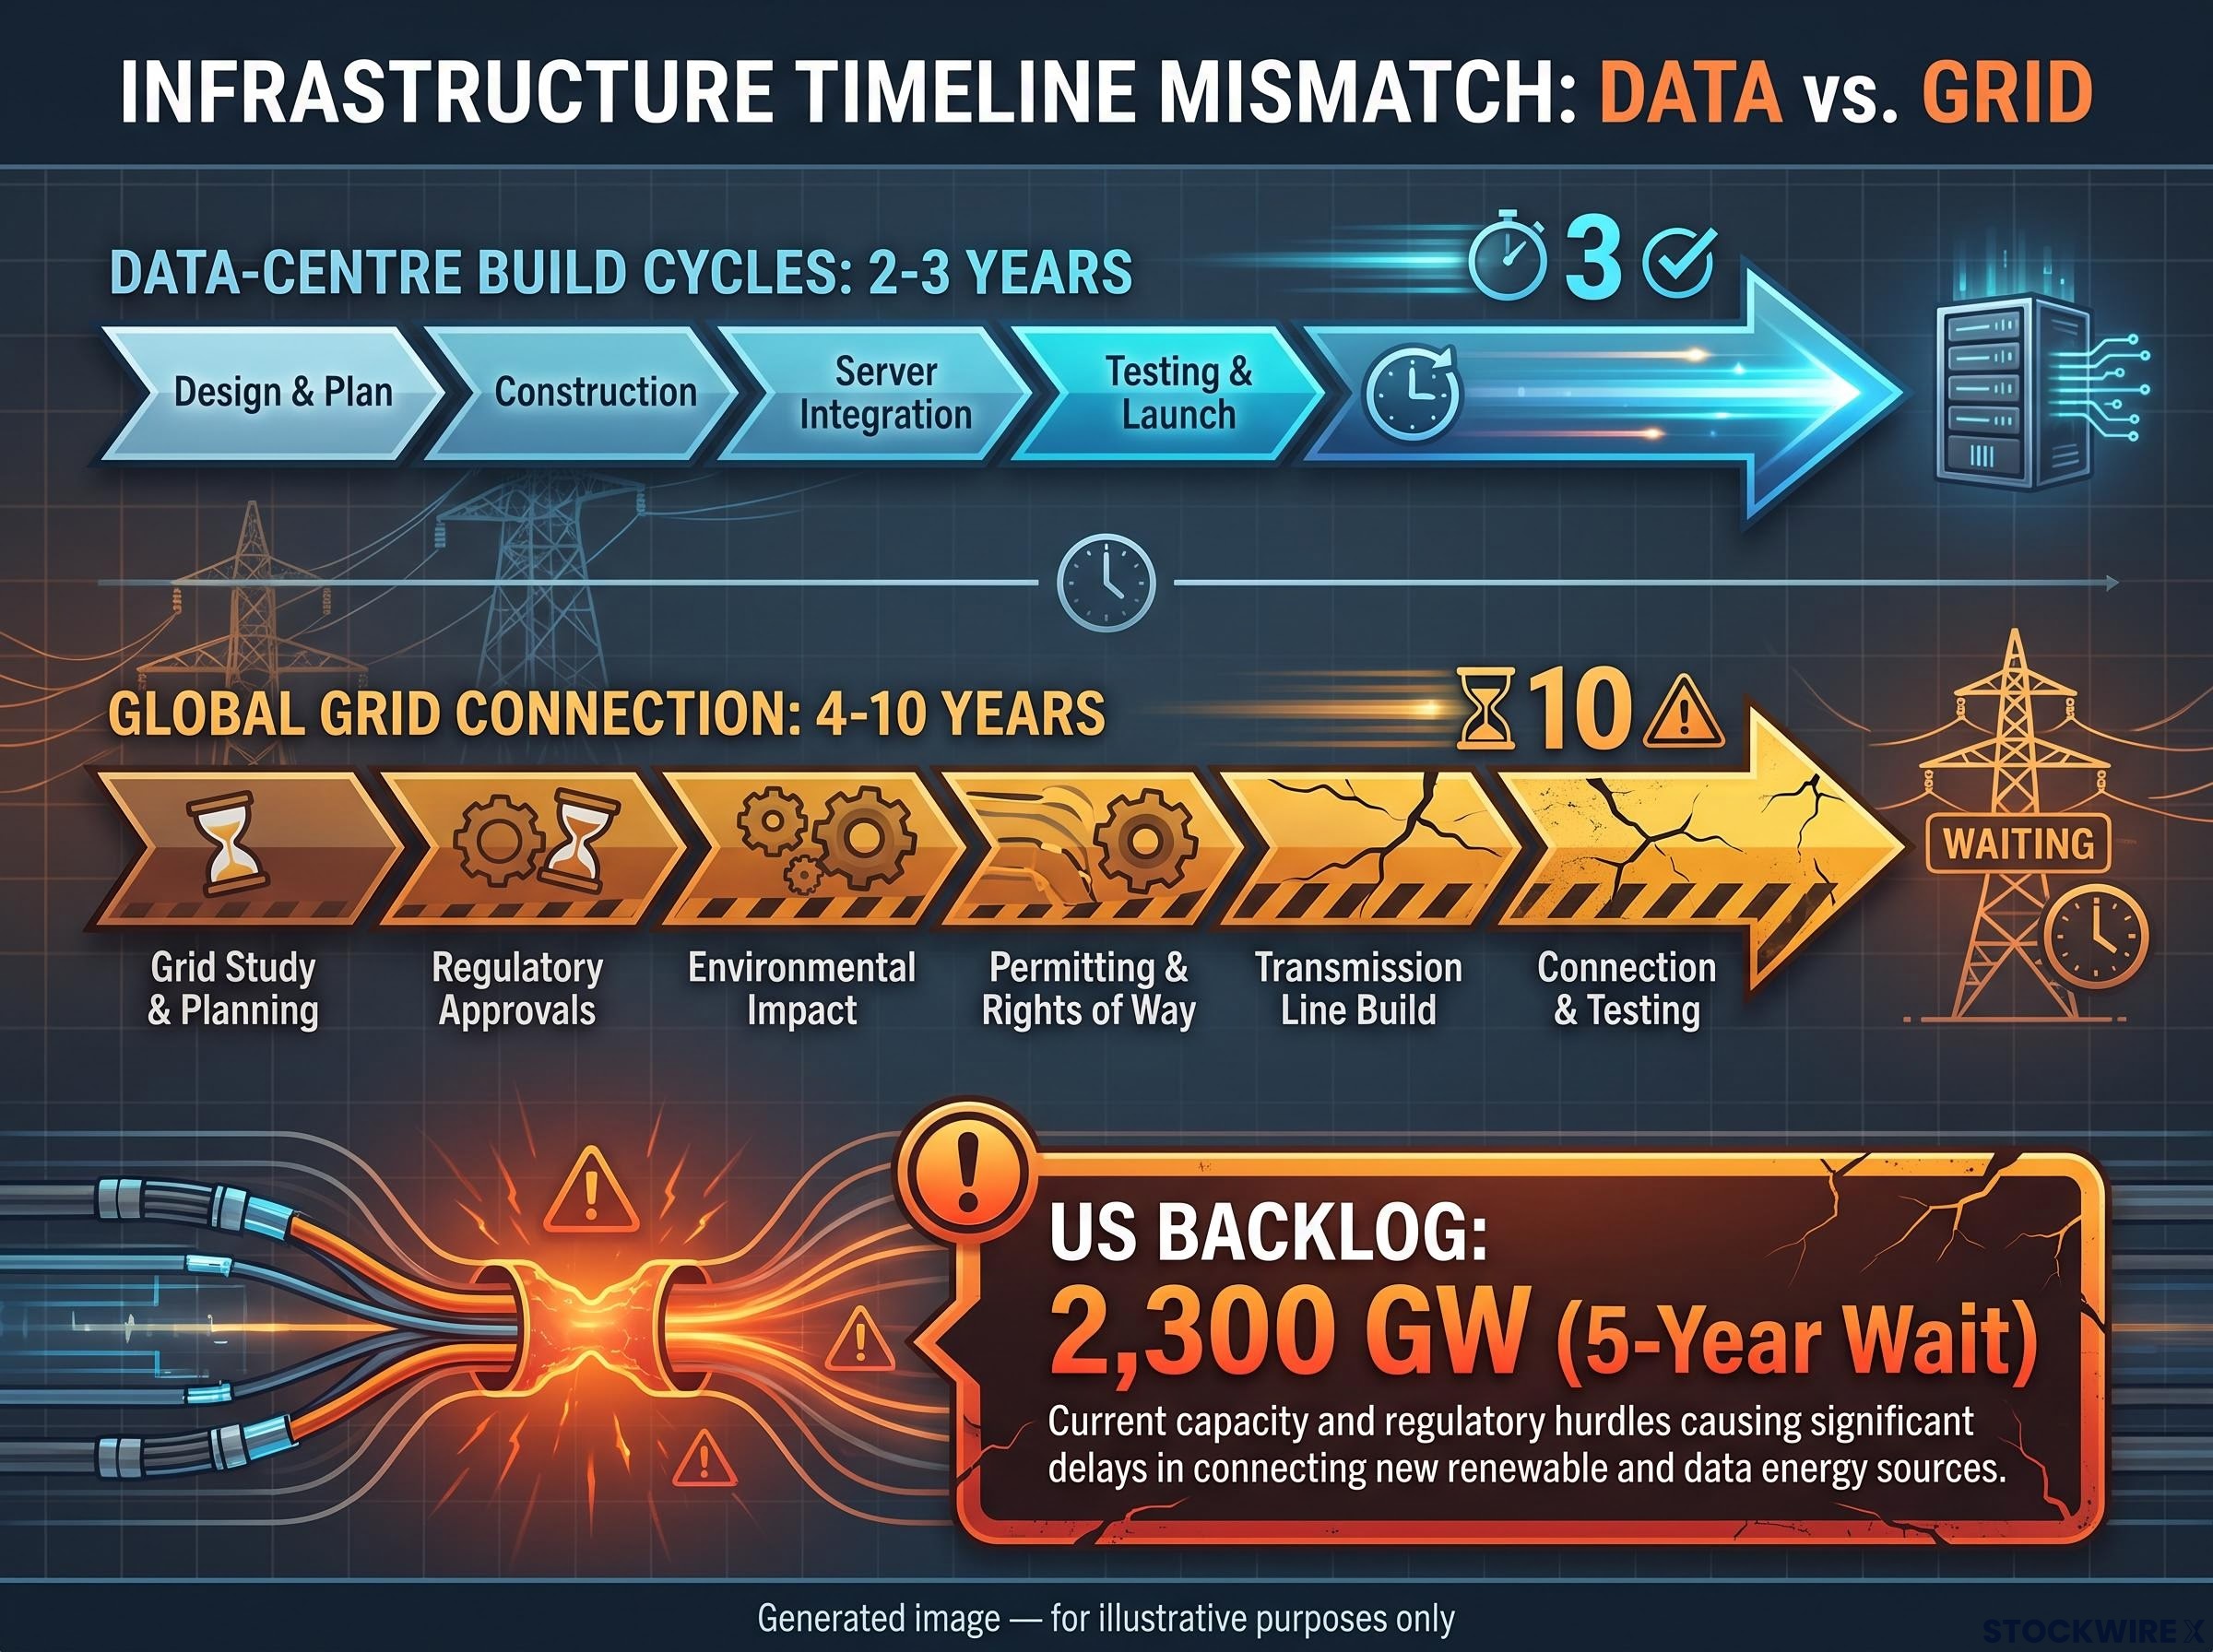
That mismatch is the whole thesis. A physical constraint that takes four to ten years to clear cannot be resolved quickly, which reframes energy infrastructure from a cyclical bet on power prices into a structural position on a bottleneck that is not going anywhere.
The industry knows it. A 2026 Capgemini survey of electricity executives found 84% citing permitting delays and insufficient reserve margins, and 76% flagging interconnection bottlenecks. The constraint breaks down into three categories:
- Permitting delays and insufficient reserve margins
- Interconnection bottlenecks clogging the connection queue
- Aging infrastructure and supply-chain pressures
This is precisely why behind-the-meter and on-site generation, from fuel cells to co-located power assets, has emerged as an investable theme rather than a curiosity. When the grid queue makes a grid-dependent build unviable on AI timelines, on-site power stops being optional. The IEA has documented a regulatory moratorium on new data centres in Greater Dublin because of grid congestion, a real-world policy ceiling that confirms the constraint is structural, not temporary.
The capital has noticed. The Energy Select Sector SPDR Fund (XLE) is up 22% year-to-date and the Industrial Select Sector SPDR Fund (XLI) up 17%, as money rotates into power management and grid modernisation names. For investors who filed energy and industrials under “defensive,” the reframe matters: these are structural AI infrastructure plays hiding outside the technology sector.
Memory as the overlooked bottleneck: the HBM supply gap
Inside an AI system, throughput does not stall at the GPU as often as most assume. It stalls at memory. Memory subsystems can account for up to 50% of total AI system power, and high-bandwidth memory (HBM), a stacked memory design that sits close to the processor to move data faster, has been identified as the primary operational bottleneck rather than compute itself.
That reframing is why the sector is capturing second-wave attention, and the market-structure data shows why the trade is structural rather than cyclical. According to Yole Group, whose figures sit more conservatively than some projections, HBM revenue nearly doubled in 2025 to approximately US$34 billion and is projected to reach roughly US$98 billion by 2030, a 33% compound annual growth rate. Yole also expects HBM to exceed 50% of the DRAM market’s total revenue by 2030.
The supply side tells the same story from a different angle. TrendForce data indicates HBM wafer input among the top three suppliers will account for roughly 18% of total DRAM wafer input by the end of 2025, rising to 22% in 2026 and 30% by 2027.
| Year | HBM wafer input (% of total DRAM wafer input) | HBM bit supply (% of total DRAM) |
|---|---|---|
| 2025 | ~18% | 8% |
| 2026 | 22% | 9% |
| 2027 | 30% | 13% |
The shortage is severe. D.A. Davidson analysts note that HBM demand is already running at more than double current supply, with structural shortages expected to last through 2026-2027.
The HBM supply shortage has already produced concrete earnings evidence: memory companies recorded year-on-year earnings growth of more than 900% in a single quarter in 2026, with DRAM contract prices surging 90-95% in Q1 alone, confirming that the pricing power the structural shortage creates is translating directly into reported financials rather than remaining a forward projection.
The supply gap HBM demand is already more than double current supply, according to D.A. Davidson, with structural shortages expected to persist through 2026-2027.
There is a catch, and it changes how you should size the position. Supply is highly concentrated, with SK hynix holding approximately 50-58% market share on 2026 quarterly data, gradually declining from 2025 highs as Samsung gains ground. More importantly, the aggressive capacity expansion answering today’s shortage could tip the market into oversupply after 2027.
That combination, a defined shortage window paired with a concentrated supplier base and a real oversupply risk on the other side, tells you this is a high-conviction theme with a time horizon, not a perpetual growth story. It demands exit discipline, not just entry enthusiasm. For investors who parked their AI hardware exposure entirely in GPU designers, the operational bottleneck has already shifted downstream, and the asymmetric opportunity may now sit in memory.
Enterprise software and cybersecurity: the sector that was supposed to lose
The early consensus was that AI would render Software as a Service obsolete. That call was wrong. Rather than being displaced, enterprise software and cybersecurity platforms are integrating AI to expand recurring revenue, and the operational data is where the reversal becomes visible.
Cybersecurity makes the clearest case. Studies from MixMode, ACSM, and Sagetap show that 74% of mid-to-large organisations have already deployed AI-powered threat detection tools. Adoption is accelerating fastest in threat detection and response, at 40%.
The return on that adoption shows up inside security operations centres:
- 57% report faster alert resolution
- 55% say AI frees up analyst bandwidth
- 50% cite improved real-time threat detection
Operational ROI is one thing. The financial translation is what separates a structural winner from a tactical rebound.
What to look for in the software layer: pricing power and NRR as the filters
A 2025 BankChampaign note highlights that AI-powered features are lifting average revenue per user (ARPU) by 15-25% through premium tier upgrades. That is not a forward projection. It is already in the reported numbers, which means the analytical work now shifts to identifying which names have pricing power durable enough to sustain that margin expansion.
Where the money shows up AI-powered features are raising average revenue per user by 15-25% via premium tier upgrades, according to a 2025 BankChampaign note.
Two financial signals do the filtering:
- Pricing power: whether the vendor can raise prices without losing customers
- High net revenue retention (NRR): whether existing customers spend more over time
Net revenue retention measures how much revenue a company keeps and grows from its existing customer base, after accounting for cancellations. A figure comfortably above 100% tells you customers are expanding their spend, which is the difference between a genuine AI-integrated winner and a company simply relabelling existing features as AI.
Discipline matters here, because the reversal is now partly recognised. Goldman Sachs strategists caution that valuation expansion in AI software may already be priced in for some names, making the split between structural winners and tactical rebounds the entire analytical task. Software names breaking out from multi-month consolidation bases can offer asymmetric setups, but only where pricing power and NRR support the move.
For investors seeking AI exposure with a more predictable cash-flow profile, this is the application layer: lower volatility than hardware, recurring revenue, and demonstrated pricing power. It warrants direct attention, not a default underweight.
Building a position in the second phase: tranche accumulation and the cash buffer
Knowing where the capital is settling is only half the problem. The other half is how to deploy into a volatile, multi-year theme without making a binary timing error, and that is a question of process, not prediction.
Start with the cash reserve. Holding a disciplined 15-20% cash buffer is not defensiveness. It is the mechanism that lets you accumulate at pullback levels rather than chase momentum after a name has already run.
Cash acts as the option on lower future prices.
Being fully deployed removes your capacity to act when the dislocations that matter most actually occur. That reframes cash from a drag into an option: the flexibility to turn volatility into an entry rather than a threat.
Tranche-based deployment is the antidote to all-in-or-all-out timing. Rather than a single entry, you stage buying across defined levels:
- Identify a high-conviction theme with a structural demand driver, drawn from the sectors above.
- Apply the filter: require the price to be within 40% of its 52-week low before deploying a tranche, so you accumulate on weakness rather than strength.
- Stage the accumulation across multiple tranches rather than committing the full position at once.
Institutional models apply exactly this discipline. The Truman State University fund holds roughly 17% cash while capping AI and semiconductor allocation at 20% and energy at 17%, a live example of theme conviction paired with hard limits.
The three preferred deployment categories map directly onto the analytical work above:
- Enterprise software and cybersecurity with pricing power and expanding margins, the lower-volatility application layer.
- Energy and grid infrastructure, the physical backbone of the compute build-out.
- Free-cash-flow generators that buy back shares and grow dividends regardless of macroeconomic friction.
The discipline is warranted. Goldman’s Delta One desk has warned that collapsing prices for AI-linked tokens could pressure broader tech valuations if user adoption fails to absorb the infrastructure pipeline coming online. The cash buffer is what lets you respond to that scenario instead of being trapped by it.
What the rotation tells you about where AI value creation is actually settling
The move from chip designers into energy infrastructure, memory hardware, and enterprise software is not a trade call. It is a structural recalibration of where the AI value chain generates durable earnings, anchored by the simple fact that roughly 75% of infrastructure spend now sits outside chips.
The three demand drivers are worth holding in mind as a single mental model:
- Energy infrastructure: a physical grid bottleneck of 4-10 year connection queues against 2-3 year build cycles.
- Memory hardware: an operational shortage running at more than double supply through 2026-2027.
- Enterprise software: an application layer already lifting ARPU by 15-25% in reported numbers.
None of this removes the need for discipline. The 44% returns against 9% EPS growth flagged by Goldman Sachs Research remains the check on enthusiasm, the HBM shortage carries a real post-2027 oversupply risk, and some software valuations may already be full. Free-cash-flow generation, pricing power, and NRR are the filters that survive across all three sectors regardless of which phase the trade is in.
Across all three destination sectors, the durability of the position ultimately depends on ecosystem switching costs rather than the hardware-versus-software classification: companies that embed themselves in customer workflows accumulate the re-platforming friction that sustains pricing power across cycles, and that variable cuts across energy, memory, and software in ways that sector labels alone do not capture.
The AI trade is not over. It has moved, and the analytical work required to capture the second phase is harder and more sector-specific than buying the GPU leaders was in 2023. The investors best positioned are those who have mapped the structural driver in each sector and kept the cash discipline to buy at rational entry points.
This article is for informational purposes only and should not be considered financial advice. Investors should conduct their own research and consult with financial professionals before making investment decisions. Past performance does not guarantee future results, and financial projections are subject to market conditions and various risk factors. These statements are speculative and subject to change based on market developments and company performance.