
What UK Traders Lose When Their CFD Account Goes Offshore
6 hrs ago

UK gilt yields have swung by 25-40 basis points in a matter of days on Labour leadership headlines in May 2026, yet the government’s annual interest bill has barely moved. That gap between market drama and fiscal reality is exactly what investors need to understand.
With the 10-year gilt yield sitting near 5.00% and the 30-year at 5.66% as of mid-May 2026, political turbulence is generating genuine anxiety about whether UK government debt remains sustainable. The headlines are loud. The mechanics underneath them are quieter and considerably more reassuring than the noise suggests.
What follows builds the conceptual toolkit for separating short-term sentiment-driven yield spikes from genuine long-run debt sustainability signals: how average debt maturity buffers the budget, what the 8.7% debt-servicing-to-revenue ratio means against international peers, and why inflation-linked gilts behave differently from the fiscal horror story often told about them.
The transmission mechanism is straightforward. When Wes Streeting’s resignation plans became known, gilt yields rose as traders repriced the probability of fiscal policy continuity. Once the resignation was confirmed, yields partially retraced as the uncertainty compressed into a known outcome. The sequence played out over days, not weeks.
The speed of this repricing reflects how price discovery in bond markets operates: a single data release or political headline can simultaneously move gilt yields, sterling, and equity valuations within minutes as competing participants update their bids and offers across interconnected markets.
These moves are term-premium and risk-sentiment adjustments, not a repricing of UK default risk. The evidence sits in the spread data: UK-Bund spreads widened on stress days and then narrowed back, consistent with political noise rather than a structural regime shift. Sterling weakness was visible during the worst sessions but remained well short of crisis levels.
Three observable markers distinguish sentiment-driven yield moves from fundamental repricing:
“Changes in risk premium and liquidity conditions, not doubts about the UK’s willingness or ability to pay.”
Bank of England characterisation of recent gilt yield spikes
Markets process political headlines rapidly, which is precisely why sentiment spikes are often short-lived and distinct from structural fundamental shifts. The distinction matters for everything that follows.
A yield spike on a trading screen looks like an immediate fiscal event. It is not. The reason sits in a single number: the average maturity of UK government debt is approximately 13.9 years (DMO, as of 14 May 2026), broadly consistent with the 13.9-year figure from the DMO’s Debt Management Report 2026-27.
Average maturity refers to the weighted average time until the government’s outstanding bonds come due for repayment. Because that average is nearly 14 years, only a small fraction of total debt matures and must be refinanced at prevailing market rates in any given year. The vast majority of the portfolio continues paying the coupons locked in at original issuance.
The DMO Debt Management Report 2026-27 confirms the average maturity of the total gilt stock at 13.9 years as of end-December 2025, explicitly framing long average maturity as the primary mechanism for reducing the government’s exposure to refinancing risk when market conditions deteriorate.
This means a sudden rise in gilt yields does not translate into a proportionate jump in the government’s annual interest bill. The pass-through is slow and partial. The UK’s long average maturity is among the highest in the OECD, a structural buffer that most peers cannot claim to the same degree.
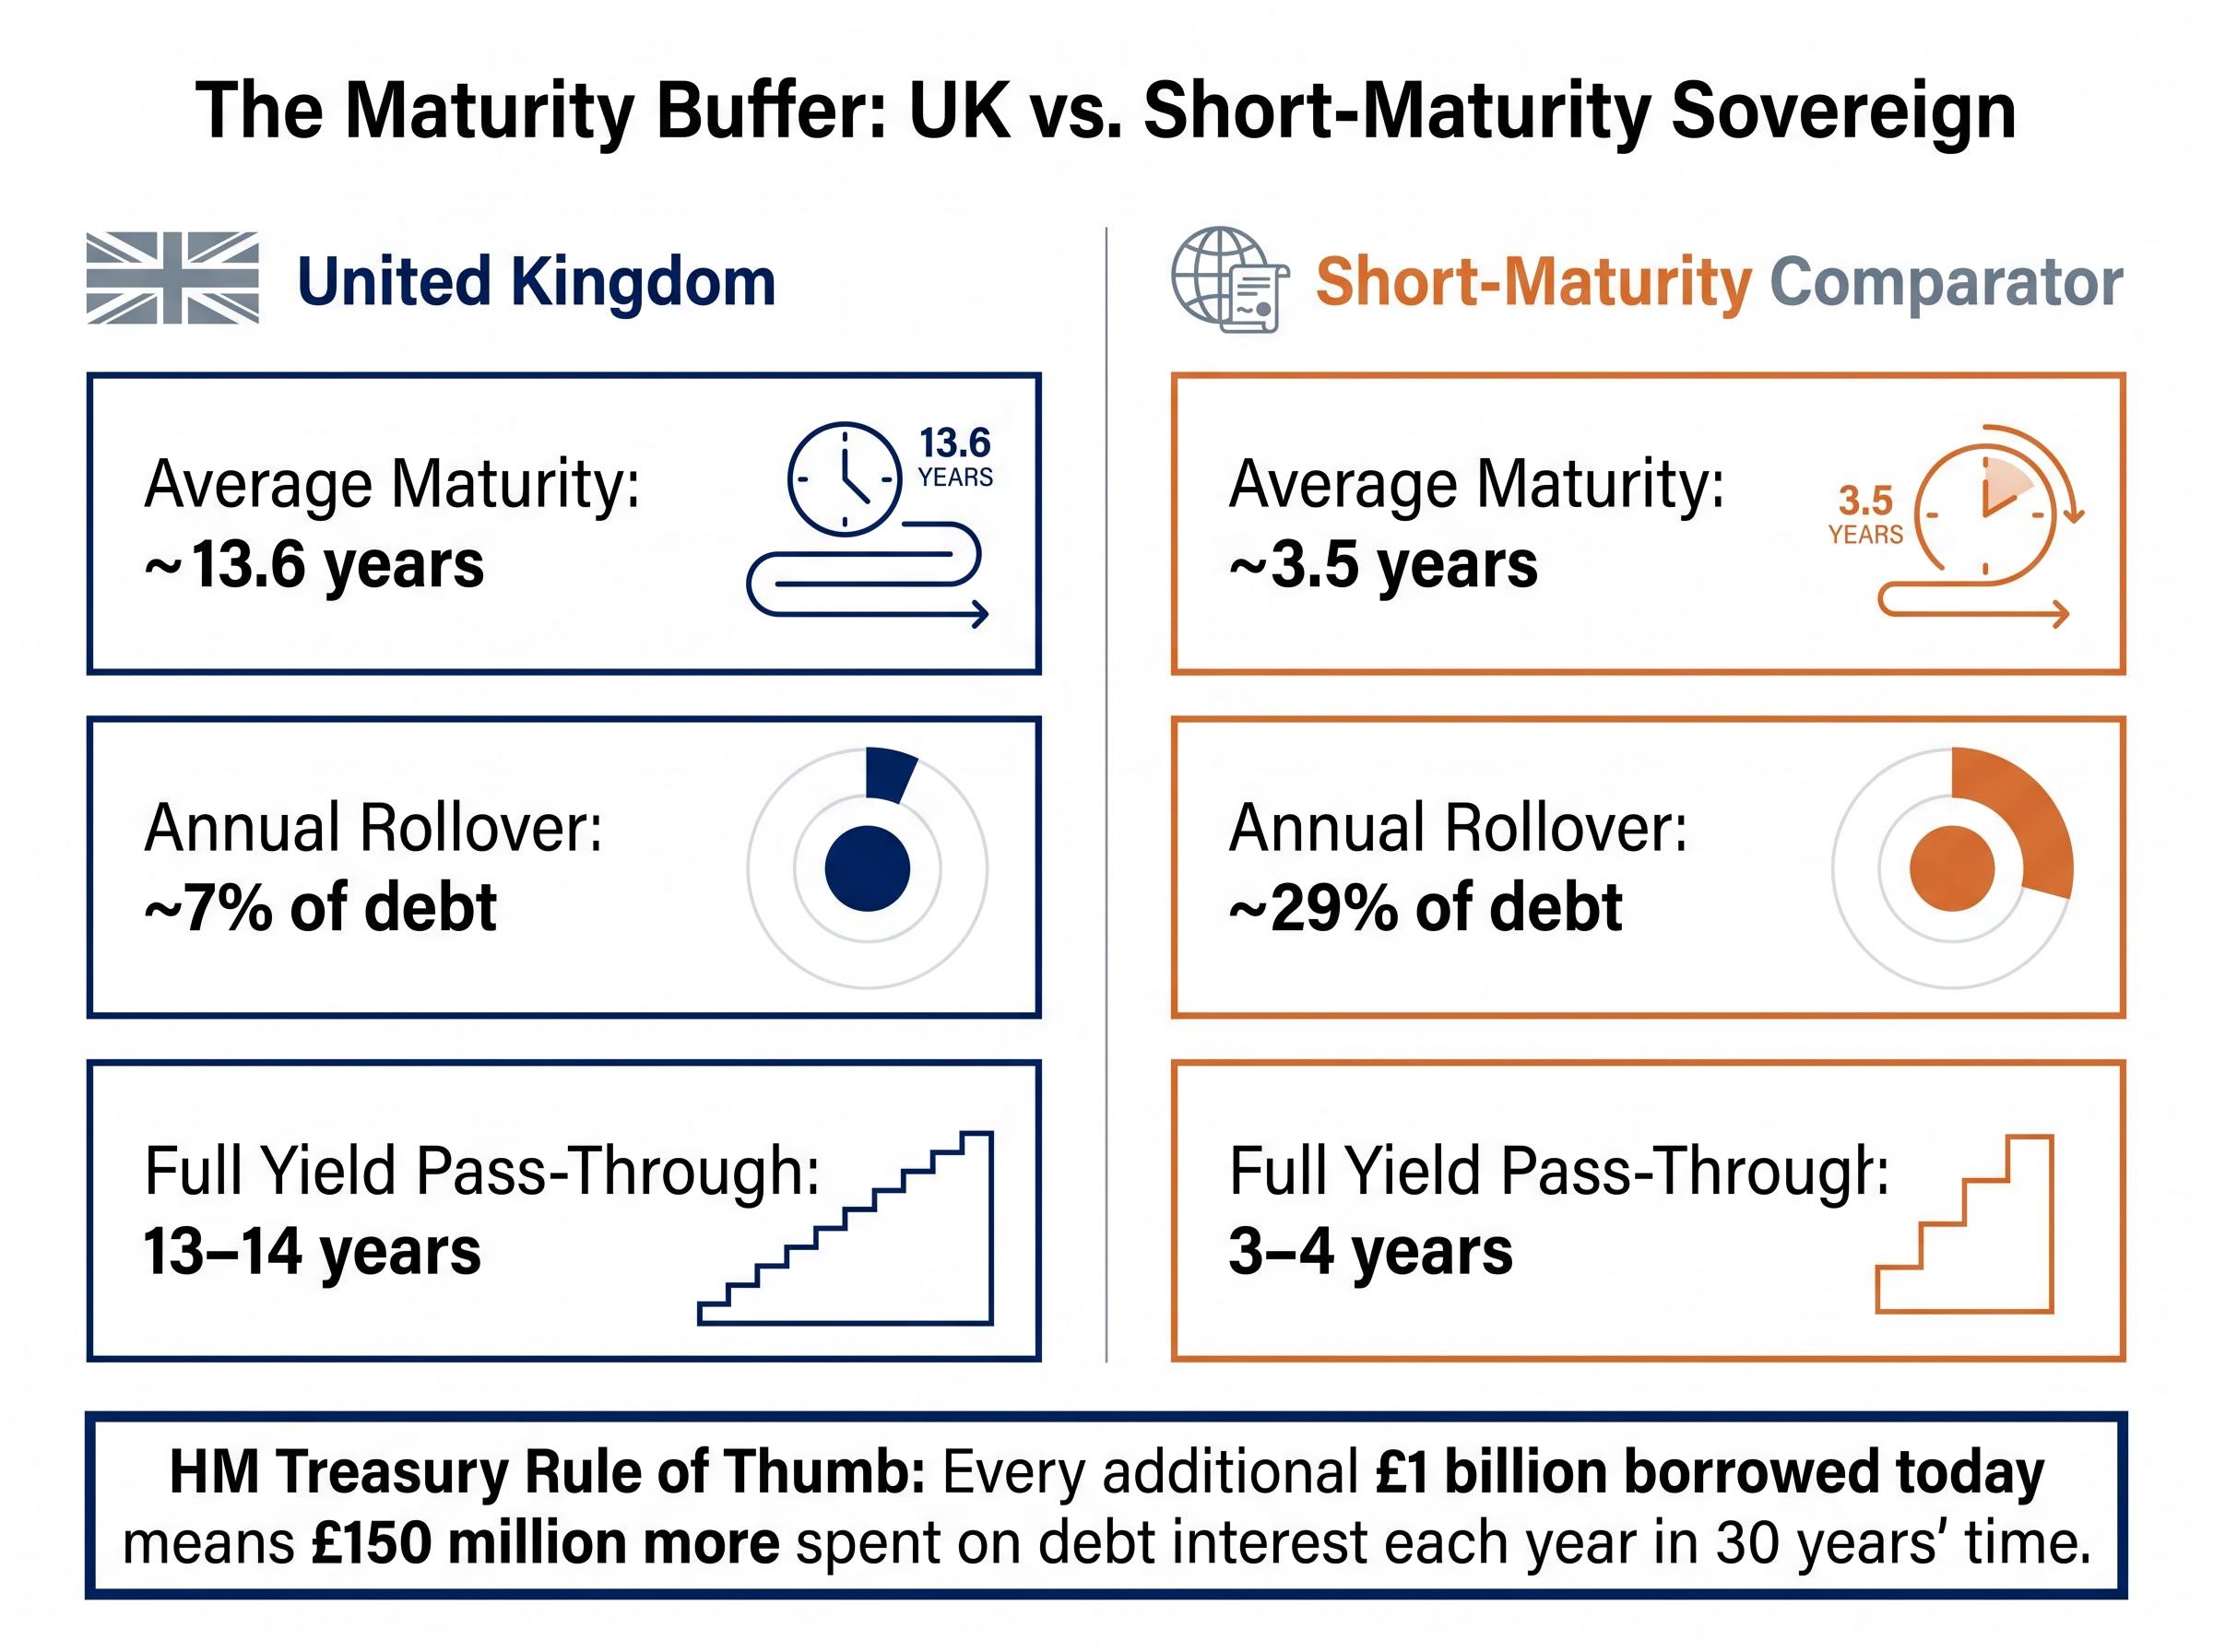
| Scenario | Average Maturity | Annual Rollover Fraction | Time for Full Yield Pass-Through |
|---|---|---|---|
| United Kingdom | ~13.6 years | ~7% of outstanding debt | 13-14 years |
| Short-maturity comparator | ~3.5 years | ~29% of outstanding debt | 3-4 years |
The full effect of higher yields unfolds gradually over a decade or more. This gives policymakers time to adjust spending and taxation before being forced into emergency fiscal action. As HM Treasury has illustrated, every additional £1 billion borrowed today means £150 million more spent on debt interest each year in 30 years’ time. The cost is real, but it accrues slowly.
The trade-off is worth noting. Longer maturities carry a term premium cost, meaning the government pays slightly more in expected terms for the privilege of locking in rates for longer. That premium is the price of insurance against short-term market disruptions. The OBR has characterised the UK’s borrowing as 3% of GDP higher than the level needed to durably stabilise debt, a gap that the maturity buffer makes manageable in the near term but that still requires a credible medium-term plan.
The number first. Over the 12 months ending April 2026, UK debt interest payments consumed approximately 8.7% of tax revenue, according to ONS data. In February 2026 alone, the monthly debt interest bill was £13.0 billion, up £5.5 billion year-on-year. Roughly £1 in every £10 of total public spending now goes to servicing debt.
That burden is real and elevated. Public sector net debt stands at 93.8% of GDP (March 2026, ONS), projected to reach approximately 94.9% by the end of 2026. The UK ranks sixth highest in debt-to-GDP among advanced economies, according to the OBR’s Fiscal Risks and Sustainability report.
The broader evidence on sovereign debt sustainability across advanced economies supports this calibration: the UK’s breach of 100% debt-to-GDP in September 2024 was followed by approximately 30% equity market gains rather than the funding crisis that raw ratio comparisons might suggest, a pattern that Japanese, French, and US precedents reinforce.
The OBR Fiscal Risks and Sustainability report quantifies the scale of the consolidation challenge: UK borrowing remains approximately 3% of GDP above the level required to durably stabilise debt, and underlying public debt has reached its highest share of GDP since the early 1960s, a combination that frames the current position as a structural medium-term problem rather than an imminent funding crisis.
The international context, however, provides calibration. The UK is not an outlier.
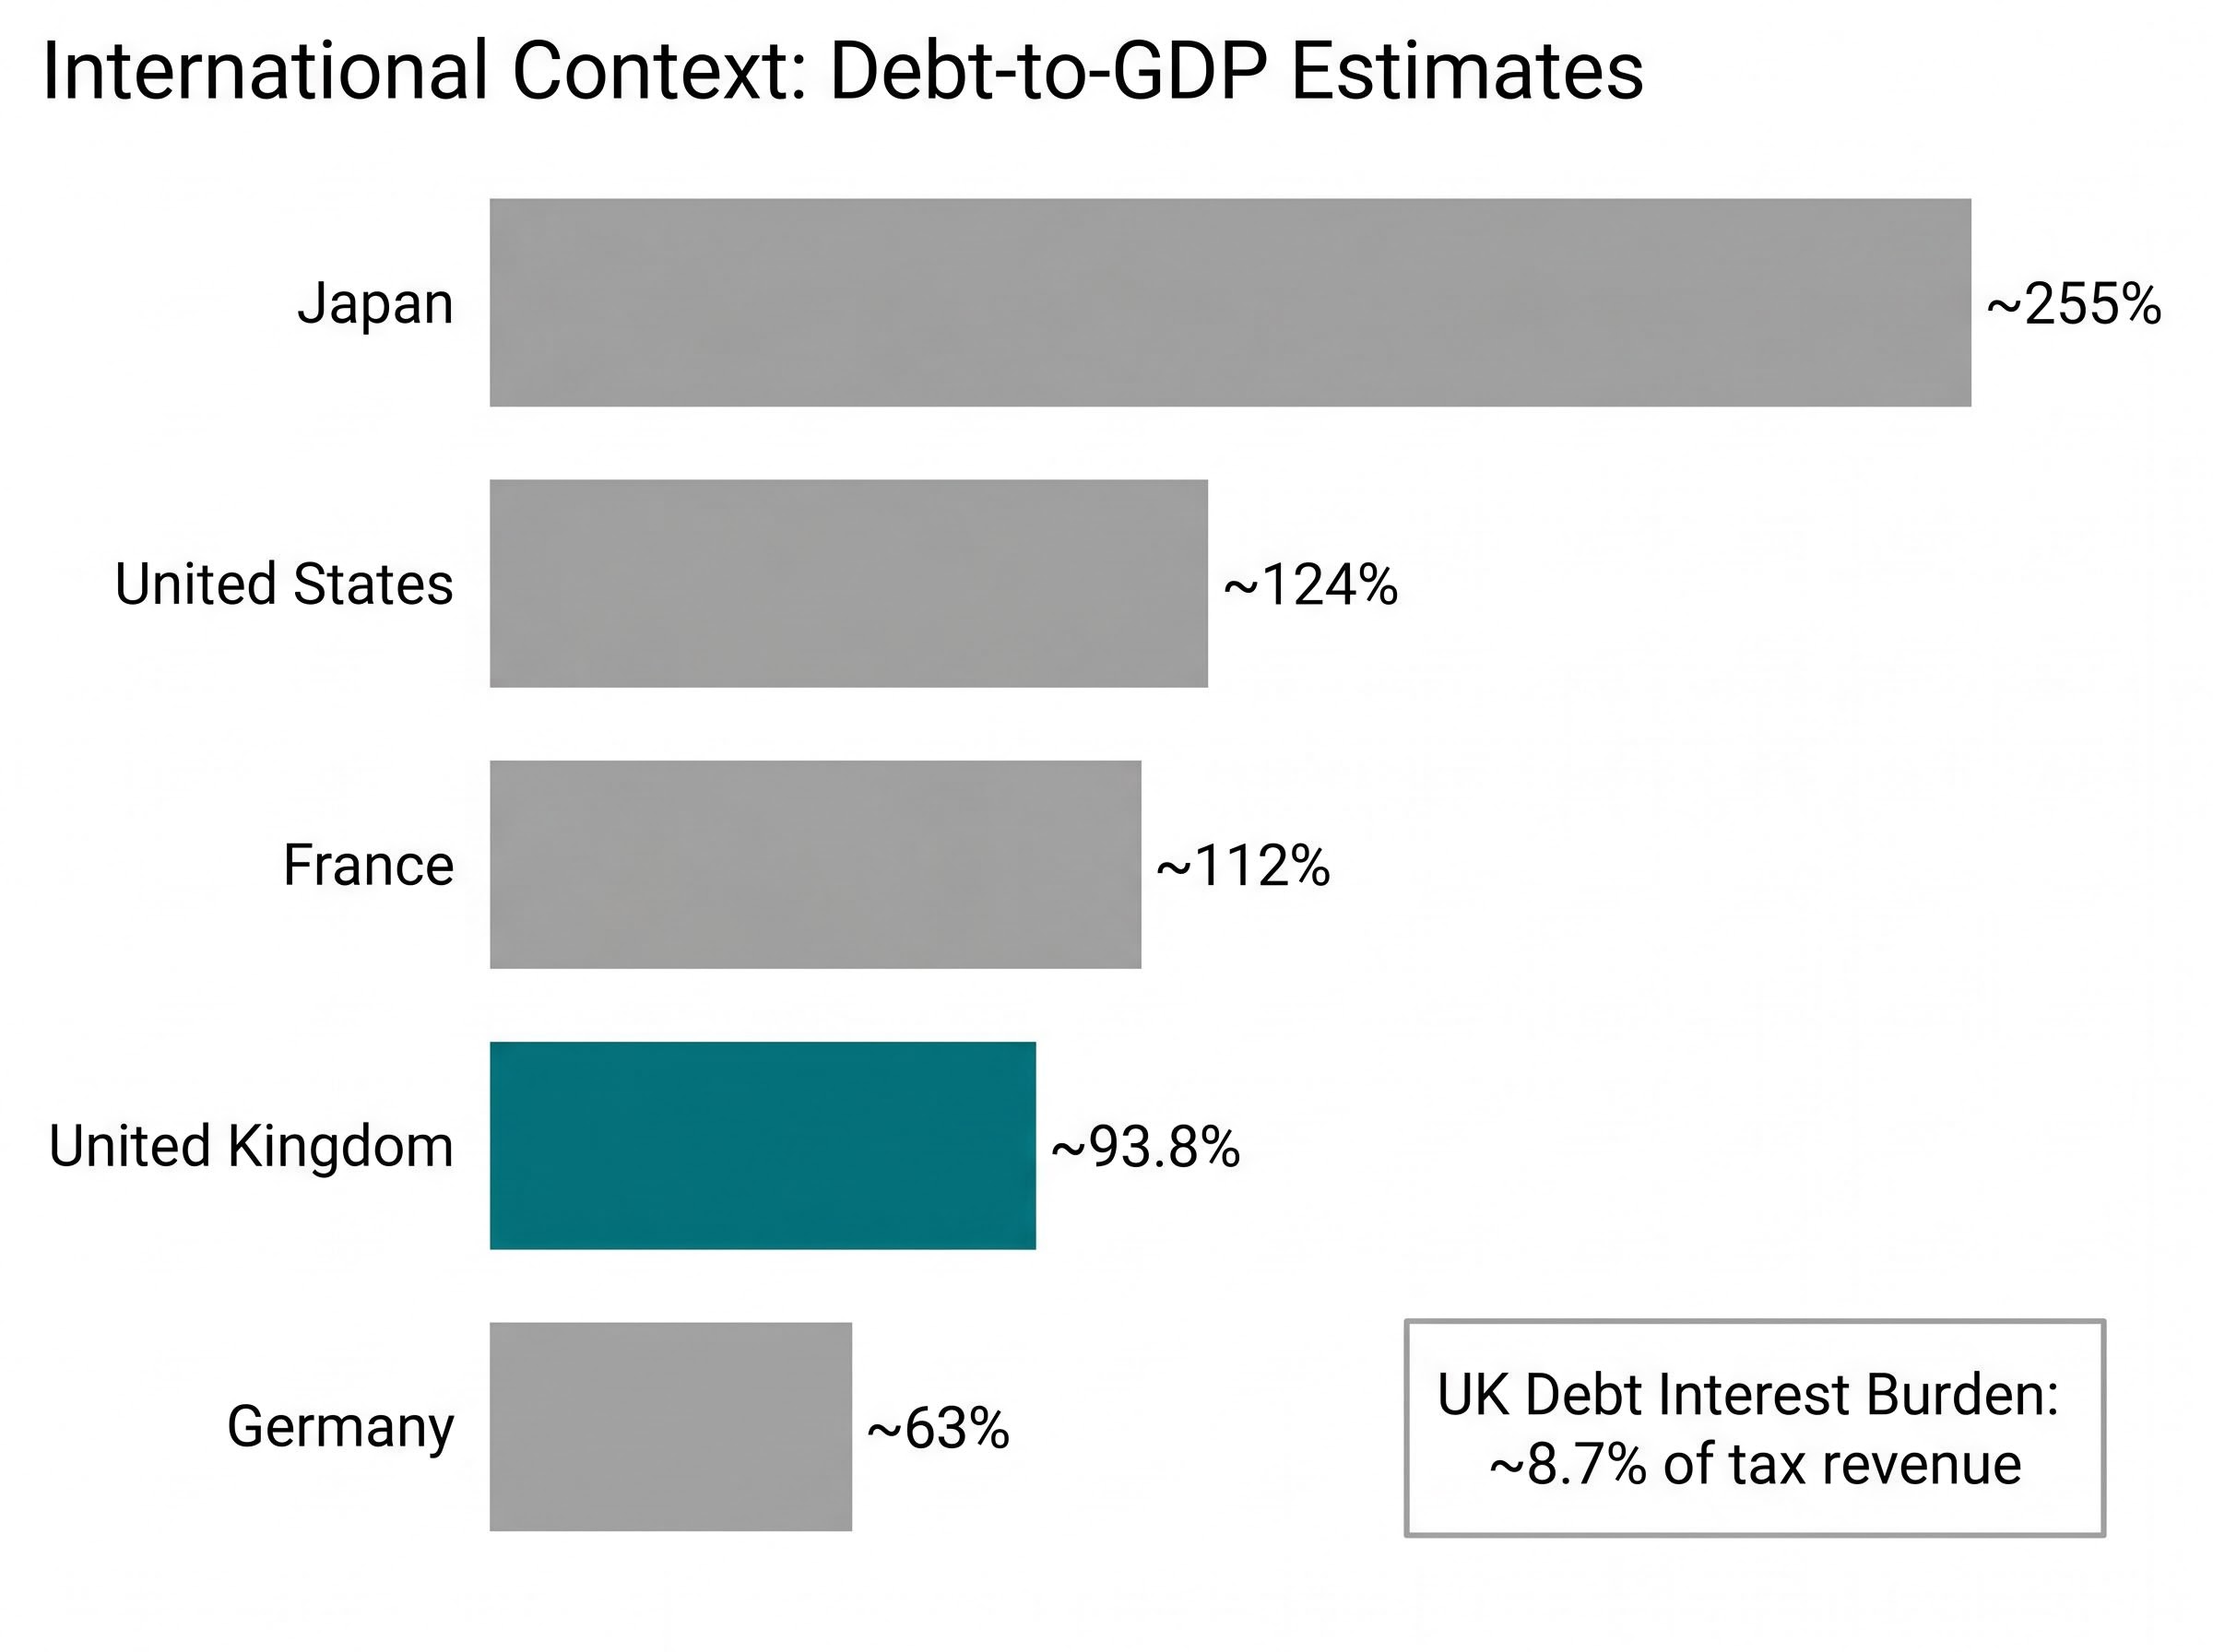
| Country | Approximate Debt-to-GDP | Relative Interest-to-Revenue Burden | Position |
|---|---|---|---|
| Germany | ~63% | Low | Most fiscal headroom |
| France | ~112% | Similar to UK | Comparable burden |
| United Kingdom | ~93.8% | ~8.7% of tax revenue | Elevated, not extreme |
| United States | ~124% | Above UK | Higher and rising |
| Japan | ~255% | Highest (partially cushioned by legacy low coupons) | Structural outlier |
“A substantial erosion of the UK’s capacity to respond to future shocks.”
OBR, Fiscal Risks and Sustainability, July 2025, describing the rise from 36% of GDP in 2007 to 93.8% today
The 8.7% figure anchors the sustainability debate. It shows a real and elevated burden that warrants monitoring, but one that remains within the range of comparable advanced economies and well below the levels that would signal an imminent funding crisis.
The common belief is straightforward: when inflation is high, index-linked gilts automatically amplify the government’s interest costs, making the fiscal position worse. The March 2026 data contradicts this. Despite CPI running at 3.3% (up from 3.0% in February), inflation-linked bonds actually reduced the interest cost burden that month.
The explanation lies in the mechanics. Linker costs are not driven solely by the headline inflation number. Three factors interact:
The single factor the misconception focuses on, headline inflation, is only one input.
During recent political stress episodes, nominal gilts tended to sell off more sharply than index-linked gilts. That differential is informative. It suggests the market is pricing a fiscal loosening or risk-premium story, not a pure inflation repricing.
Government bond behaviour under stress is not uniform: whether a crisis is deflationary (like the GFC) or inflationary (like a supply shock) determines whether nominal gilts rally or sell off, which is why the differential performance between nominal and index-linked gilts during political episodes carries diagnostic value beyond simple yield level comparisons.
When Bank of England communications re-asserted focus on the 2% inflation target, breakeven inflation rates (the gap between nominal and linker yields) compressed and linker performance stabilised. With the BoE base rate at 3.75% following gradual easing from a peak of 5.25%, the inflation picture is one of stickiness above target rather than runaway acceleration. That distinction matters for how investors interpret linker-related headlines.
Daily yield moves, political headlines, and individual auction results generate noise. The signals that genuinely determine whether UK debt dynamics are on a sustainable path move slowly and deserve a different kind of attention.
“A new shock could prompt foreign investors to dump gilts.”
Catherine Mann, Bank of England MPC member, May 2026
That warning from the BoE’s Mann identifies the single most market-sensitive near-term vulnerability. Foreign investor concentration risk is the channel through which political noise could, in a severe stress scenario, become something more structural.
The framework assembled across this article resolves into a clear set of priorities. Short-term yield spikes around political events are largely noise, given the 13.6-year maturity buffer. The 8.7% debt-servicing ratio is elevated but not extreme by international standards. The real vulnerabilities are slow-moving: debt-to-GDP drift, foreign investor concentration, productivity stagnation, and fiscal rule credibility erosion.
Negative sentiment already priced into UK gilts and equities over recent months may have reduced the capacity for additional adverse surprises, though this observation should not be read as a directional call. The relevant forward-looking window for assessing whether structural drivers are improving or deteriorating spans approximately 3-30 months ahead.
Even political change faces structural constraints. As of 14 May 2026, approximately 100 Labour MPs had co-signed a market-friendly fiscal proposal, illustrating that a leadership transition would still operate within established fiscal guardrails.
The noise to filter out versus the signals worth monitoring:
Three data releases deserve priority each month:
Disorderly auction outcomes, defined as uncovered issuance or a sharp deterioration in bid-to-cover ratios, would constitute a genuine signal worth attention. Routine yield volatility around political events is not.
Investors wanting to translate this sustainability framework into portfolio positioning decisions will find our dedicated guide to inflation investing strategies covers the specific fixed-income tilts, yield curve positioning, and portfolio construction approaches suited to an environment of sticky inflation and elevated but manageable sovereign debt levels.
The OBR’s own characterisation frames the position accurately: a medium-term consolidation challenge, not a near-term solvency or funding crisis. The UK’s structural features, including its long debt maturity, liquid gilt market, independent central bank, and fiscal rule framework, distinguish it from sovereigns facing genuine near-term funding stress. The honest caveats remain: foreign investor concentration, sticky inflation, and an eroded shock-absorption buffer mean the margin for error is thinner than it was a decade ago.
This article is for informational purposes only and should not be considered financial advice. Investors should conduct their own research and consult with financial professionals before making investment decisions.
Past performance does not guarantee future results. Financial projections are subject to market conditions and various risk factors.
The average maturity of UK government debt is approximately 13.9 years as of May 2026, meaning only a small fraction of total debt must be refinanced at prevailing market rates each year. This long maturity acts as a structural buffer, slowing the pass-through of yield spikes into the government's actual annual interest bill.
The 8.7% figure means roughly one pound in every ten of tax revenue goes toward servicing debt interest, which is elevated but comparable to peer economies like France and well below levels that would signal an imminent funding crisis. International comparisons show Germany is lower but the US and Japan both carry higher relative burdens.
Index-linked gilt costs depend on real yield levels, accrual timing, and specific redemption dates, not just the headline inflation figure. In March 2026, despite CPI running at 3.3%, inflation-linked bonds actually reduced the interest cost burden for that month, illustrating why the common assumption that high inflation automatically worsens linker costs is often wrong.
The most informative signals are the debt-to-GDP trajectory (currently at 93.8% and projected to edge higher), sustained changes in foreign investor participation in gilt auctions, Bank of England credibility as measured by breakeven inflation stability, and whether fiscal rules are met or revised. Day-to-day yield swings on political headlines are generally noise rather than structural signals.
Gilt markets repriced rapidly when Wes Streeting's resignation plans became known, as traders adjusted their expectations for fiscal policy continuity, then partially retraced once the outcome was confirmed. The UK-Bund spread widened and then mean-reverted within days, which is consistent with sentiment-driven volatility rather than a fundamental reassessment of UK creditworthiness.