The strange thing about this September is not that Wall Street’s biggest desks have turned cautious. It is that their caution may be the very thing that sets up the rally they are warning you against. When institutions tell investors to trim risk in the worst-performing calendar month on record, they are, in effect, helping clear the seller pool that contrarian rebounds feed on.
Here in the first week of September 2026, that tension is unusually sharp. This is the month with the weakest average equity returns in the historical record, and major sell-side trading desks have shifted tactically defensive ahead of the September Federal Open Market Committee (FOMC) decision. That convergence of bearish signals is precisely the setup contrarian analysis exists to interrogate.
This piece gives you a structured lens for reading that setup. By the time you finish, you will know how to judge whether the current bearish consensus is a warning to respect or a contrarian entry signal to act on, and which specific variables will decide which version of the quarter actually unfolds.
What makes the September bearish consensus unusual this year
The September Effect is real enough as a starting point: September has consistently posted the weakest average monthly returns for US equities, and that reputation drives early selling and defensive hedging every year. What complicates the picture in 2026 is that the sentiment behind the caution is not uniform. It is split down the middle.
The September Effect is real enough as a starting point, though the underlying data is more ambiguous than the seasonal narrative implies: the median return since 1925 is +0.1% and roughly 52% of all Septembers have finished positive, making the month closer to a coin flip than a reliable decline.
On one side sits the retail investor, sitting roughly at historical average. On the other sits the institutional investor, positioned about as aggressively as the data allows. That divergence matters, because the standard contrarian trigger, the moment when everyone has capitulated, is only partially in place.
Retail sentiment: near average, not extreme
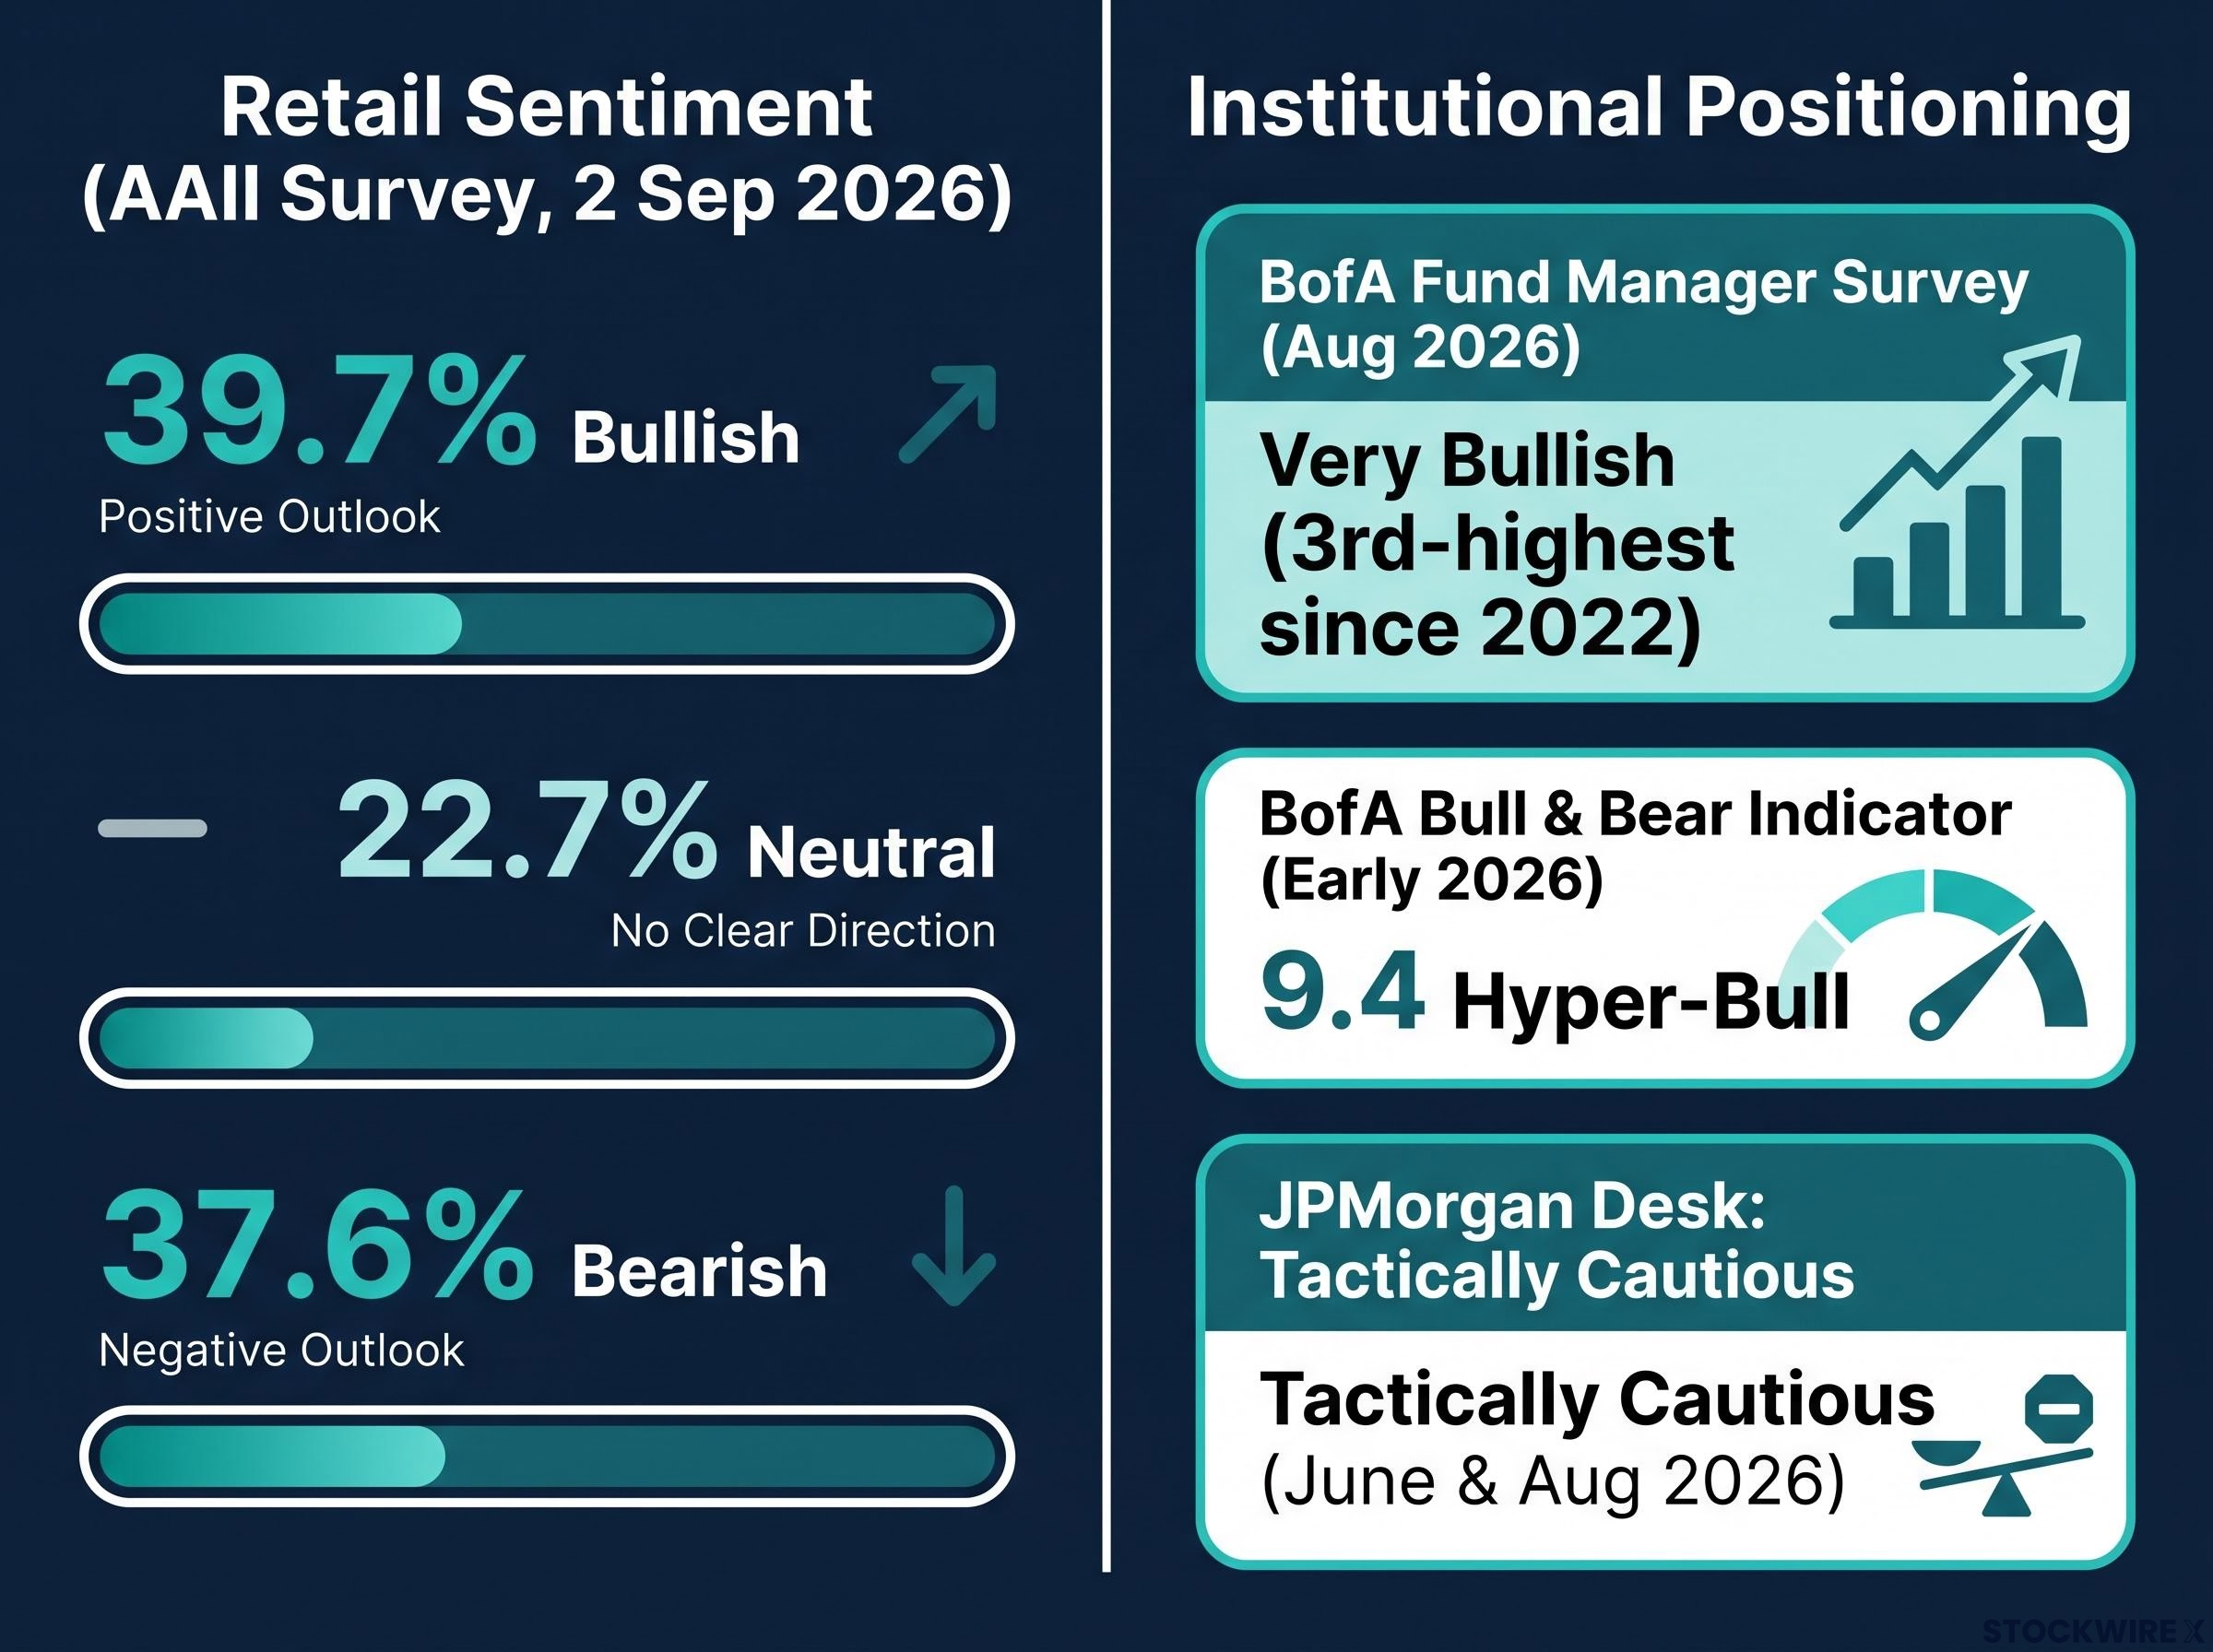
The American Association of Individual Investors (AAII) Sentiment Survey for the week ending 2 September 2026 showed 39.7% bullish, 22.7% neutral, and 37.6% bearish. Those are ordinary readings, not the kind of numbers that flash a capitulation signal.
Bearishness did briefly spike to 44.4% in late August before retreating, a flicker of anxiety rather than a sustained fear reading. A genuine retail panic looks different: bearishness holding above 50% for weeks, not a single elevated print that fades within days.
What this tells you is that retail investors have not thrown in the towel. The classic contrarian condition of exhausted sellers simply is not present on the retail side of the ledger.
Institutional positioning: the opposite problem
The professional money has the reverse issue. The Bank of America (BofA) Global Fund Manager Survey for August 2026 categorised institutional investors as “very bullish,” with the composite sentiment reading landing as the third-highest since 2022. Cash levels dropped sharply and global equity allocations climbed.
Earlier in 2026, BofA’s Bull and Bear Indicator hit a “hyper-bull” reading of 9.4, a level that has historically preceded corrections. High institutional exposure is a problem for the bullish case because it means the professionals cannot pile into a dip the way they could from a low-allocation starting point. Their buying power is already deployed.
| Indicator | Current reading | Historical benchmark | Signal implication |
|---|---|---|---|
| AAII retail bearishness (week ending 2 Sep 2026) | 37.6% | Capitulation typically above 50% | Near average, no panic extreme |
| BofA fund manager sentiment (Aug 2026) | Third-highest since 2022 | Elevated readings precede corrections | Over-exposed, limited dry powder |
Against this backdrop, JPMorgan’s trading desk shifted its near-term US equity view to “tactically cautious” in June 2026 and reinstated it in August 2026 ahead of the September FOMC decision. The firm has also been reported to flag flash-crash risk in crowded momentum trades, though that specific warning remains unverified and should be treated as directional colour rather than confirmed fact.
When big ASX news breaks, our subscribers know first
How the Fed’s rate path changes the equity math
The most misread variable in this market is not whether the Fed cuts, but why. As of early September 2026, the federal funds target range sits at 3.50%-3.75% following the 29 July 2026 FOMC decision, and the current stance is best described as higher-for-longer. That framing changes what a rate cut would actually mean for your equity exposure.
Here is the analytical distinction that separates a bullish outcome from a bearish one. The direction of a rate move tells you far less than the reason behind it, and the two scenarios produce opposite results.
- Normalisation cuts happen while the economy is still growing, inflation is cooling, and the Fed eases in measured 25-basis-point steps. These release liquidity into financial assets, lower the discount rate on future earnings, and support credit.
- Emergency cuts happen when unemployment is climbing and the Fed reacts with outsized moves of 50 basis points or more. These historically hurt equities and can trigger a “what do they know that we don’t” reaction among investors.
Historical data from TIAA, covering 1983 to 2025, anchors the bullish case for the first scenario.
When the Fed cut rates to normalise policy rather than to respond to a crisis, the S&P 500 delivered average cumulative returns of roughly 50% over the two years following the first cut, according to TIAA’s 1983-2025 sample.
That figure is the backbone of the optimistic Fed narrative. The problem is that the current cycle does not yet qualify for it.
Core Consumer Price Index (CPI) for July 2026 came in at 2.5% year-over-year, up 0.2% on the month. But the Fed’s preferred gauge, Core Personal Consumption Expenditures (PCE), remains elevated at 3.3% year-over-year, also up 0.2% monthly. The original analysis behind this thesis estimated underlying inflation nearer 2.4% once distorting components are stripped out, though that is a source-specific adjustment rather than an official release.
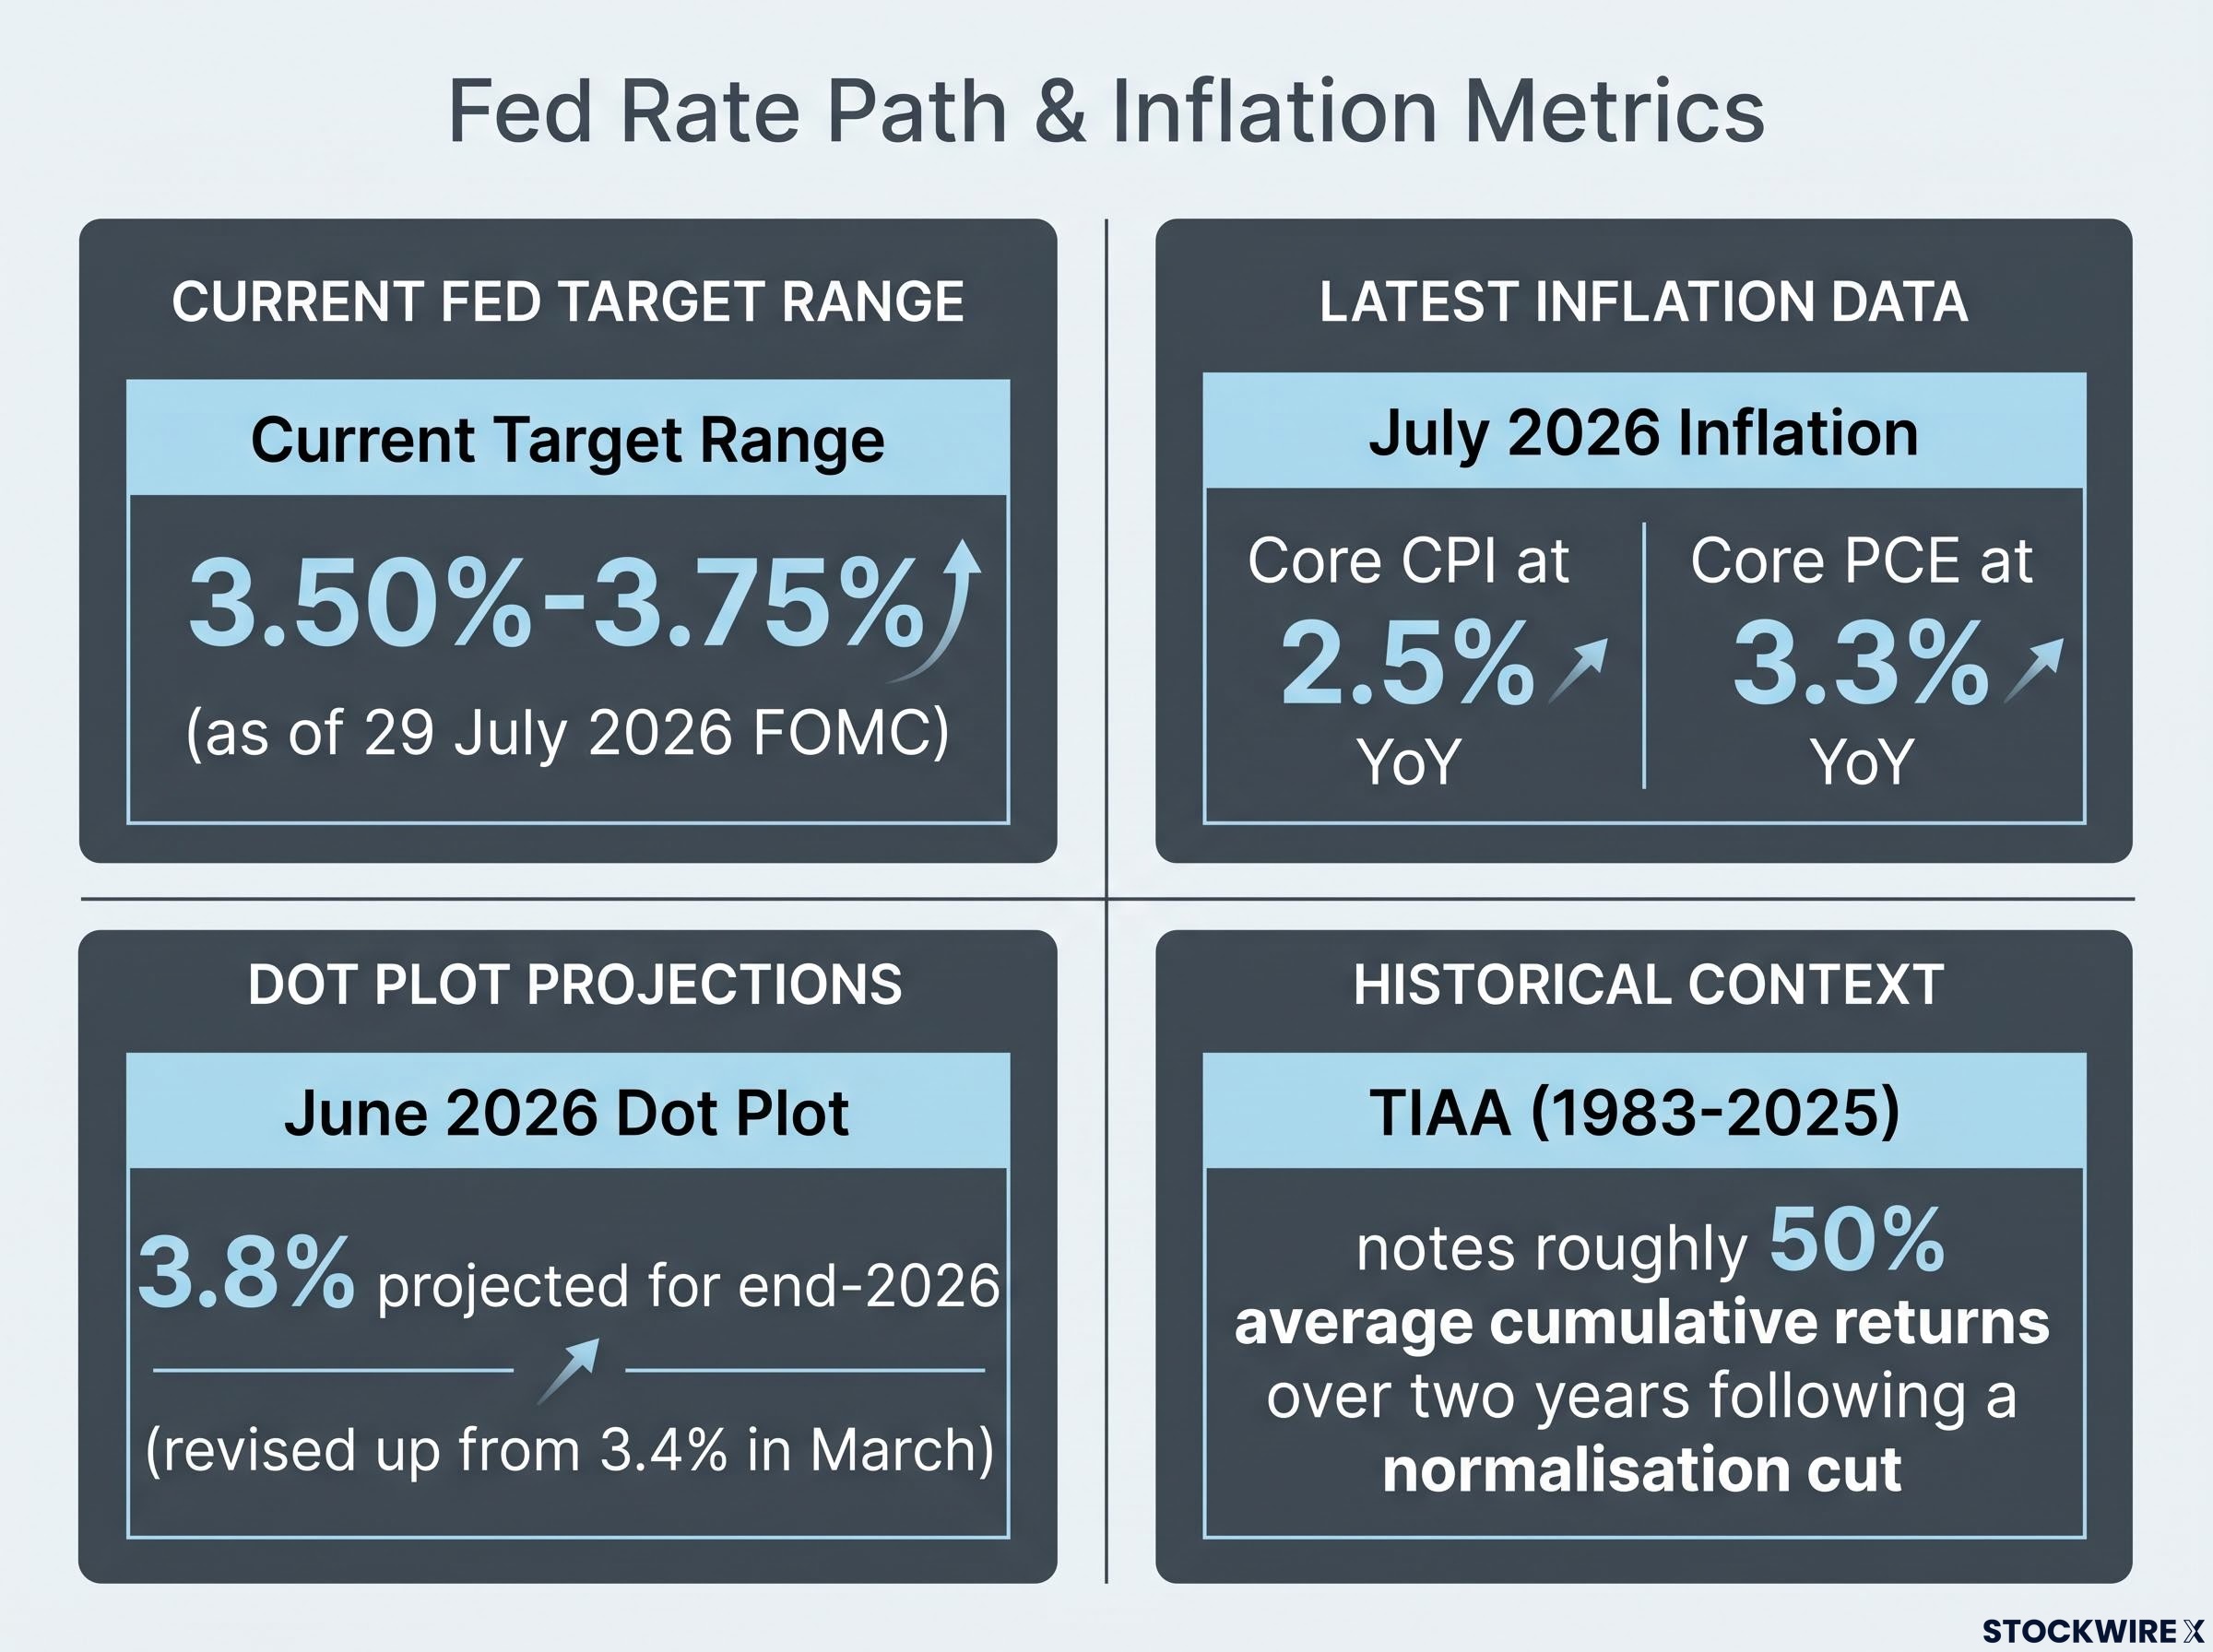
The June 2026 dot plot, the Fed’s own chart of where policymakers expect rates to sit, projected a median of 3.8% for end-2026, revised up from 3.4% in March. That upward revision matters to you directly.
With Core PCE at 3.3% and the dot plot moving higher, the Fed is not in normalisation-cut territory yet. That means you cannot claim the full historical tailwind those TIAA returns describe. The bullish Fed story is available to you only in part, and mistaking any cut for an automatic buy signal is the error this distinction exists to prevent.
Core PCE trajectory is the variable doing the most work in the Fed’s calculus: July data confirmed the underlying trend is drifting lower rather than breaking downward, a distinction the Fed’s own five-point convergence test treats as the critical difference between a patient hold and the start of an easing cycle.
September pullbacks, historical patterns, and the contrarian entry thesis
Start with the seasonal pattern, then add the filters one at a time, because the contrarian case only holds up when each layer is present. The September Effect gets the attention, but the more useful signal is what happens when September weakness arrives on top of a strong year.
Market analyst Tom Lee has quantified this. When the S&P 500 is up 5% or more year-to-date by mid-September, the market has historically rallied into year-end in roughly 87% of observed cases, generating an additional 6-8% in returns. That year-to-date strength filter is what separates a healthy pullback from the start of an extended decline.
There is a supporting seasonal note worth qualifying: in 8 of the last 9 US presidential election years, equities rallied from mid-September through year-end. The current 2026 cycle is a non-election year, so that specific overlay does not apply cleanly here and should not be leaned on.
For the contrarian entry thesis to hold, three conditions need to line up:
- Year-to-date gains above the historical threshold, meaning the market is up at least 5% by mid-September.
- Credit markets stable, with tight corporate spreads and no signs of systemic distress.
- Institutional cash levels elevated enough to provide a re-entry buyer base when sentiment turns.
A healthy pullback, the kind that resolves into a rally, tends to show rotational resilience, with cyclical, industrial, and defensive dividend sectors stepping in when large-cap tech softens. Credit spreads stay tight. There is no systemic distress in the plumbing of the market.
The mechanism behind the year-end rally pattern
The classic contrarian mechanism works like this: when caution is extreme, the marginal seller has already left, and negative catalysts are fully priced in. Neutral or mildly positive macro data then forces under-positioned institutions to buy quickly, because falling behind into year-end threatens their performance numbers. That scramble becomes self-reinforcing.
Historically, when bearish sentiment eclipsed 60%, it almost always preceded a major rebound. Current readings, with AAII bearishness at 37.6%, are nowhere near that threshold.
Here is the 2026 complication you need to hold onto. Because institutions are already heavily allocated to equities, the forced-buying engine is partially blunted. The re-entry buyers who normally power a September-to-year-end rally have, in large part, already entered. The historical base rate still applies, but you should discount it for the fact that the fuel tank is closer to full than empty.
The three risks that could break the bullish script
The risks here deserve the same weight as the bullish case, not a closing disclaimer. Treat them seriously and you should finish this section genuinely unsure which outcome is more likely, which is the honest position given the current data. Three distinct threat vectors sit against the rally thesis, and each transmits differently.
- Valuation and concentration: Gains are heavily concentrated in a narrow group of AI-linked mega-caps. Any rotation out of that leadership group threatens the index level even if the broader economy holds up.
- Geopolitics and policy: Middle East conflict and the risk of a disruption to the Strait of Hormuz, a key oil shipping route, could send energy prices higher and pressure earnings. Global tariff regimes and domestic policy uncertainty remain an ongoing drag on corporate profits.
- Household fragility: Higher long-term rates are already pressuring household balance sheets, and any material deterioration in employment would transmit quickly into consumption and then earnings.
On the geopolitical front, JPMorgan has been reported to warn of oil shock risk tied to the Strait of Hormuz. A specific figure attached to that warning, a reported cut in the firm’s year-end S&P 500 target, remains unverified, so the directional concern is what matters here, not the precise number.
The household risk is the one most underappreciated in the current consensus.
Household spending momentum deteriorated more sharply than the headline PCE figure suggested in July, with real personal consumption effectively flat as a 0.2% price increase absorbed the entire nominal spending gain, a pattern consistent with the budget-triage behaviour that analysts flag as a leading indicator of earnings pressure.
Analysts at Morgan Stanley have warned that household balance sheets are increasingly vulnerable to higher long-term rates, with any material deterioration in employment capable of rapidly pressuring both consumption and corporate earnings.
For an investor weighing whether to add equity exposure into a September dip, these three vectors mean the entry thesis is conditional, not certain. In this environment, position sizing and sector selection matter more than a binary decision to be all in or all out.
What a September dip actually changes, and what it does not
Pull the threads together and the picture is deliberately unresolved. The contrarian signal is only partially engaged, the Fed tailwind is available to you only in part, the historical seasonal pattern is real but discounted by heavy institutional positioning, and the three downside risks are genuine. This is a conditional setup, not a verdict.
That is why the disciplined move is to watch specific variables rather than commit to a directional call. Three will do most of the work through September:
- Fed communication at the September FOMC meeting. Language that opens the door to measured, growth-consistent easing points toward normalisation-cut conditions and a bullish read. Language emphasising higher-for-longer keeps the full historical tailwind out of reach.
- The Core PCE trajectory in the October release. With the gauge at 3.3%, a clear step down would strengthen the case that the Fed can credibly pivot. A stall would confirm the opposite.
- AAII bearishness during any September pullback. The current 37.6% reading is not a contrarian trigger. If a September decline pushes bearishness above 50%, the contrarian signal strengthens meaningfully and institutional cash may rebuild toward a re-entry level.
Hold Tom Lee’s 87% year-end rally frequency loosely, as a base rate to monitor against these conditions, not as a promise. September volatility, read this way, is less a crisis to endure than an information-gathering window that will clarify which version of Q4 arrives. The investor who watches these variables will be positioned to act decisively when the signal clears, rather than guessing early.
For investors translating this conditional setup into portfolio action, our comprehensive walkthrough of reactive trading costs during geopolitical events examines the behavioural research behind why repositioning around individual conflict headlines has historically cost retail investors more than maintaining a systematic approach through volatility.
This article is for informational purposes only and should not be considered financial advice. Investors should conduct their own research and consult with financial professionals before making investment decisions. Past performance does not guarantee future results, and financial projections are subject to market conditions and various risk factors. These statements are speculative and subject to change based on market developments.