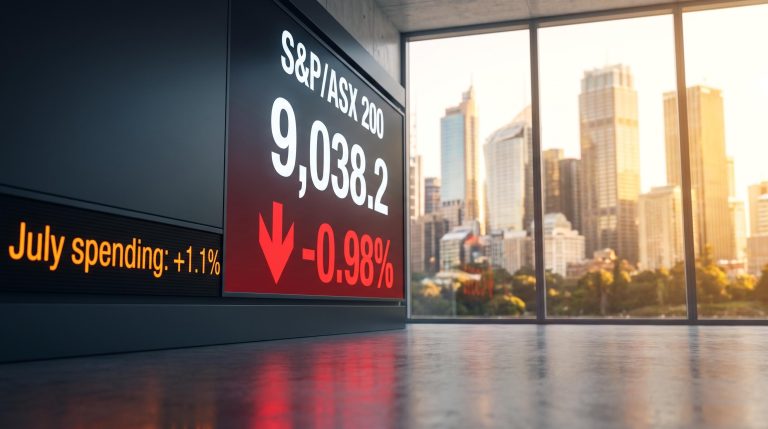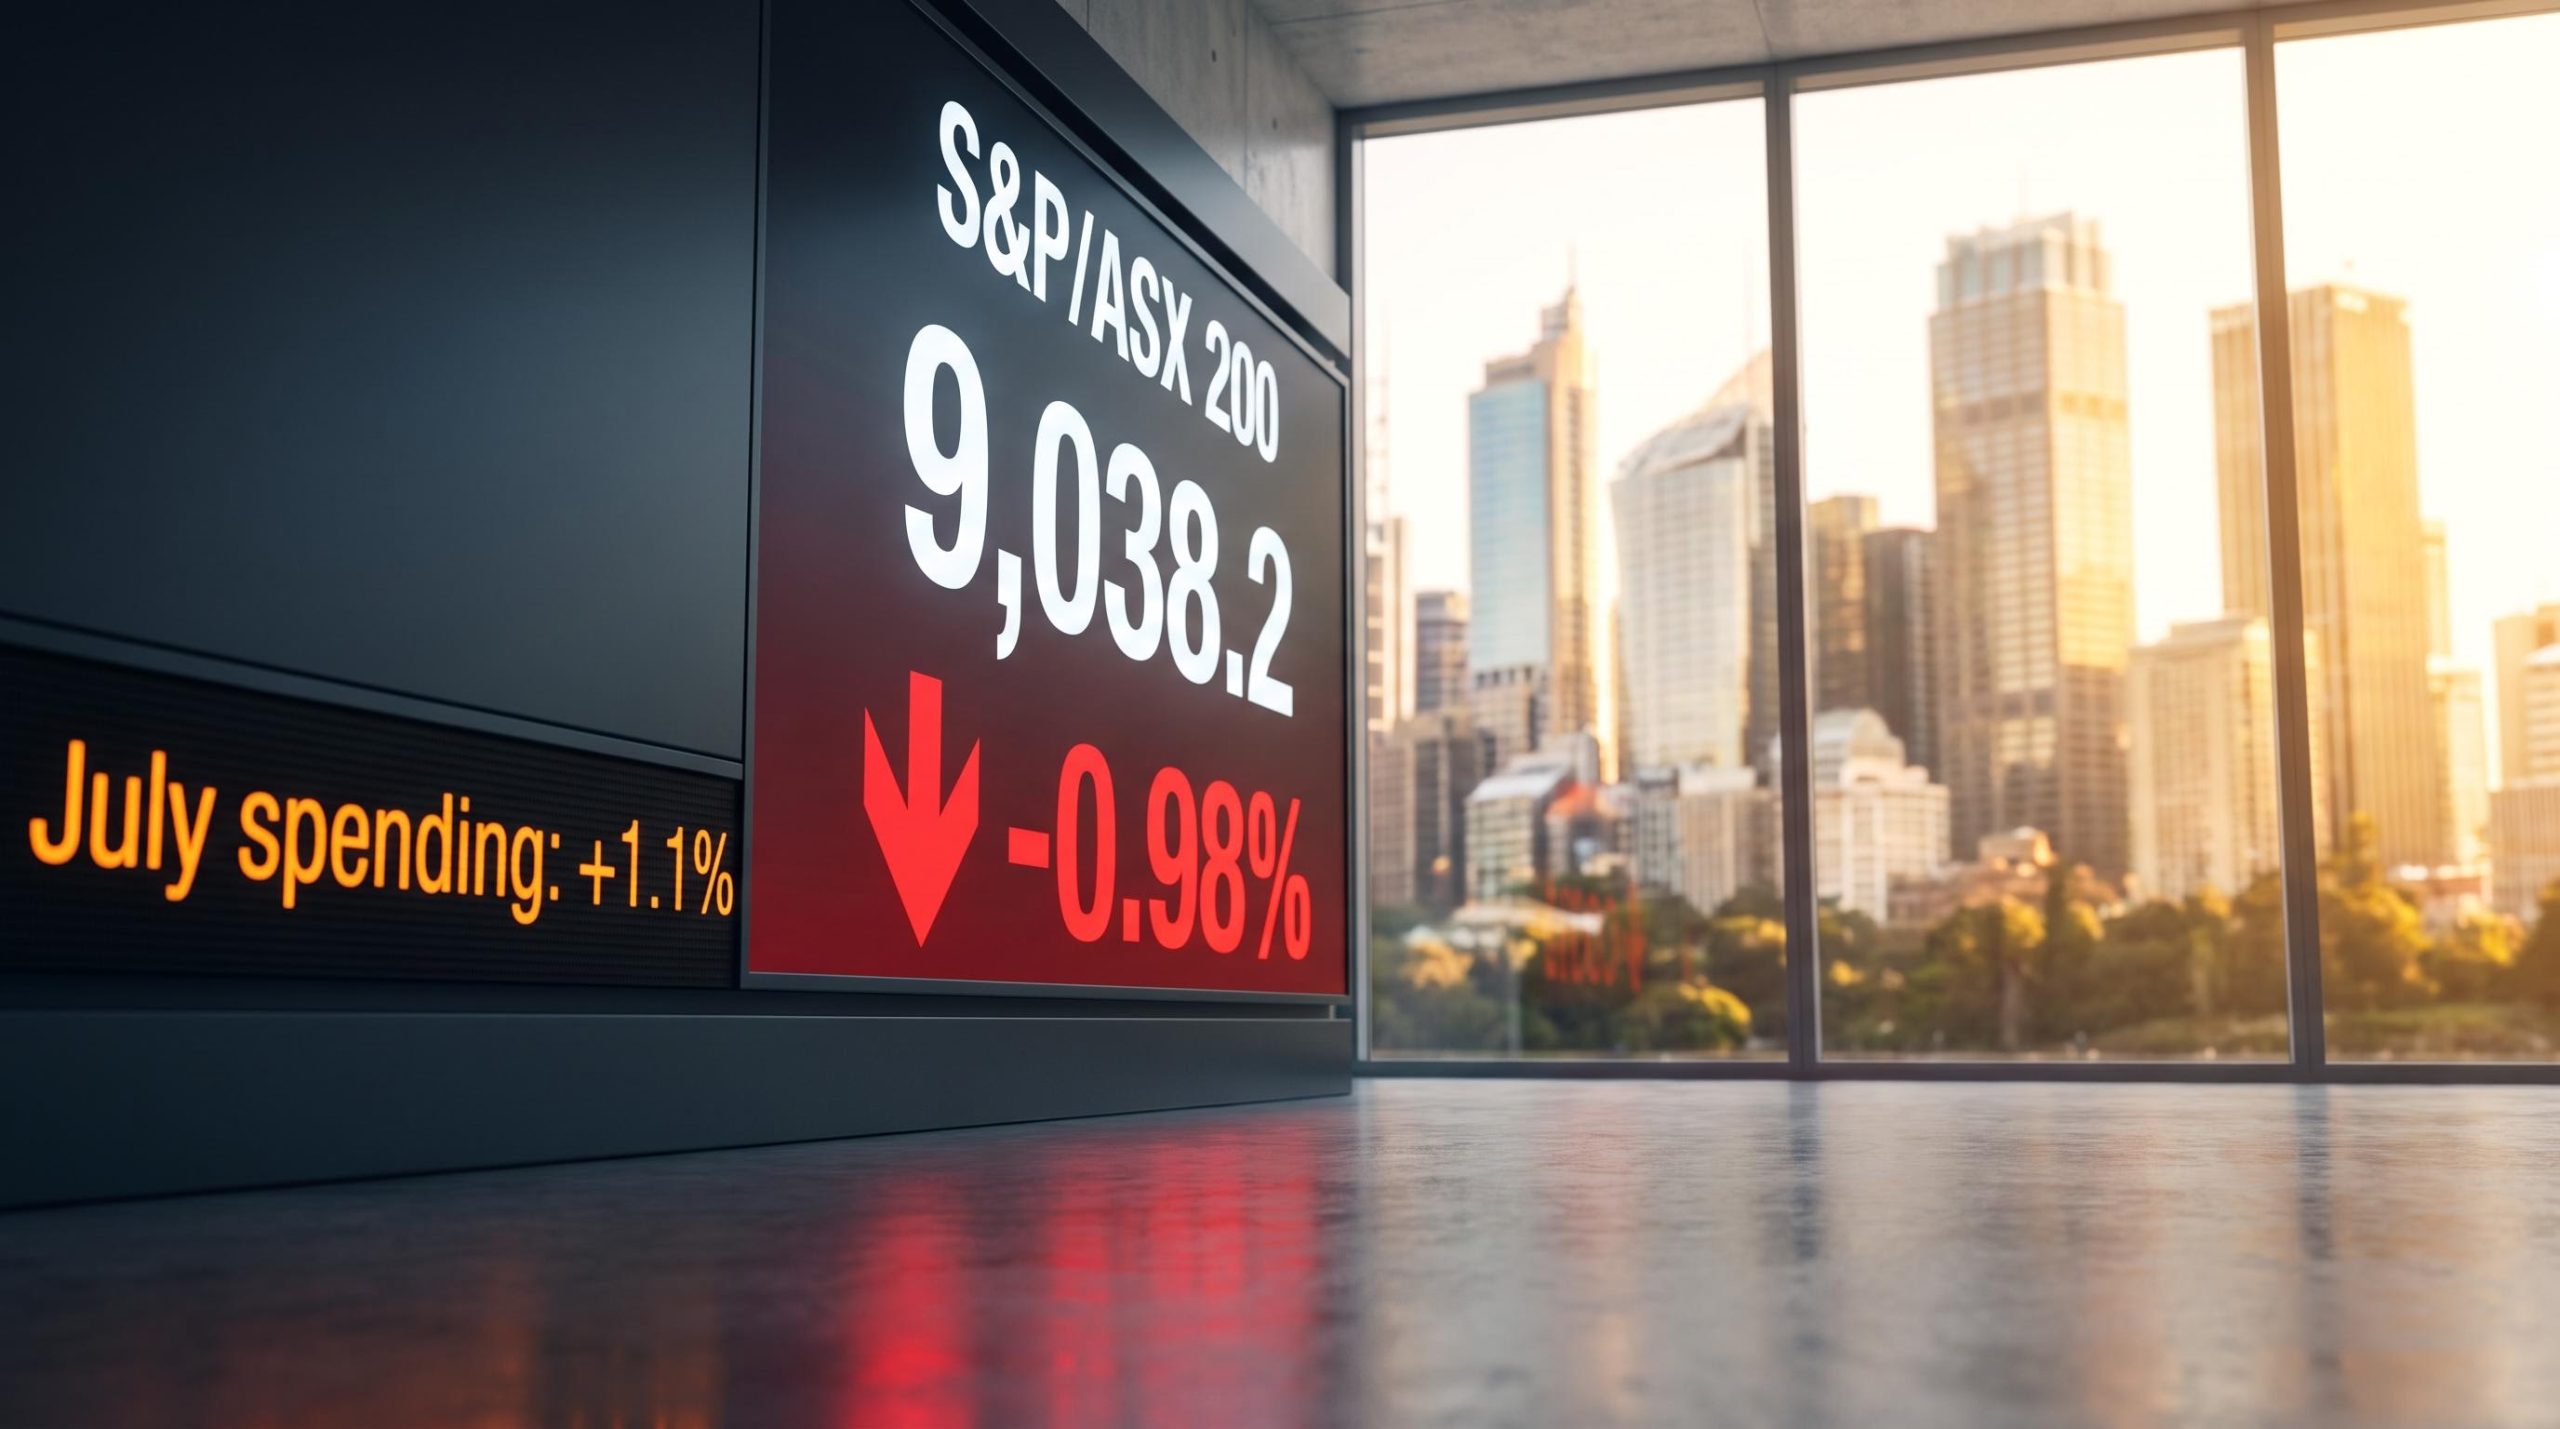
“Australian household spending surged 1.1% in July, more than double the ~0.4% consensus expectation, and it landed on a market still absorbing the previous day’s hotter-than-expected 3.5% inflation print. The S&P/ASX 200 closed out the 27 August 2026 session 89.6 points weaker, a decline of 0.98% to 9,038.2, while market-implied odds of a September RBA rate hike jumped from roughly one-in-six to something approaching a coin-toss.\n\nThis was not a global risk event. US equity futures were positive across the board at the time of the ASX close. The selling was domestically manufactured, driven entirely by Australian macro data, and it landed squarely on the sectors most exposed to rising borrowing costs. For anyone holding rate-sensitive equities or watching their mortgage repayments, the session changed the baseline assumption about where the cash rate is heading.\n\nHere is what the numbers tell you about where the pressure landed and where it did not: which sectors bore the worst of the repricing, why Health Care was the only sector in the green, and what the futures market is now saying about the RBA’s next move.\n\n## A spending print that changed the rate calculus in a single session\n\nJuly’s ABS Monthly Household Spending Indicator recorded a 1.1% rise month-on-month and 7.0% growth year-on-year on a seasonally adjusted basis. Market forecasters had centred their expectations around +0.4%, with some anticipating a flat or slightly negative outcome. The reported figure arrived at well over twice the expected level.\n\n> July household spending: +1.1% MoM versus consensus ~+0.4%.\n\nWhat made the number particularly uncomfortable was the timing. It arrived the day after the ABS published a 3.5% year-on-year July CPI print on 26 August 2026, which had already surprised to the upside. Rather than being absorbed as separate events, the two data points fused into one reinforcing macro message: inflation is running hotter than anticipated, and household consumption is accelerating despite the rate hikes already in place.\n\nThe July 3.5% print landed against a backdrop that was already tightening: the June 2026 CPI reading came in at 3.8% annually, and the trimmed mean at 3.6% had beaten market consensus, briefly reducing pressure on the Board ahead of its August meeting.\n\nThe ABS data covers spending across all nine tracked categories, and gains were broad-based. Categories recording increases included:\n\n- Recreation and culture\n- Food\n- Health\n- Hotels, cafes, and restaurants\n- Clothing and footwear\n\nThat breadth matters. A single category distorting the headline would have been easier to dismiss. Broad-based strength across all nine categories is a genuine economy-wide signal that demand has not yet responded to existing rate hikes, and that is the reading that moved rate expectations within hours.\n\nJune household spending had already risen 1.0% month-on-month on the same seasonally adjusted series. This was not a one-month bounce. It was a pattern.\n\nThe ABS Monthly Household Spending Indicator confirmed the 1.1% month-on-month rise across broad spending categories, making July the third consecutive month of solid gains on the seasonally adjusted series and removing any possibility of dismissing the print as a statistical outlier.\n\n## What the rate futures market is now pricing for September and November\n\nThe spending print repriced the RBA’s near-term path in real time during the session. Before the data landed, short-term interest rate futures implied a roughly 17% probability of a rate hike at the 28-29 September Board meeting. By session close, that number had shifted to approximately 50%, with the range across different rate-watch trackers sitting between 34% and 50%.\n\n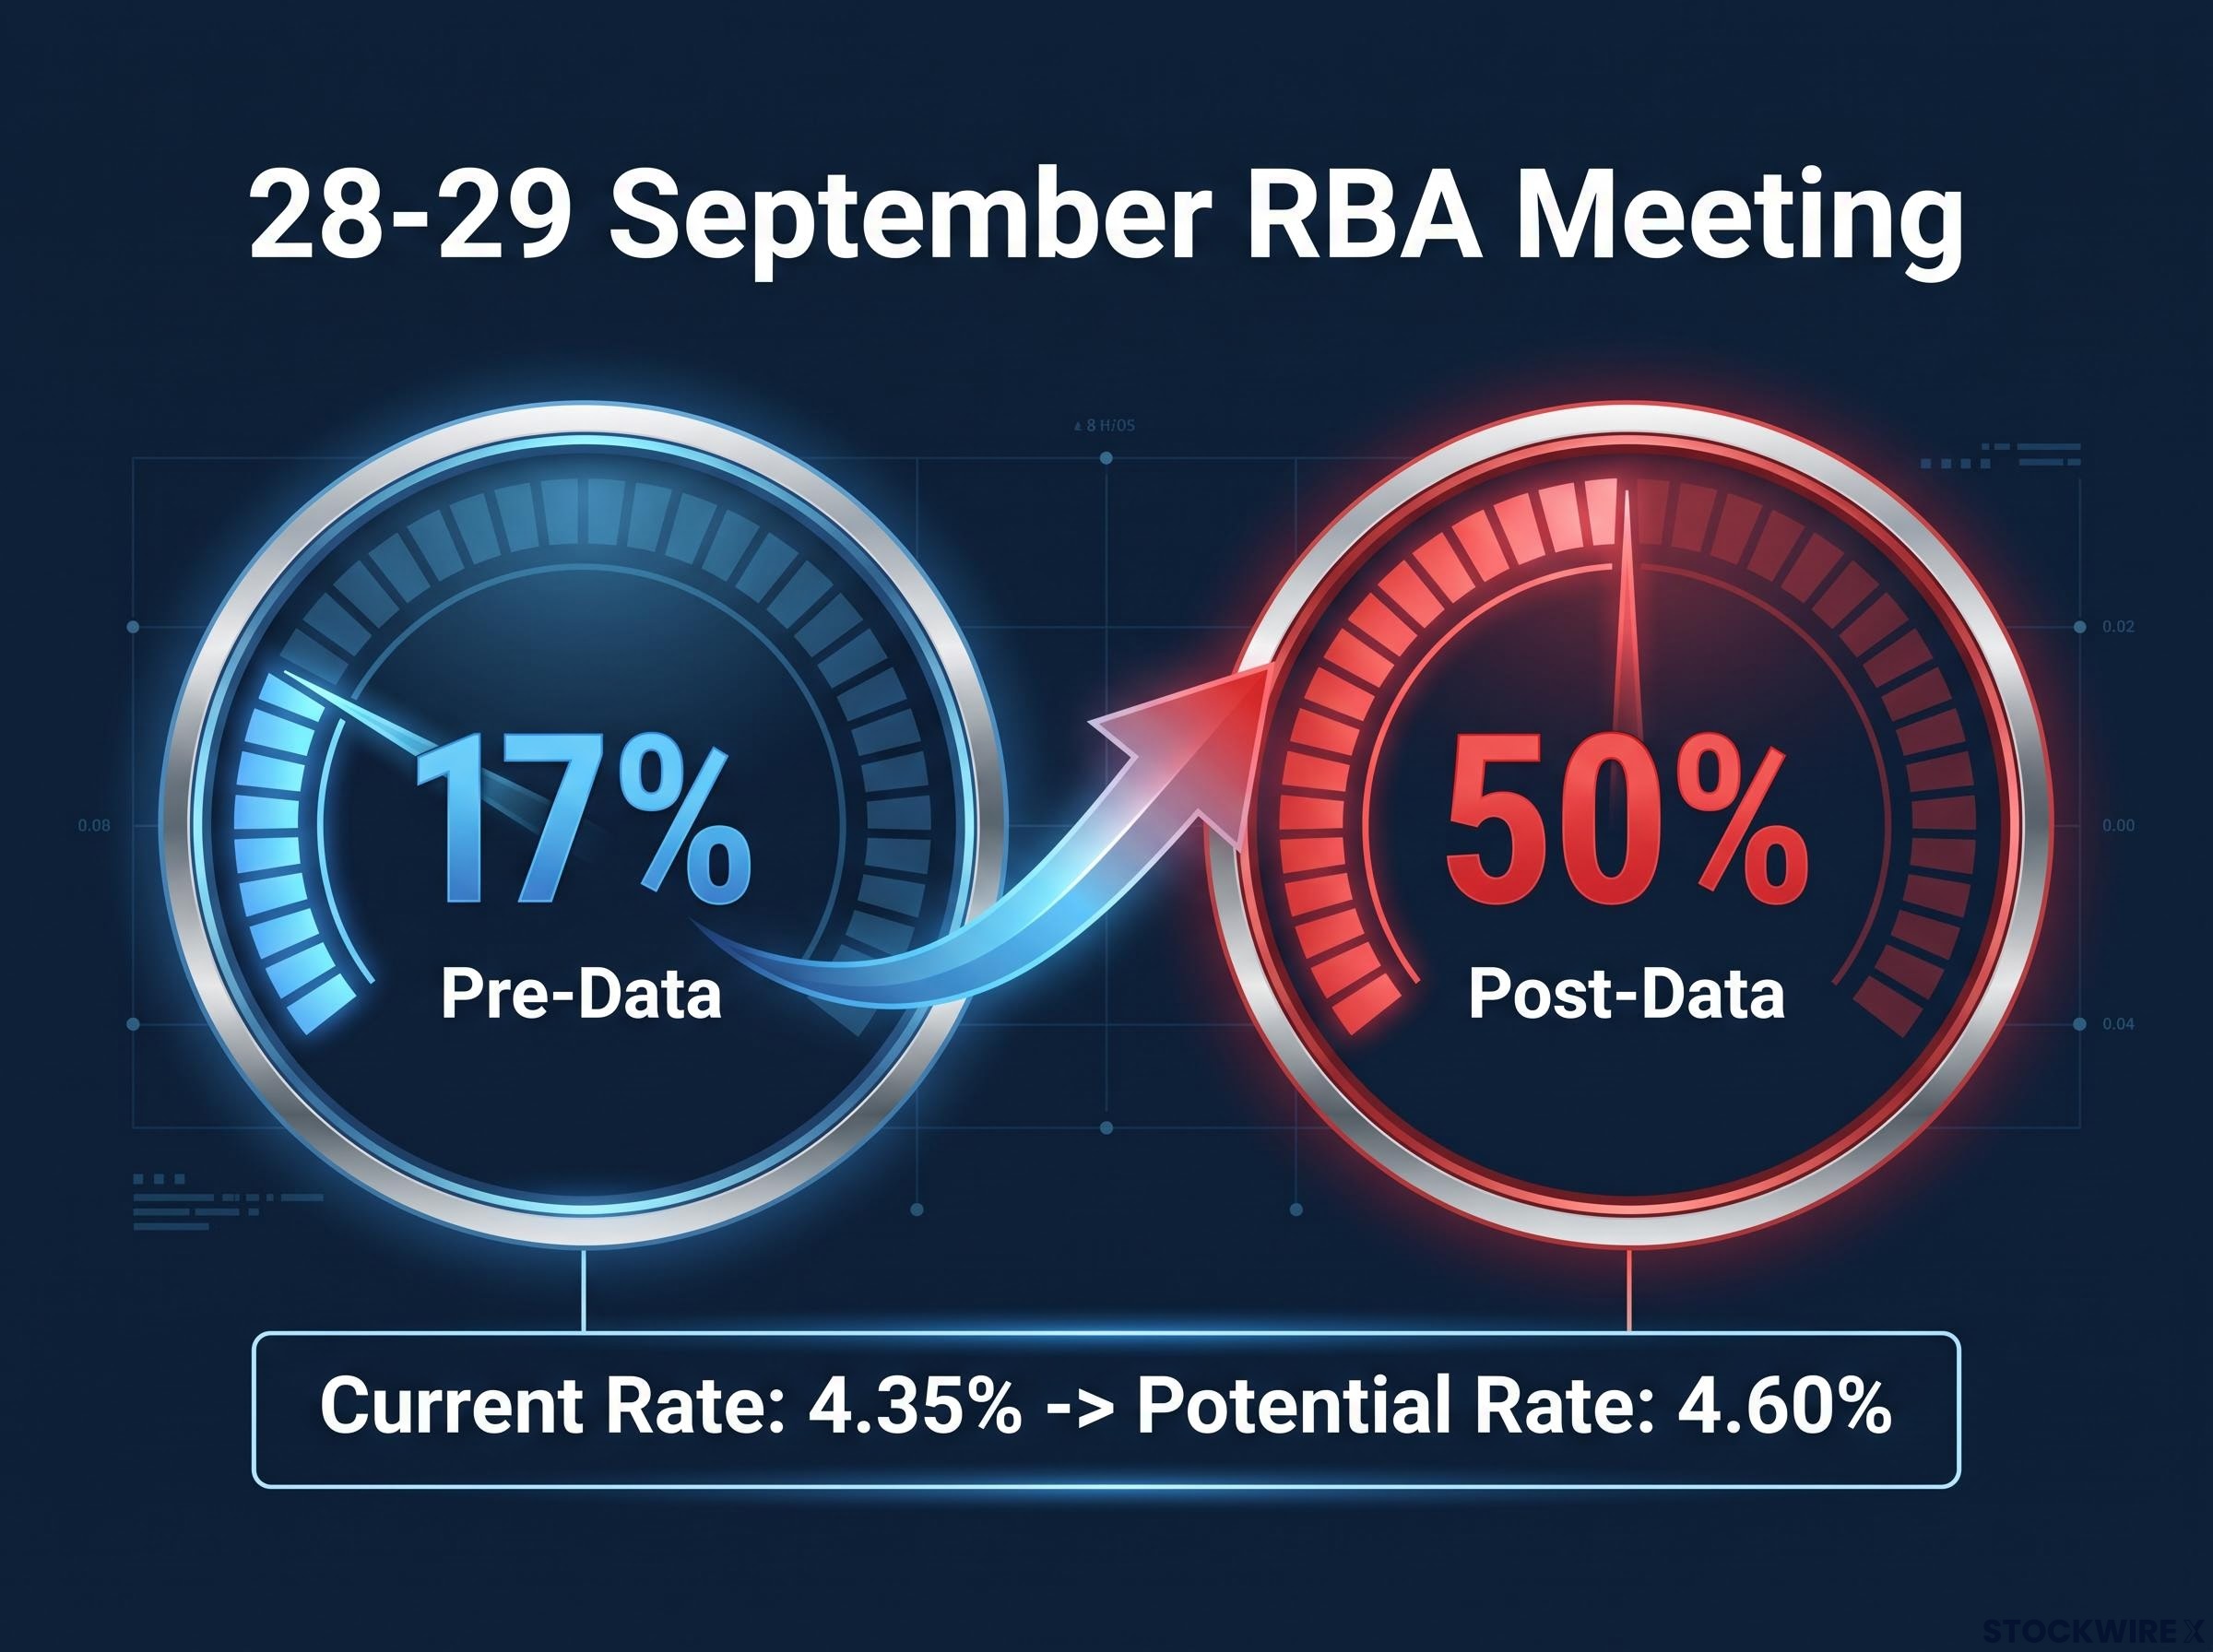 \n\n
\n\n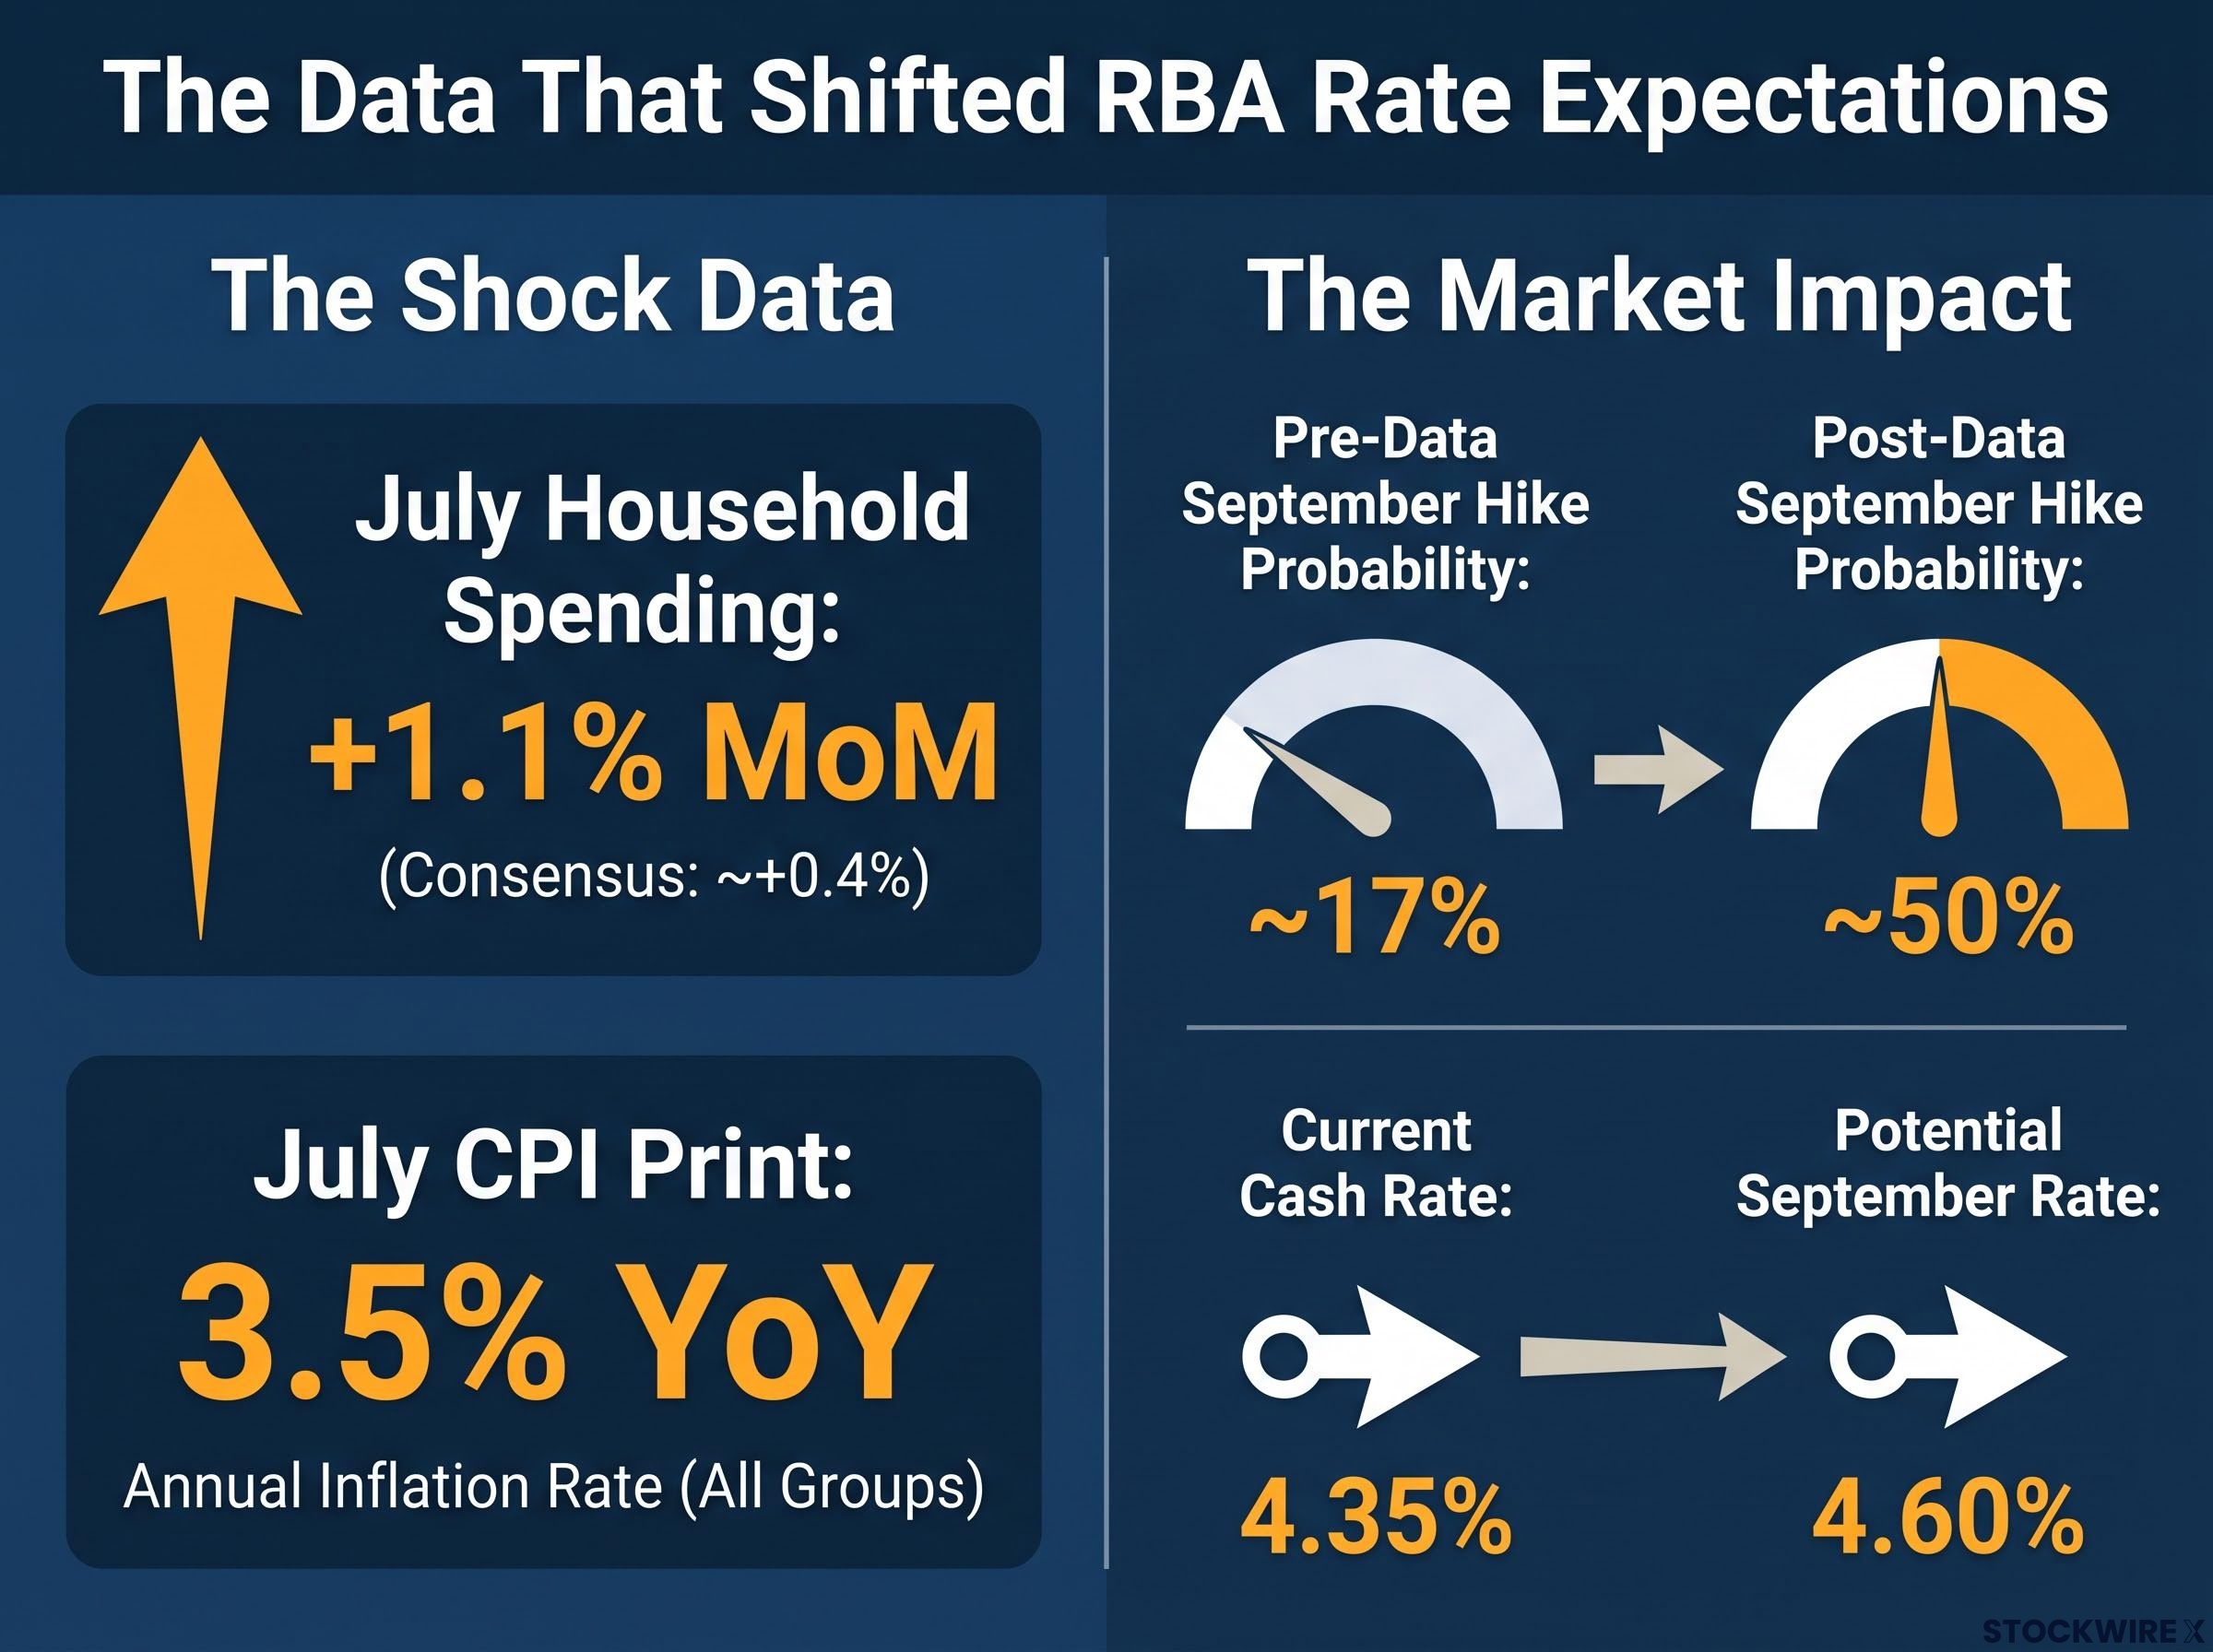 \n\n
\n\n
| Scenario | Implied Probability (Pre-Data) | Implied Probability (Post-Data) |
|---|---|---|
| September hike (to 4.60%) | ~17% | ~50% (range: 34-50%) |
| November hike (if September skipped) | Partially priced | Largely priced in |
| No change through November | Most likely scenario | Minority scenario |
\n
\n\nThe current RBA cash rate sits at 4.35%. A September move would take it to 4.60%. If the Board holds in September, a November hike at the 2-3 November meeting is now largely priced in.\n\nThe current 4.35% cash rate was itself the product of a third consecutive hike delivered on 5 May 2026, with eight of nine Board members voting to tighten and all four inflation measures still sitting above the 2-3% target band at that point.\n\n> The Australian dollar gained 0.16% to close at 0.7183 against the US dollar. When a currency strengthens on a session that equities finish lower, it signals that the market is repositioning for tighter monetary policy rather than chasing broader risk.\n\nA shift from 17% to roughly 50% implied probability in a single session is not noise. It is the market telling investors that the risk profile of holding rate-sensitive assets has changed, and positions built on the assumption of a prolonged hold at 4.35% are now under pressure.\n\n## How the selling was distributed across sectors, and why Health Care stood apart\n\nThe sector breakdown tells the story of a market repricing around a single variable: interest rates.\n\n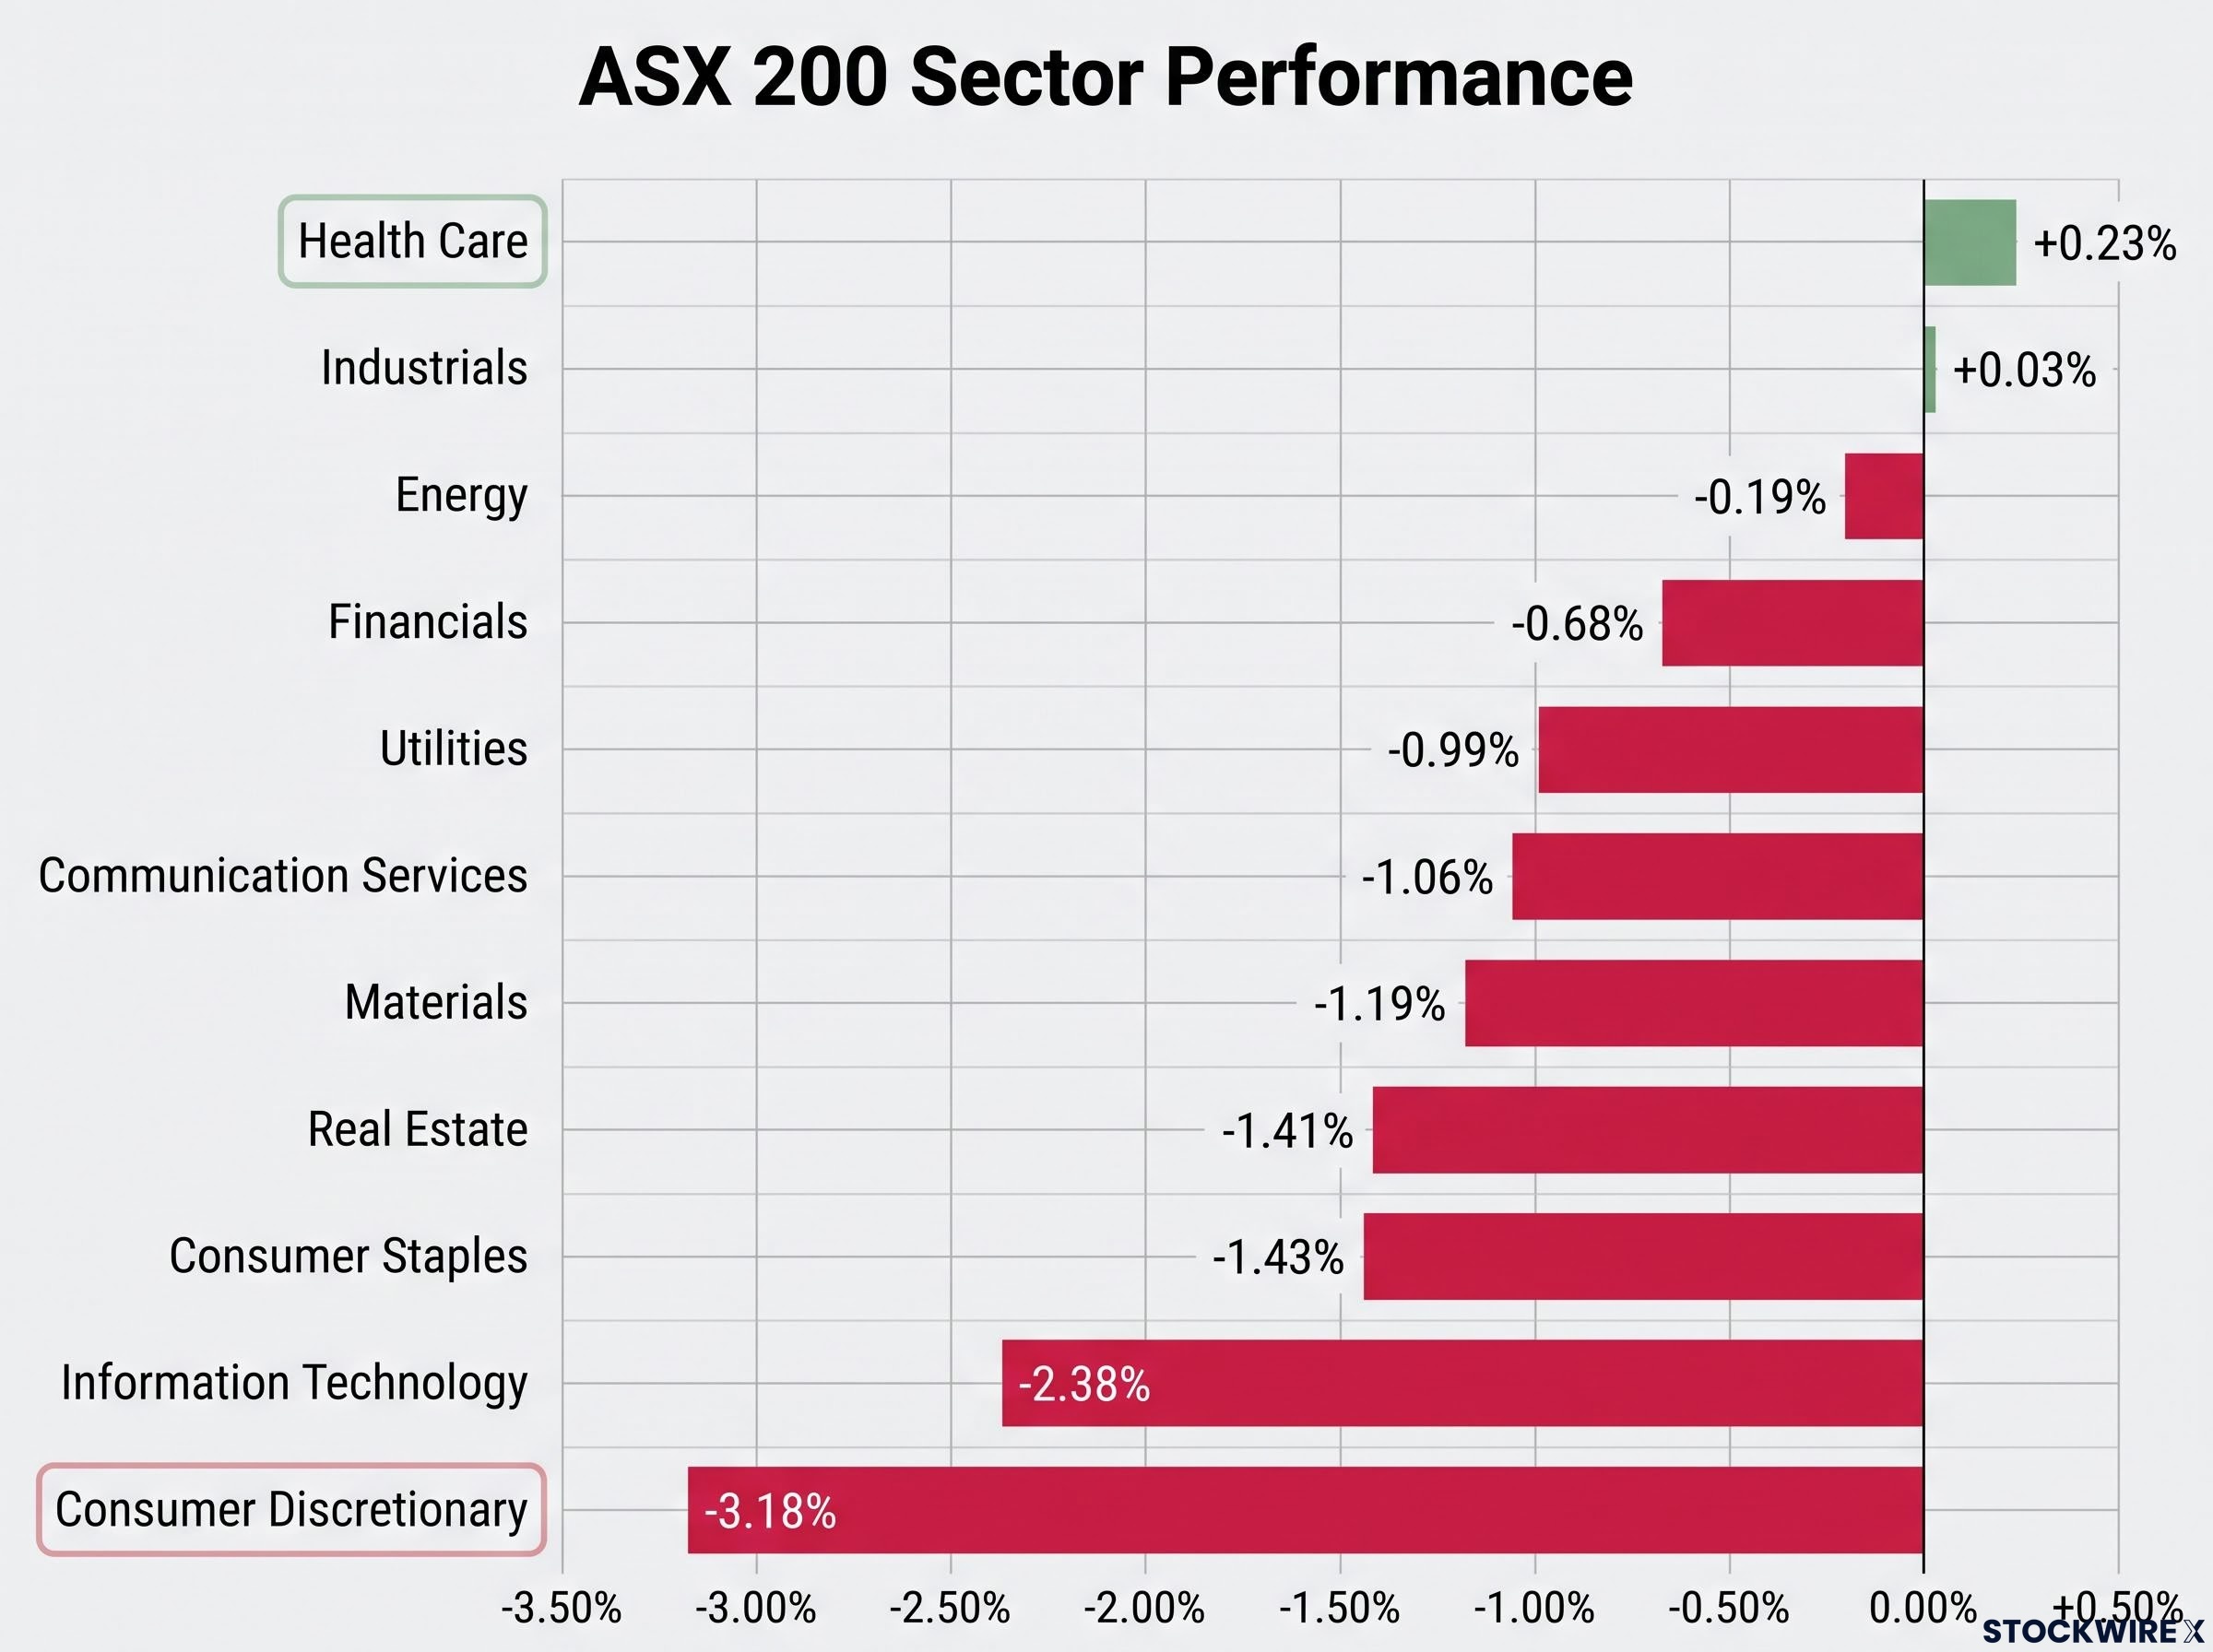 \n\n
\n\n
| Sector | Change (%) | Index Level |
|---|---|---|
| Health Care | +0.23% | 31,792.4 |
| Industrials | +0.03% | 8,154.4 |
| Energy | -0.19% | 10,884.7 |
| Financials | -0.68% | 9,116.0 |
| Utilities | -0.99% | 10,260.8 |
| Communication Services | -1.06% | 1,577.7 |
| Materials | -1.19% | 26,257.4 |
| Real Estate | -1.41% | 3,403.3 |
| Consumer Staples | -1.43% | 13,236.1 |
| Information Technology | -2.38% | 1,864.9 |
| Consumer Discretionary | -3.18% | 3,699.9 |
\n
\n\nThe All Tech Index finished the session down 2.14% at 3,061.4, with continued post-results weakness in WiseTech Global among the contributors weighing on the sector. The Small Ordinaries closed 1.59% lower at 3,524.2.\n\n> Breadth told the real story: the S&P/ASX 300 recorded roughly 63 advancing stocks against 222 declining ones. Money was not rotating from one sector into another. It was leaving equities.\n\n### The two outliers that explain the day’s logic\n\nHealth Care was the session’s sole sector to finish in positive territory, a reflection of the earnings profile that sets it apart in a rising-rate environment. Its revenue base, anchored in government-funded healthcare programmes and non-discretionary patient activity, is not sensitive to swings in consumer sentiment or mortgage affordability. With rate concerns dominating the session’s mood, that resilience drew investors looking for shelter from the repricing.\n\nConsumer Discretionary sustained the heaviest losses at -3.18% because it sits at the intersection of both sides of the rate-hike pain. Higher rates increase household debt servicing costs, directly reducing the disposable income available for discretionary purchases. At the same time, they compress the valuation multiple investors are willing to apply to future earnings in the sector. Double exposure, double damage.\n\nSector rotation under a tightening bias has been the defining investment challenge across 2026, with consumer discretionary and A-REITs identified as carrying persistent structural headwinds from household balance-sheet stress well before today’s spending data reinforced that picture.\n\n## A locally driven selloff in a session where the rest of the world held its nerve\n\nThe most telling feature of the session was what did not fall. US index futures were firmly in positive territory at the time of the ASX close:\n\n- S&P 500 futures: up 0.33% to 7,715.0\n- Dow Jones futures: up 0.23% to 53,644.0\n- Nasdaq futures: up 0.65% to 29,480.0\n\nThe absence of any offshore weakness removes the usual explanation for a domestic decline. No global risk-off move was underway, and no overnight shock needed absorbing. The ASX fell because data specific to Australia signalled that domestic monetary policy is on a tightening path, and that was not a concern shared by markets elsewhere.\n\n> The AUD/USD rose 0.16% to settle at 0.7183. A currency climbing on a day the equity market falls points squarely to rate expectations doing the work, not risk appetite. That is the defining macro dynamic of this session.\n\nCommodities provided little offset. Across key markets, the moves were:\n\n- Brent crude: down 1.6% to US$85.54/bbl\n- COMEX copper: off a further 0.5% in Asian trade to US$6.564/lb, following a 1.7% overnight drop\n- COMEX gold: settling near US$4,650/oz, down 0.1% in Asian trade after falling 0.9% overnight\n- GFEX lithium carbonate: eased 0.1% to CNY 152,020/t\n\nGold’s modest overnight fall was still enough to pull the ASX Gold Sub-Index down 1.5%, while lithium stocks extended their losses even though Chinese futures for the metal barely moved. Within Energy, coal names managed to hold up as oil-linked producers came under modest pressure from falling crude, but these pockets of resilience were the exception rather than the pattern: the domestic rate repricing set the agenda for the session from open to close.\n\n## What Australian investors are watching before the September RBA decision\n\nThe 28-29 September Board meeting is now a binary risk event for Australian equity portfolios. Either the RBA lifts the cash rate from 4.35% to 4.60%, and rate-sensitive sectors face renewed selling pressure, or it holds, and the relief rally will be as acute as today’s selloff was severe.\n\nFutures pricing has settled at roughly 50% for a September move, spanning a range of 34% to 50% depending on the tracker. Should the Board choose to wait, the 2-3 November meeting has moved firmly into line as the expected point of action, with markets treating a hike at that meeting as highly probable.\n\nThe variables that could shift the probability between now and the decision:\n\n1. Labour market data: A softer employment print would give the RBA room to hold. A strong one removes that option.\n2. Wage figures: Any acceleration in wages growth reinforces the demand-side pressure the spending data already flagged.\n3. Retail sales: The next monthly release will either confirm or contradict the spending strength, and the RBA will be watching as closely as the market.\n4. Global macro shock: An external disruption that slows global growth could give the Board cover to pause, but absent that, the domestic data is doing the talking.\n\nThe RBA has repeatedly expressed concern about demand running ahead of the economy’s productive capacity. July’s spending figures, showing that household consumption held up strongly in spite of the rate increases already delivered, add fresh weight to that concern and narrow the Board’s room to remain patient.\n\nBecause this selloff was domestically caused, its resolution will also be domestic. Offshore market strength provides no shelter until the rate question is settled. For Australian equity investors, the September Board meeting is now the date that matters most.\n\nFor investors wanting to understand the historical precedents in both directions, our dedicated guide to ASX sector positioning through the rate cycle examines which sectors move first and fastest when the RBA shifts stance, including how REITs and growth stocks have behaved across prior tightening and easing periods.\n\n> This article is for informational purposes only and should not be considered financial advice. Investors should conduct their own research and consult with financial professionals before making investment decisions. Forward-looking statements regarding RBA policy decisions are speculative and subject to change based on incoming economic data and Board deliberations.“
Recession risk signals embedded in consumer sentiment and housing data had already been building before the July spending print arrived, with national dwelling prices falling 0.4% in June 2026 and the Westpac consumer sentiment index sitting at 80.6 against a neutral reading of 100.
Defensive sector outperformance during rate-driven selloffs follows a consistent logic on the ASX: utilities, healthcare, and consumer staples attract capital precisely because their earnings are insulated from changes in borrowing costs and consumer discretionary spending, a pattern that has repeated across multiple tightening episodes in 2026.
RBA policy divergence from other major central banks has been a defining feature of the 2026 tightening cycle, with Australia lifting its cash rate while the Fed, ECB, and Bank of England held steady, a gap that now shapes how global capital positions around Australian rate-sensitive assets.
The ABS Monthly Household Spending Indicator recorded the 1.1% July rise on a seasonally adjusted basis, covering all nine tracked spending categories and providing the granular category-level breakdown that confirmed the gain was broad-based rather than driven by a single outlier.