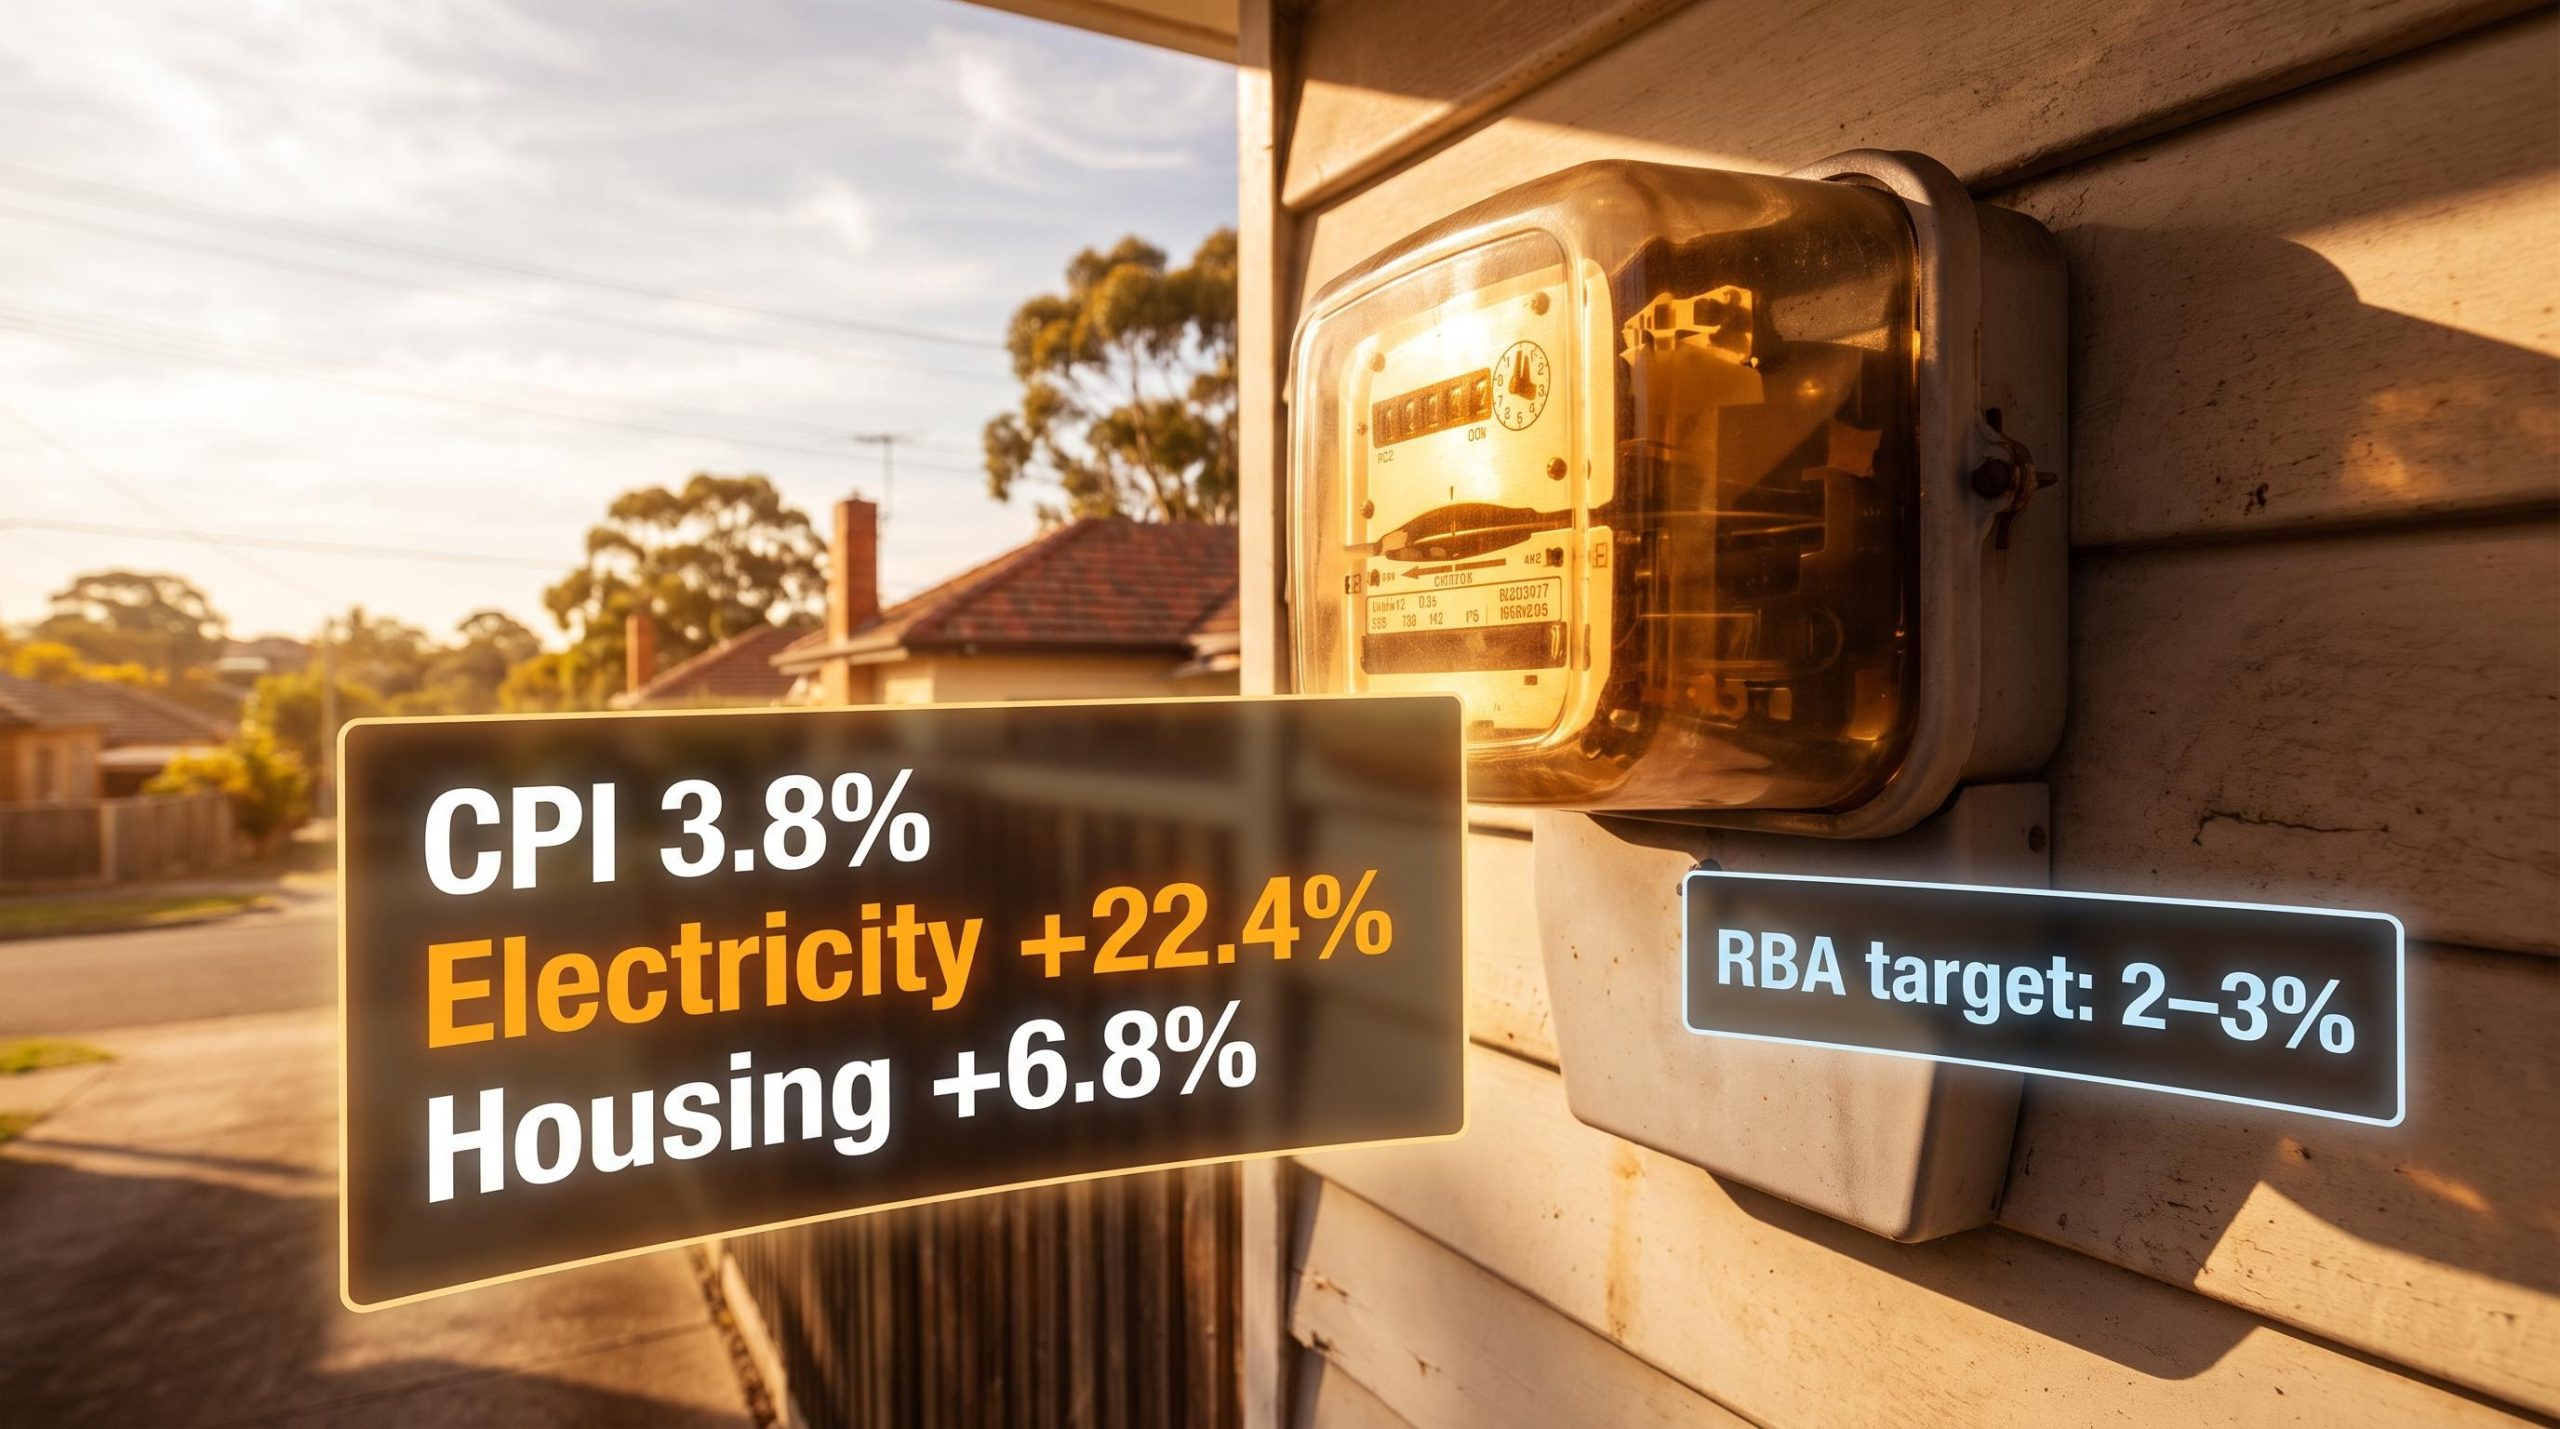
Australia’s headline CPI reading came in at 3.8% for the twelve months ending June 2026, with power bills jumping 22.4% once government relief schemes wound down, in figures published today by the Australian Bureau of Statistics (ABS). The monthly CPI indicator, published at 11:30am AEST on 29 July 2026, confirms that housing remains the single largest structural force keeping prices elevated.
The reading marks a pullback from the March 2026 peak of 4.6% but sits well above the Reserve Bank of Australia’s (RBA) 2-3% target band. The next RBA decision is scheduled for 11 August 2026, and the central bank now faces a familiar tension: headline inflation is moderating, but the categories driving it are slow to reverse.
Here is what the breakdown reveals about which cost pressures are easing, which are embedded, and what the split between them signals for anyone watching the RBA’s next move.
What today’s 3.8% figure actually tells us
Two official ABS series sit side by side this morning, and they tell a consistent but slightly different story. The monthly CPI indicator registered 3.8% annually to June 2026. The quarterly CPI measure came in at 4.0% year-on-year for the June quarter, with a 0.6% quarter-on-quarter movement.
The monthly figure was pulled lower by a -0.1% month-on-month decline in June, according to ABS Head of Price Statistics Rachael McCririck. That monthly dip brought the annual rate down from its 4.6% peak in March 2026, a reading that now appears to have been the cycle high.
The gap between the two measures is not a contradiction. It tells you the deceleration is recent and tentative. Neither number is a clean all-clear signal. Both remain materially above the RBA’s 2-3% target band, and both confirm the same trajectory: inflation peaked earlier and slightly lower than the RBA’s May 2026 forecast of 4.8%, but the descent is only just beginning.
| Measure | Period | Value | Movement |
|---|---|---|---|
| Annual CPI (monthly indicator) | 12 months to June 2026 | 3.8% | Down from 4.6% peak (March 2026) |
| Annual CPI (quarterly) | June quarter 2026 | 4.0% | Down from ~4.1% prior quarter |
| Quarterly movement | June quarter 2026 | +0.6% q/q | Down from +1.4% (March quarter) |
| Monthly movement | June 2026 | -0.1% m/m | Monthly decline |
| Trimmed mean (annual) | 12 months to June 2026 | 3.6% | Unchanged from May 2026 |
When big ASX news breaks, our subscribers know first
Why electricity and housing are doing the heavy lifting
Housing was the single biggest driver of annual inflation, rising 6.8% across the twelve months to June 2026. That number is driven almost entirely by two sub-components, and the distinction between them matters.
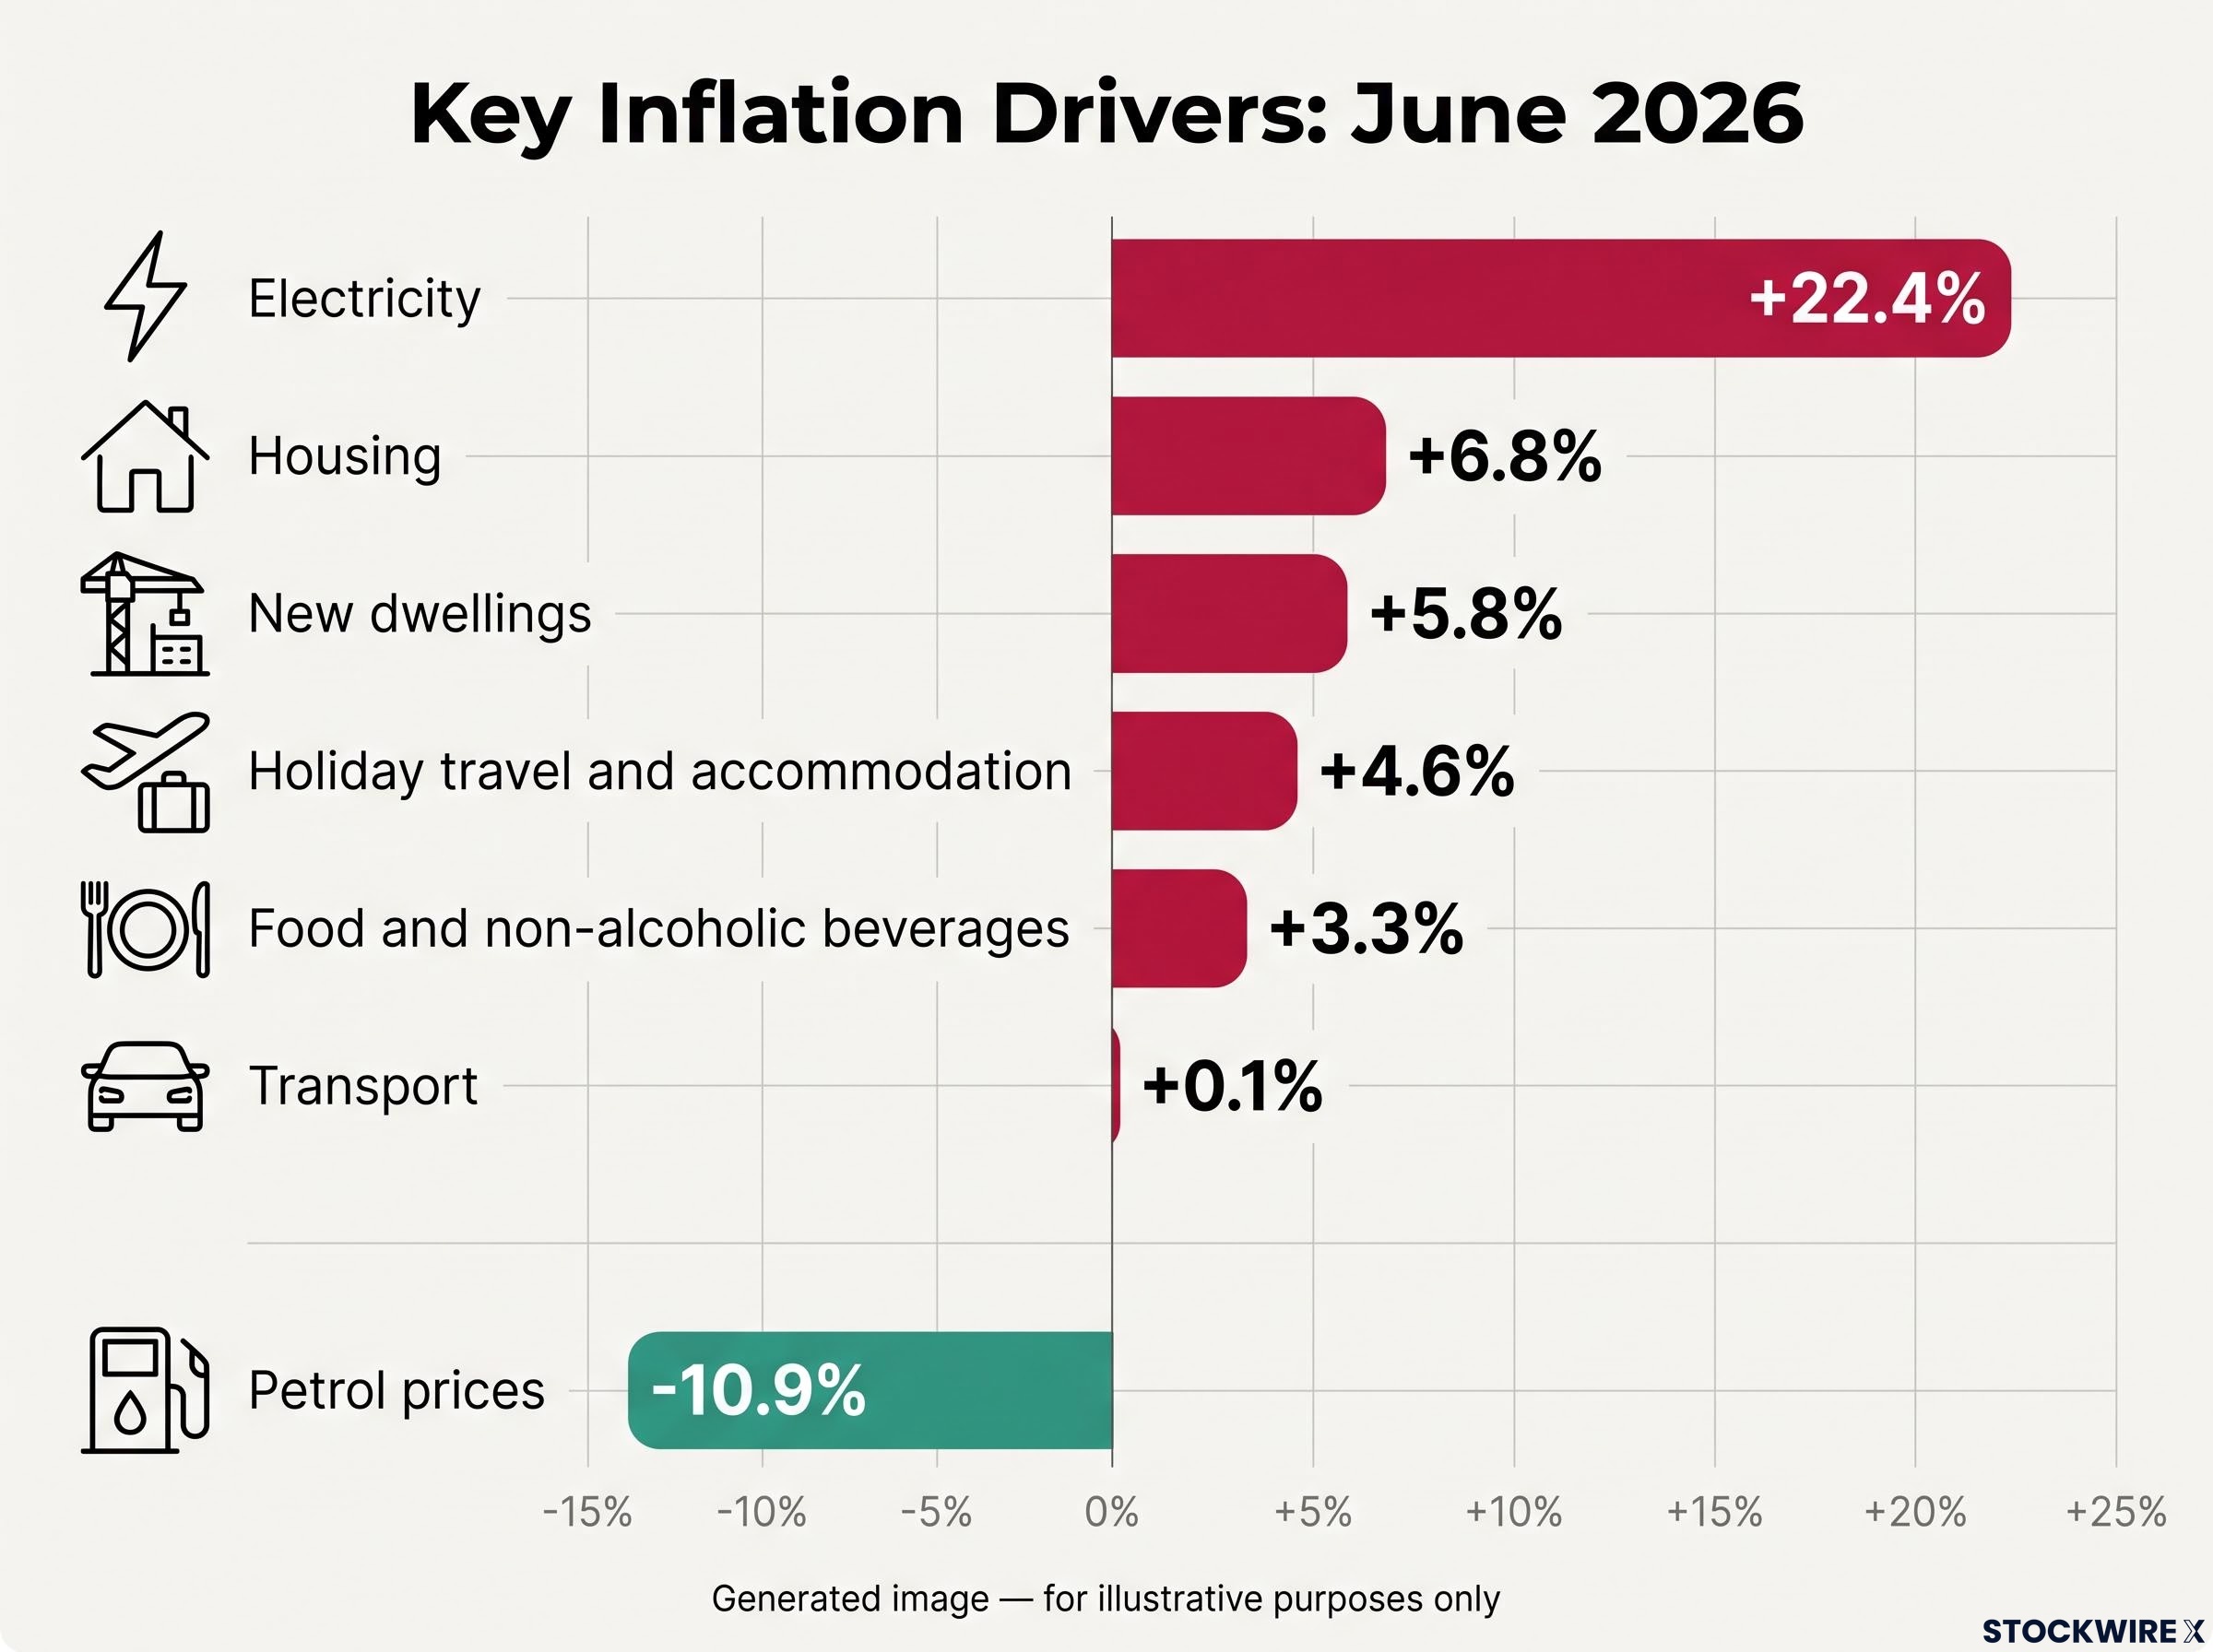
- Electricity: up 22.4% annually to June 2026, accelerating from 21.1% in the year to May. The increase reflects the conclusion of Commonwealth and state government rebate schemes that had been holding household bills down, rather than any growth in underlying energy demand.
- New dwellings: up 5.8% annually to June 2026, the sharpest rise recorded in close to three years. Construction firms have been pushing through higher costs for materials and labour into the prices paid by buyers.
Construction cost inflation began accelerating sharply from March 2026, when new dwelling costs rose at more than triple February’s monthly rate as oil-derived building materials and diesel-powered supply chains absorbed the global crude price shock, establishing the upward trajectory that carried into the June 2026 data.
ABS Head of Price Statistics Rachael McCririck pointed to the expiry of government electricity rebates as the primary force behind surging power costs, and noted that annual price growth for new dwellings had hit its highest point in nearly three years.
The electricity spike is a one-off structural reset. Once the rebate-driven base effect washes through the annual comparison, the year-on-year figure will moderate mechanically. New-dwelling cost growth is a different problem entirely. It reflects a supply pipeline constrained by labour shortages and material costs that have no near-term resolution. If you are forming a view on where inflation heads from here, these two sub-components deserve separate treatment. One will fade; the other will persist.
The cost relief hiding in the petrol price
Transport provided the strongest downward pull on June’s headline figure. The annual transport inflation rate dropped to just 0.1% for the year to June 2026, a sharp retreat from the 3.3% recorded for the year to May 2026. Petrol prices dropped 10.9% over the course of June.
Three factors drove the deceleration, in order of impact:
- A degree of easing in Middle East tensions through June, which translated into softer global oil prices and cheaper fuel at the bowser
- The federal government’s fuel excise relief measures, which had helped push automotive fuel costs lower in April and May, remaining active through the period
- Fuel prices recording falls in each of the three months from April through June 2026, building a compounding downward drag on the annual comparison
The relief is real in this month’s data. The question is whether it lasts. All three sources of transport disinflation sit outside the RBA’s control. A renewed escalation in the Middle East reverses the first factor. The expiry or withdrawal of excise relief reverses the second. The RBA cannot treat policy-dependent, geopolitics-dependent price falls as evidence of durable disinflation when setting the cash rate, and neither should you when forming a view on where inflation is heading.
What core inflation reveals that the headline does not
Headline CPI captures every price movement in the basket, including one-off swings like fuel collapses and electricity rebate expiries. The RBA pays closest attention to a different measure: the trimmed mean, which the ABS calculates by stripping out the most extreme price changes at both the top and bottom of the basket each period. What remains is a cleaner read on underlying inflation momentum, less distorted by any single category.
The trimmed mean methodology strips out the most extreme price movements at both ends of the basket each period, producing a cleaner signal on underlying inflation momentum than the headline rate alone can provide.
The June 2026 trimmed mean result
Underlying inflation held steady at 3.6% for the twelve months to June 2026, matching the result for the prior month, according to the ABS. The quarterly trimmed mean rose 0.8% quarter-on-quarter.
The 3.6% annual trimmed mean sits below both market expectations of 3.7% and the RBA’s own May 2026 forecast of 3.8%.
That below-forecast result matters. It slightly reduces the urgency for further tightening. But 3.6% is still well above the RBA’s 2-3% target band, which means the central bank has no clear mandate to ease either.
One methodological detail is worth noting. The ABS has excluded automotive fuel from the trimmed mean calculation in every month since March 2026, when Middle East conflict began generating outsized swings in fuel prices. That means the trimmed mean may not fully reflect the extent of fuel-driven relief visible in the headline CPI. The core measure is excluding the category that provided the most dramatic downward pull.
Recreation, food, and the other pressures worth watching
Housing dominates the inflation story, but it is not the only category running above the RBA’s target. Three secondary contributors confirm that price pressures remain broad-based:
- Recreation and culture: 3.3% annually to June 2026, a noticeable step up from the 2.4% recorded through to May. The cost of holiday travel and accommodation climbed 4.6% in June, with the northern hemisphere’s peak tourist season drawing more Australian travellers abroad and higher jet fuel costs adding to fares.
- Food and non-alcoholic beverages: 3.3% annually to June 2026, with grocery prices remaining structurally elevated relative to pre-pandemic norms.
The acceleration in recreation is particularly notable. A 0.9 percentage point jump in a single month tells you seasonal travel demand is layering additional pressure on top of the structural housing story. For anyone watching consumer-facing sectors, from travel operators to food retailers, these figures carry direct earnings and discretionary spending implications.
What the RBA does next, and what could change the calculus
The RBA held the cash rate at 4.35% at its June decision. The next scheduled meeting is 11 August 2026.
The RBA’s June hold decision kept the cash rate at 4.35% amid signs of a sharper-than-expected economic slowdown, with unemployment jumping to 4.5% and capacity utilisation declining at a pace the Board did not explicitly address in its post-meeting statement.
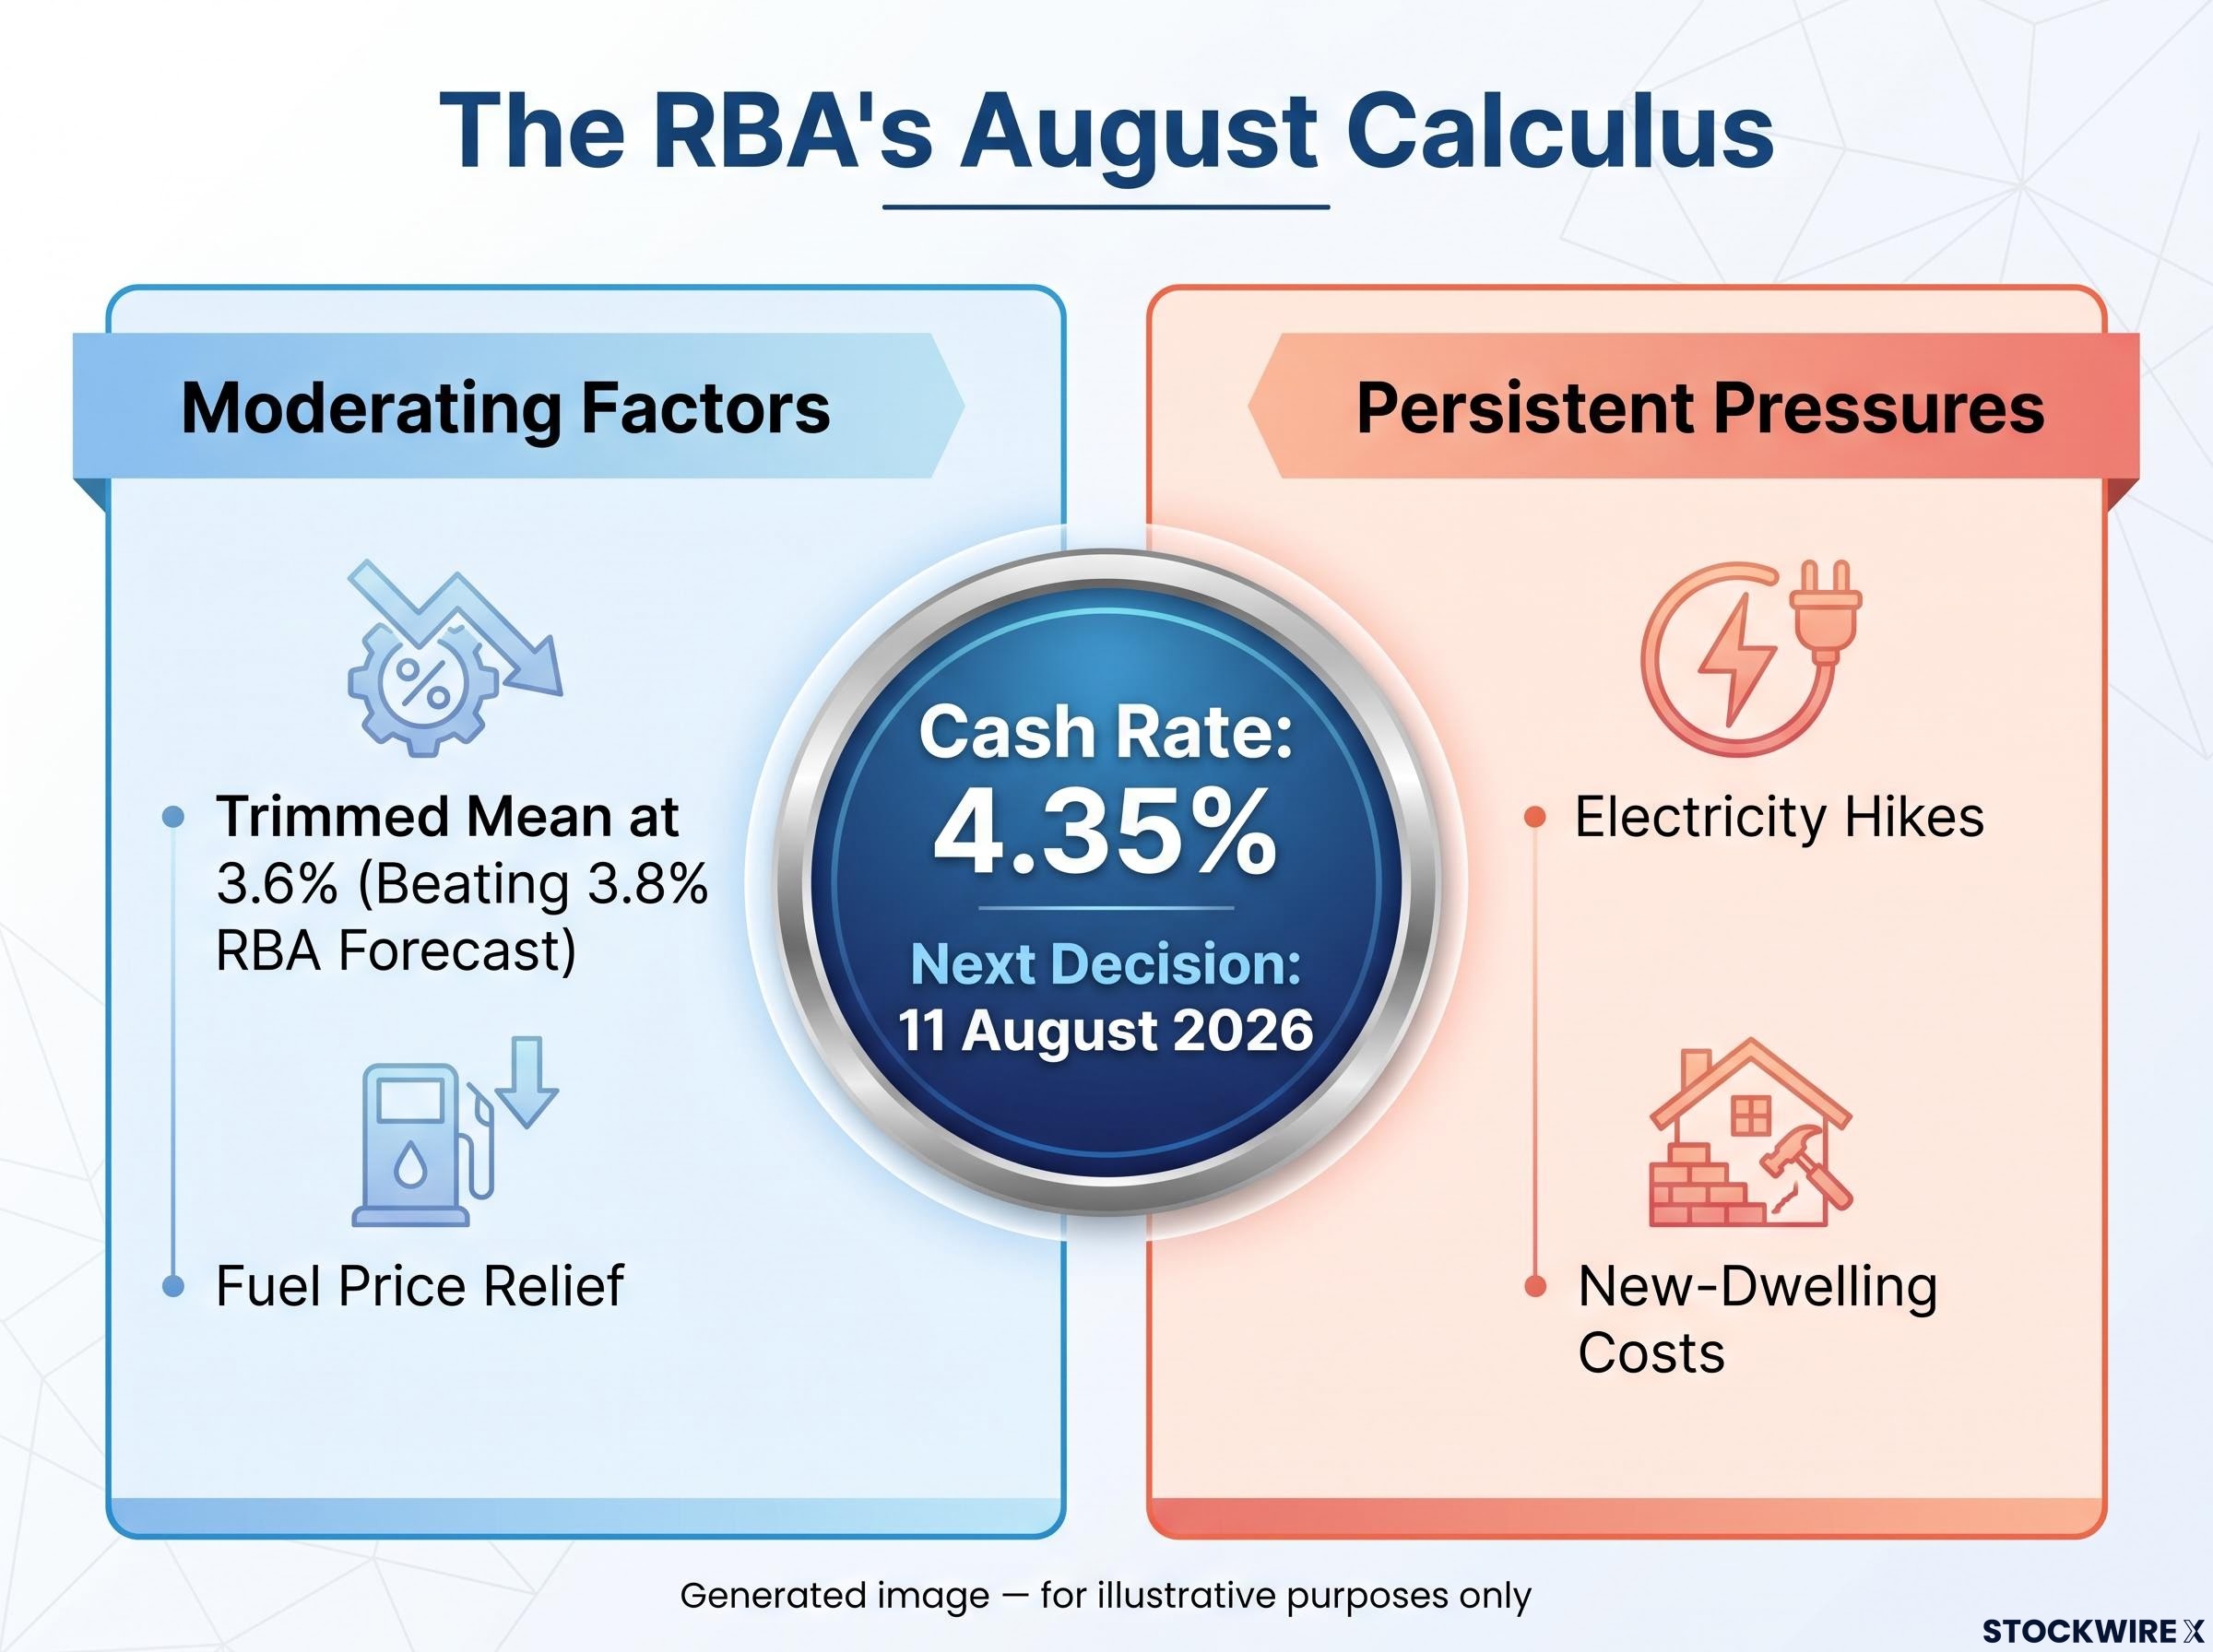
The below-forecast trimmed mean gives the board room to hold without looking like it is ignoring progress. But the persistence of housing-driven structural inflation, with electricity and new-dwelling costs showing no sign of near-term relief, keeps rate cuts off the near-term horizon.
Reuters noted that the trimmed mean coming in below the RBA’s forecast “lessened pressure for a further hike,” while Shadow Board commentary assigned a higher probability to holding at 4.35% than to either cutting or hiking.
Two variables will determine whether the August meeting shifts the RBA’s tone:
- Whether fuel price relief persists beyond the temporary policy measures and geopolitical stabilisation that drove it
- Whether housing and construction costs show any early signs of easing in the next monthly data
For investors in rate-sensitive Australian equities, property, and fixed income, the distinction between “hold with a tightening bias” and “hold with a neutral bias” is material for positioning. The balance of evidence currently sits closer to the former.
A moderation that is real but not yet reliable
Headline inflation is tracking below the RBA’s peak forecast, with the actual 4.6% peak in March undershooting the projected 4.8%. The trimmed mean at 3.6% is beating the RBA’s 3.8% forecast. That is genuine progress.
It is not resolution. Structural housing pressures remain embedded, transport relief depends on geopolitics and temporary policy, and secondary categories from food to travel are still running above target. The question is whether June 2026 marks the start of a sustained downtrend or a temporary dip before renewed pressure, and the answer depends on three things: housing construction cost relief, fuel excise policy continuation, and the RBA’s August assessment of the trimmed mean trajectory.
For investors wanting to model the duration and cost implications of an extended hold period, our full explainer on the RBA rate plateau outlook examines how all four major banks are framing the peak-rate environment through mid-2027.
This article is for informational purposes only and should not be considered financial advice. Investors should conduct their own research and consult with financial professionals before making investment decisions. Past performance does not guarantee future results. Financial projections are subject to market conditions and various risk factors.