Gold Bounces 0.8%, but the Fed and Dollar Hold the Ceiling
29 mins ago

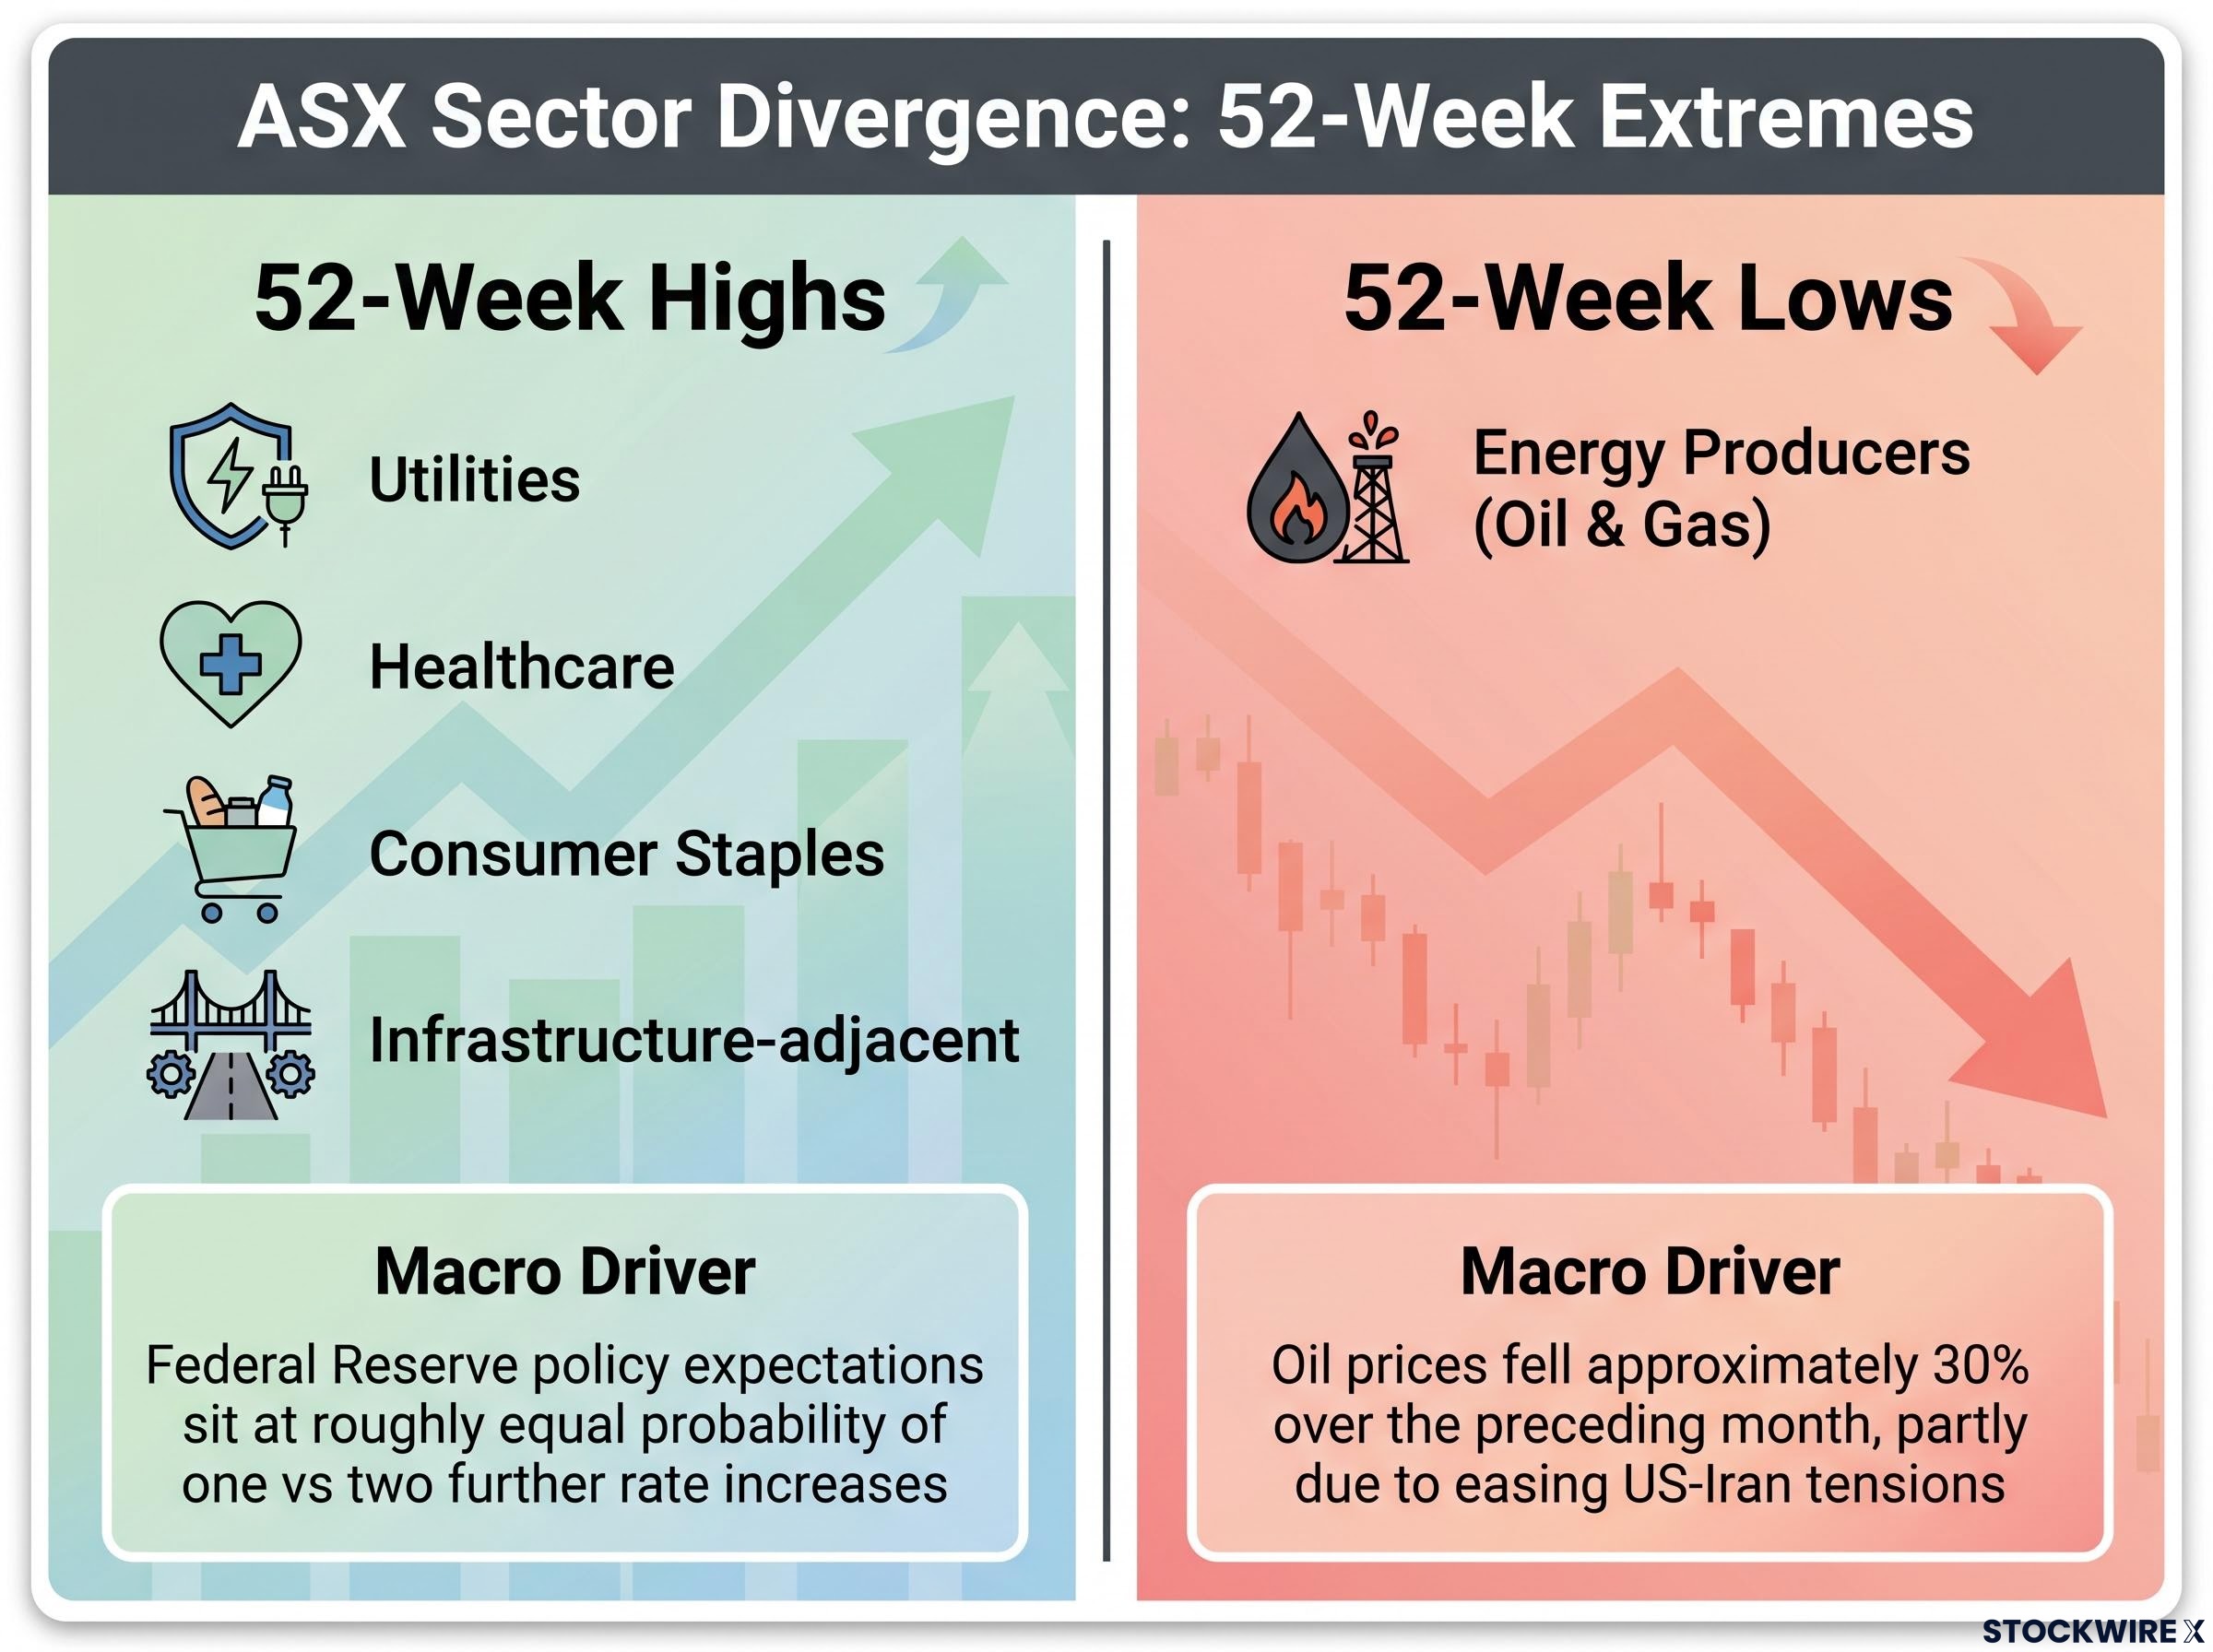
The S&P/ASX 200 finished the week ending 28 June 2026 almost exactly where it started, posting a net advance of just 0.28%. Beneath that unremarkable headline, a sharp divergence in ASX sector performance told a more revealing story. Defensive names in utilities, healthcare, and consumer staples pressed fresh 52-week highs, while energy stocks slid to 52-week lows as oil prices continued to fall. The gap between the two clusters points to a specific rotation underway inside the index, one that a headline number alone cannot capture, and one that Australian investors can learn to read each week using free public tools.
A net weekly move of 0.28% would normally suggest a quiet period for the index. The intra-week path suggests otherwise.
The ASX 200 gained 1.8% across the first three sessions of Week 26, then gave back 1.5% over the final two, netting just 0.28% for the week.
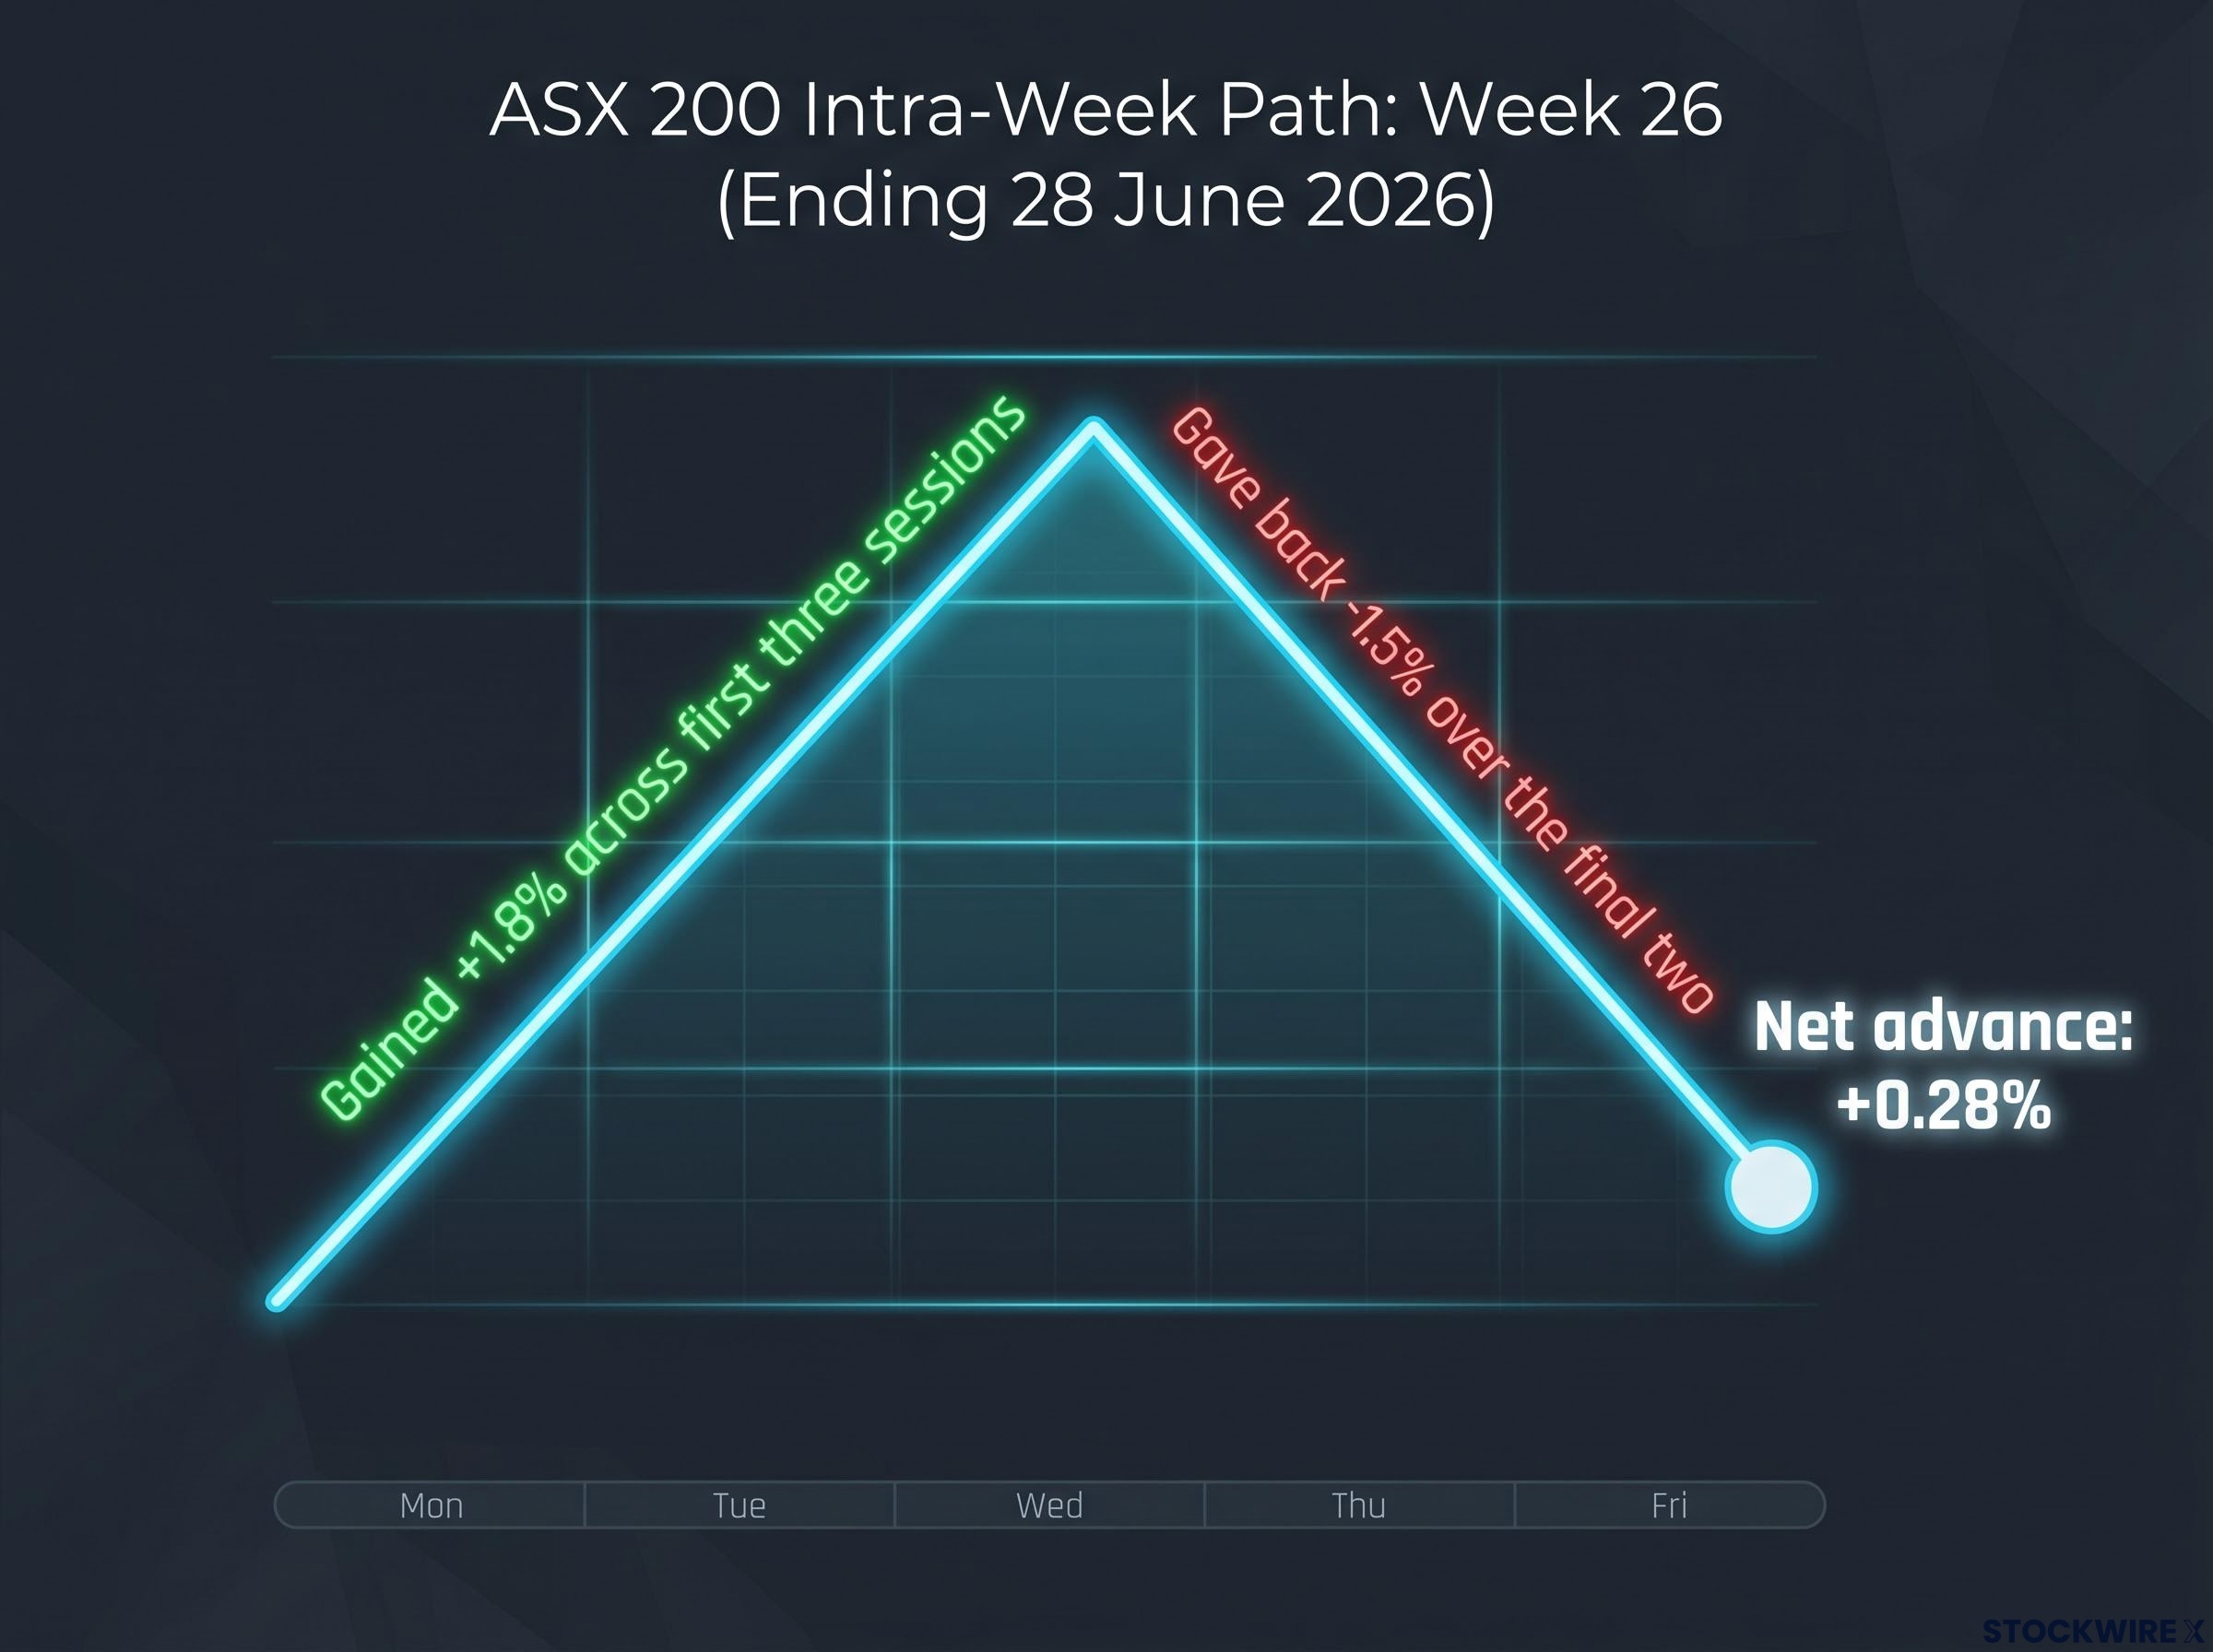
That kind of reversal, compressed into five trading days, points to competing forces pulling the index in opposite directions rather than a market drifting sideways.
The S&P/ASX 200 index methodology uses float-adjusted market capitalisation weighting combined with GICS sector classification, which means heavy concentrations in resources, financials, and healthcare translate directly into amplified index-level responses whenever those sectors move in opposite directions.
The composition of the 52-week extremes confirms the tension:
This is not a market making a broad directional call. It is a market in which capital is actively rotating from one earnings profile to another. The flat close is the residue of that rotation, not a signal that nothing happened.
A single stock reaching a 52-week high or low is mainly a story about that company. It might reflect an earnings beat, a contract win, or a management change. The signal sharpens considerably when multiple stocks within the same sector hit annual extremes at the same time.
When a cluster forms, the odds increase that a shared driver is pushing those names in the same direction. That shared driver typically falls into one of two categories: a macro force (interest rates, inflation expectations, growth outlook) or a fundamental force tied to that sector’s economics (a commodity price move, a regulatory change, a shift in demand patterns).
The Week 26 pattern fits a well-documented template: sector rotation strategy works because institutional capital repositions ahead of economic changes, meaning the sector leadership visible in weekly 52-week high and low lists often precedes official data confirmation by weeks or months.
Public ASX screeners that list stocks at 52-week highs and lows make this clustering immediately visible. During Week 26, the pattern was clear: defensives dominated the high list; energy dominated the low list. Most sectors that had declined earlier in 2026 had already found a floor and begun recovering. Energy remained the outlier, still under sustained selling pressure.
| Cluster location | What it typically signals |
|---|---|
| Defensives at 52-week highs | Investor preference for safety, income, and earnings visibility over cyclical upside |
| Energy at 52-week lows | Repricing of commodity-linked earnings; sector-specific stress rather than broad market weakness |
The cluster is the diagnostic tool. The next step is understanding what each side of this particular divergence is telling investors.
The bid for defensives in Week 26 is deliberate, not panicked. Three specific features are drawing capital into these sectors:
Federal Reserve policy expectations as of Week 26 sit at roughly equal probability of one versus two further rate increases, leaving the rate path unusually uncertain and reinforcing the appeal of predictable cash flows.
The same pattern surfaced three weeks earlier: defensive rotation on rate-hold bets drove Communication Services, Consumer Staples, Healthcare, and Real Estate higher on 9 June 2026, while materials, gold, and uranium absorbed sharp selling as weak Westpac and NAB data locked in the RBA pause narrative.
The 0.28% net weekly advance reinforces the tone. This is not euphoric, broad-based buying. Investors are selectively paying up for the most visible earnings streams in the market, while leaving higher-beta sectors alone. The defensive cluster at 52-week highs reflects capital preservation, not momentum chasing.
Oil prices fell approximately 30% over the month preceding Week 26. For ASX-listed energy producers, that decline reprices the present value of future cash flows almost immediately.
The mechanism is direct: producers’ revenues and free cash flow are tied to benchmark oil and gas prices. When the commodity drops sharply, analyst earnings estimates follow, and share prices adjust to the new forward-earnings profile. The 30% decline was attributed partly to reduced tensions between the US and Iran, which stripped a geopolitical risk premium out of the oil price without any corresponding change in underlying demand.
That geopolitical component matters because it shows how quickly a pricing assumption can evaporate. A risk premium that took months to build can disappear in weeks once diplomatic signals shift.
The Week 26 reading sits in sharp contrast to the breadth split recorded in the week ending 22 May 2026, when energy names including Santos and Ampol were among those hitting 52-week highs as geopolitical tensions sustained a risk premium in crude, before that premium began unwinding in subsequent weeks.
Three contributing factors explain the energy cluster at 52-week lows:
Even operationally sound energy producers saw their shares fall during this period. The stable ASX 200 headline confirms the pressure is confined to the commodity-linked segment rather than reflecting broader risk aversion.
This is the distinction investors weighing a “buy the dip” decision need to understand. The share-price decline reflects a genuine earnings repricing, not a sentiment-driven overshoot. Whether the recovery materialises depends on whether the oil-price driver reverses, not on whether the companies themselves are well managed.
The ASX 200 carries heavy weights in resources and energy alongside sizable exposures to banks, healthcare, and consumer staples. That composition creates an in-built tension when commodities and defensives move in opposite directions.
Week 26 illustrated the effect clearly. Defensive stocks pulled the index higher while energy stocks dragged it lower. The result: a 0.28% net advance that masked a 1.8% gain followed by a 1.5% decline within the same five-day window.
| Sector type | What the cluster signals about current investor sentiment |
|---|---|
| Defensives (utilities, healthcare, staples) | Willingness to pay up for stable, rate-insensitive cash flows |
| Energy (oil and gas producers) | Marking down commodity-linked earnings after a sharp oil price decline |
The clustering pattern reflects structural allocation choices rather than a broad directional view on Australia’s economic outlook. Investors are not making a blanket “risk-on” or “risk-off” call. They are rotating capital toward one earnings profile and away from another, and the index headline is a poor summary of that activity.
The Week 26 pattern is useful beyond this single week. The same framework can be applied each Friday using free public screeners:
Tracking market breadth alongside the headline index return is the methodology that makes this pattern legible: in the week ending 1 May 2026, 22 ASX 200 constituents hit fresh 52-week lows while the index itself fell just 0.65%, an almost identical gap between surface calm and internal stress to the one visible in Week 26.
The most consequential step is the last one. The cluster identifies the rotation; the transient-versus-durable assessment determines whether it persists or reverses.
Applied consistently, this four-step process converts a raw screener output into a structured thesis. No specialised data subscription is required.
Three conclusions emerge from the Week 26 divergence:
The durability of both signals depends on whether the underlying drivers persist. If oil prices stabilise or geopolitical risk premium returns, energy’s 52-week low cluster may mark a trough. If Fed rate uncertainty extends and growth visibility remains limited, the defensive bid may have further to run.
The analytical value is not in mechanically buying stocks at 52-week highs or selling those at lows. It lies in understanding the driver behind each cluster and determining whether that driver aligns with a given time horizon and risk tolerance.
This article is for informational purposes only and should not be considered financial advice. Investors should conduct their own research and consult with financial professionals before making investment decisions.
Sector rotation is the movement of institutional capital from one industry group to another, typically in response to changing economic conditions or earnings outlooks. On the ASX 200, it becomes visible when multiple stocks within the same sector cluster at 52-week highs or lows simultaneously, as happened in Week 26 when defensives dominated the highs list and energy stocks dominated the lows list.
Defensive sectors such as utilities, healthcare, and consumer staples are attracting capital because their earnings are less sensitive to interest rate uncertainty and economic slowdowns, and many pay steady dividends that become comparatively attractive when growth visibility in cyclical sectors is limited.
Oil prices declined approximately 30% in the month preceding Week 26, partly due to easing US-Iran geopolitical tensions that removed a risk premium from crude prices, which directly repriced the forward earnings of ASX-listed oil and gas producers and pushed their share prices to annual lows.
Investors can scan weekly 52-week high and low lists using free public ASX screeners, identify which GICS sectors are concentrated on each list, map those clusters to a shared macro or fundamental driver, and then assess whether that driver is transient or durable to determine if the rotation is likely to persist or reverse.
A flat weekly return can mask significant internal activity; in Week 26, the ASX 200 gained 1.8% across the first three sessions before giving back 1.5% in the final two, with defensive stocks pulling the index higher and energy stocks dragging it lower, producing a net 0.28% advance that concealed an active sector rotation.