Iran Walks Out of Swiss Talks, Sending US Stock Futures Lower
3 hrs ago

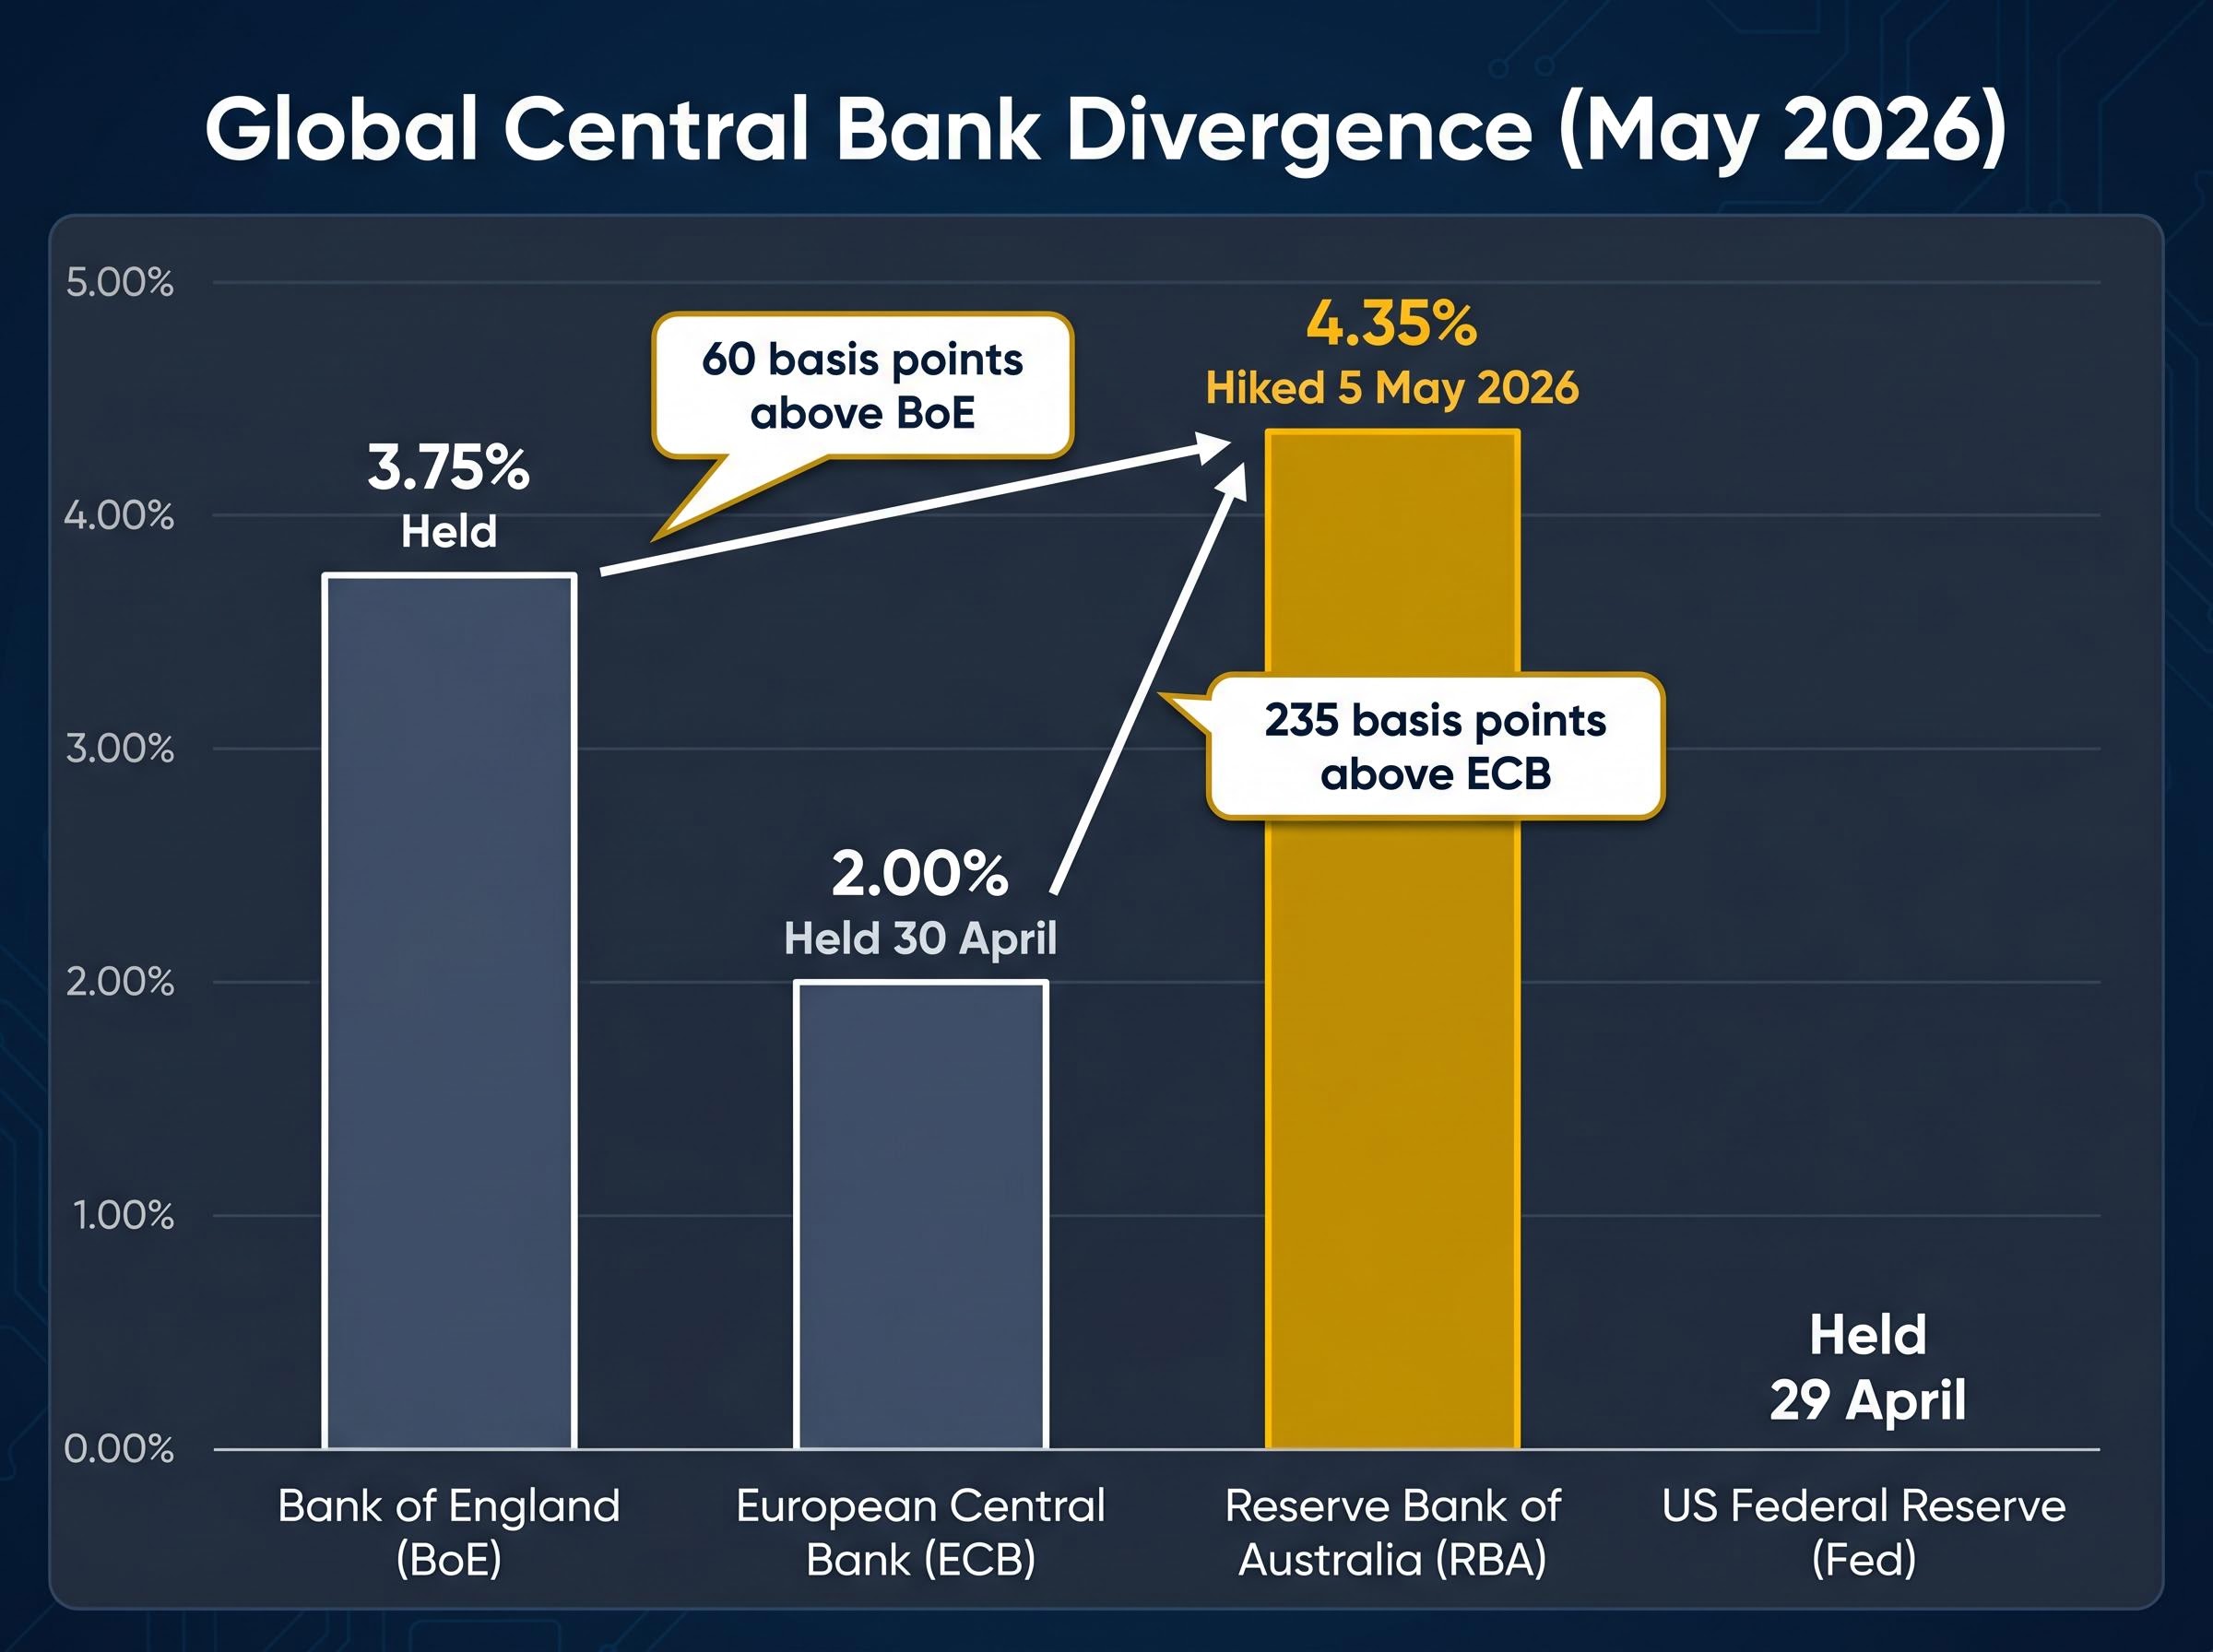
While the US Federal Reserve, the Bank of England, and the European Central Bank all held rates steady in the same week, Australia’s central bank raised borrowing costs for the third consecutive time. The Reserve Bank of Australia pushed the cash rate to 4.35% on 5 May 2026, cementing its position as the most aggressive major central bank in the developed world.
The decision, delivered by an 8-1 vote, arrives as Australian households contend with weakening consumer sentiment and contracting retail spending. The RBA’s rationale centres on energy-driven cost pressures and the risk those costs embed into wages and broader prices. Critics argue this reasoning fundamentally misreads how inflation works.
What follows explains what the RBA decided and why, how its logic differs from the approach taken by peer central banks, what the decision means for Australian borrowers and investors, and how to evaluate whether the RBA’s concern about second-order inflation effects is grounded in monetary reality.
The numbers are difficult to read any other way. On 5 May 2026, the RBA raised the cash rate to 4.35%, with eight board members voting for the hike and one preferring to hold at 4.10%. The decision came days after the Fed held on 29 April, the ECB held at 2.00% on 30 April, and the Bank of England sat at 3.75%.
The gap is not marginal. The RBA’s rate now sits 235 basis points above the ECB and 60 basis points above the Bank of England, making this divergence a quantitative fact rather than a matter of characterisation.
The FOMC’s dual mandate conflict, with PCE inflation at 3.5% running against a 2% target while unemployment has risen to 4.3%, explains why the Fed held on 29 April despite inflationary pressure that in isolation would have argued for tightening, a constraint the RBA does not face with the same force given Australia’s comparatively tighter labour market.
| Central Bank | Current Rate | Decision (May 2026) |
|---|---|---|
| RBA | 4.35% | Hiked |
| US Federal Reserve | Held | Held (29 April) |
| ECB | 2.00% | Held (30 April) |
| Bank of England | 3.75% | Held |
A UBS strategist, quoted by Bloomberg on 5 May, described the divergence plainly: “Aussie outlier driven by unique commodity exposure; Fed/BoE/ECB see energy as transitory.”
For Australian investors and borrowers, a central bank tightening against the global trend carries specific risks around exchange rates, capital flows, and the domestic growth outlook that do not arise when policy moves in sync with peers. Something unusual is happening. The question is whether it is prudent or premature.
The RBA’s May 2026 monetary policy decision statement confirms the 8-1 vote, the cash rate target of 4.35%, and the board’s stated reasoning around energy-driven cost pressures and labour market capacity, providing the primary source for the analytical claims examined throughout this article.
The board’s case starts with the data. Headline CPI reached 4.6% year-on-year in March 2026, according to ABS figures, up from 3.7% in February. Monthly CPI rose 1.1%, the fastest pace since July 2025. Goods inflation surged to 5.5% year-on-year, up from 3.5% in February, driven overwhelmingly by energy costs linked to Middle East supply disruptions.
All three measures sit well above the RBA’s 2-3% target band.
Governor Michele Bullock’s post-meeting remarks framed the decision not as a response to the immediate energy spike, but as a pre-emptive move against what comes after it. The concern is the second-order mechanism: energy costs rise, businesses absorb them and then pass them through, workers demand compensation, and prices rise again. Analyst Evan Lucas, in post-decision commentary, warned this wage-price feedback loop could embed inflation if left unchecked.
The RBA cited three pillars for the decision:
The 8-1 vote signals board conviction. August 2026 is the next meeting where these assumptions face their next test.
Before evaluating the RBA’s logic, it helps to be precise about what inflation is and what it is not. Milton Friedman’s foundational principle holds that inflation is a monetary phenomenon, arising from excessive money supply expansion relative to the supply of goods and services. This is distinct from the cost-push narrative the RBA is operating under, where a single input (energy) is expected to cascade through wages and prices.
The distinction between cost-push and demand-pull inflation sits at the centre of the RBA’s credibility problem: monetary inflation mechanics, including money supply expansion, velocity, and the conditions under which price increases become self-sustaining, are more precisely traced in history during episodes like the Volcker Shock, where the Fed deliberately induced a severe recession to break entrenched inflation expectations anchored by genuine monetary excess.
The distinction matters because of the substitution effect. When households pay more for fuel, they spend less on other goods and services. That spending compression creates downward price pressure elsewhere in the economy. For a broad and sustained inflation to take hold, the money supply itself must be expanding fast enough to accommodate rising prices across the board.
Inflation arises from excessive money supply expansion relative to goods and services, not from any single cost input rising in price.
Australian M3 money supply growth sits at approximately 7.5-8.3% year-on-year as of early 2026, according to RBA data. The historical median for M3 growth in Australia since 1960 is approximately 8.6%. Current money growth, in other words, is near or below the long-run average, not elevated. If the money supply is not accelerating, the monetary foundation for sustained broad inflation may not exist, regardless of what fuel prices are doing.
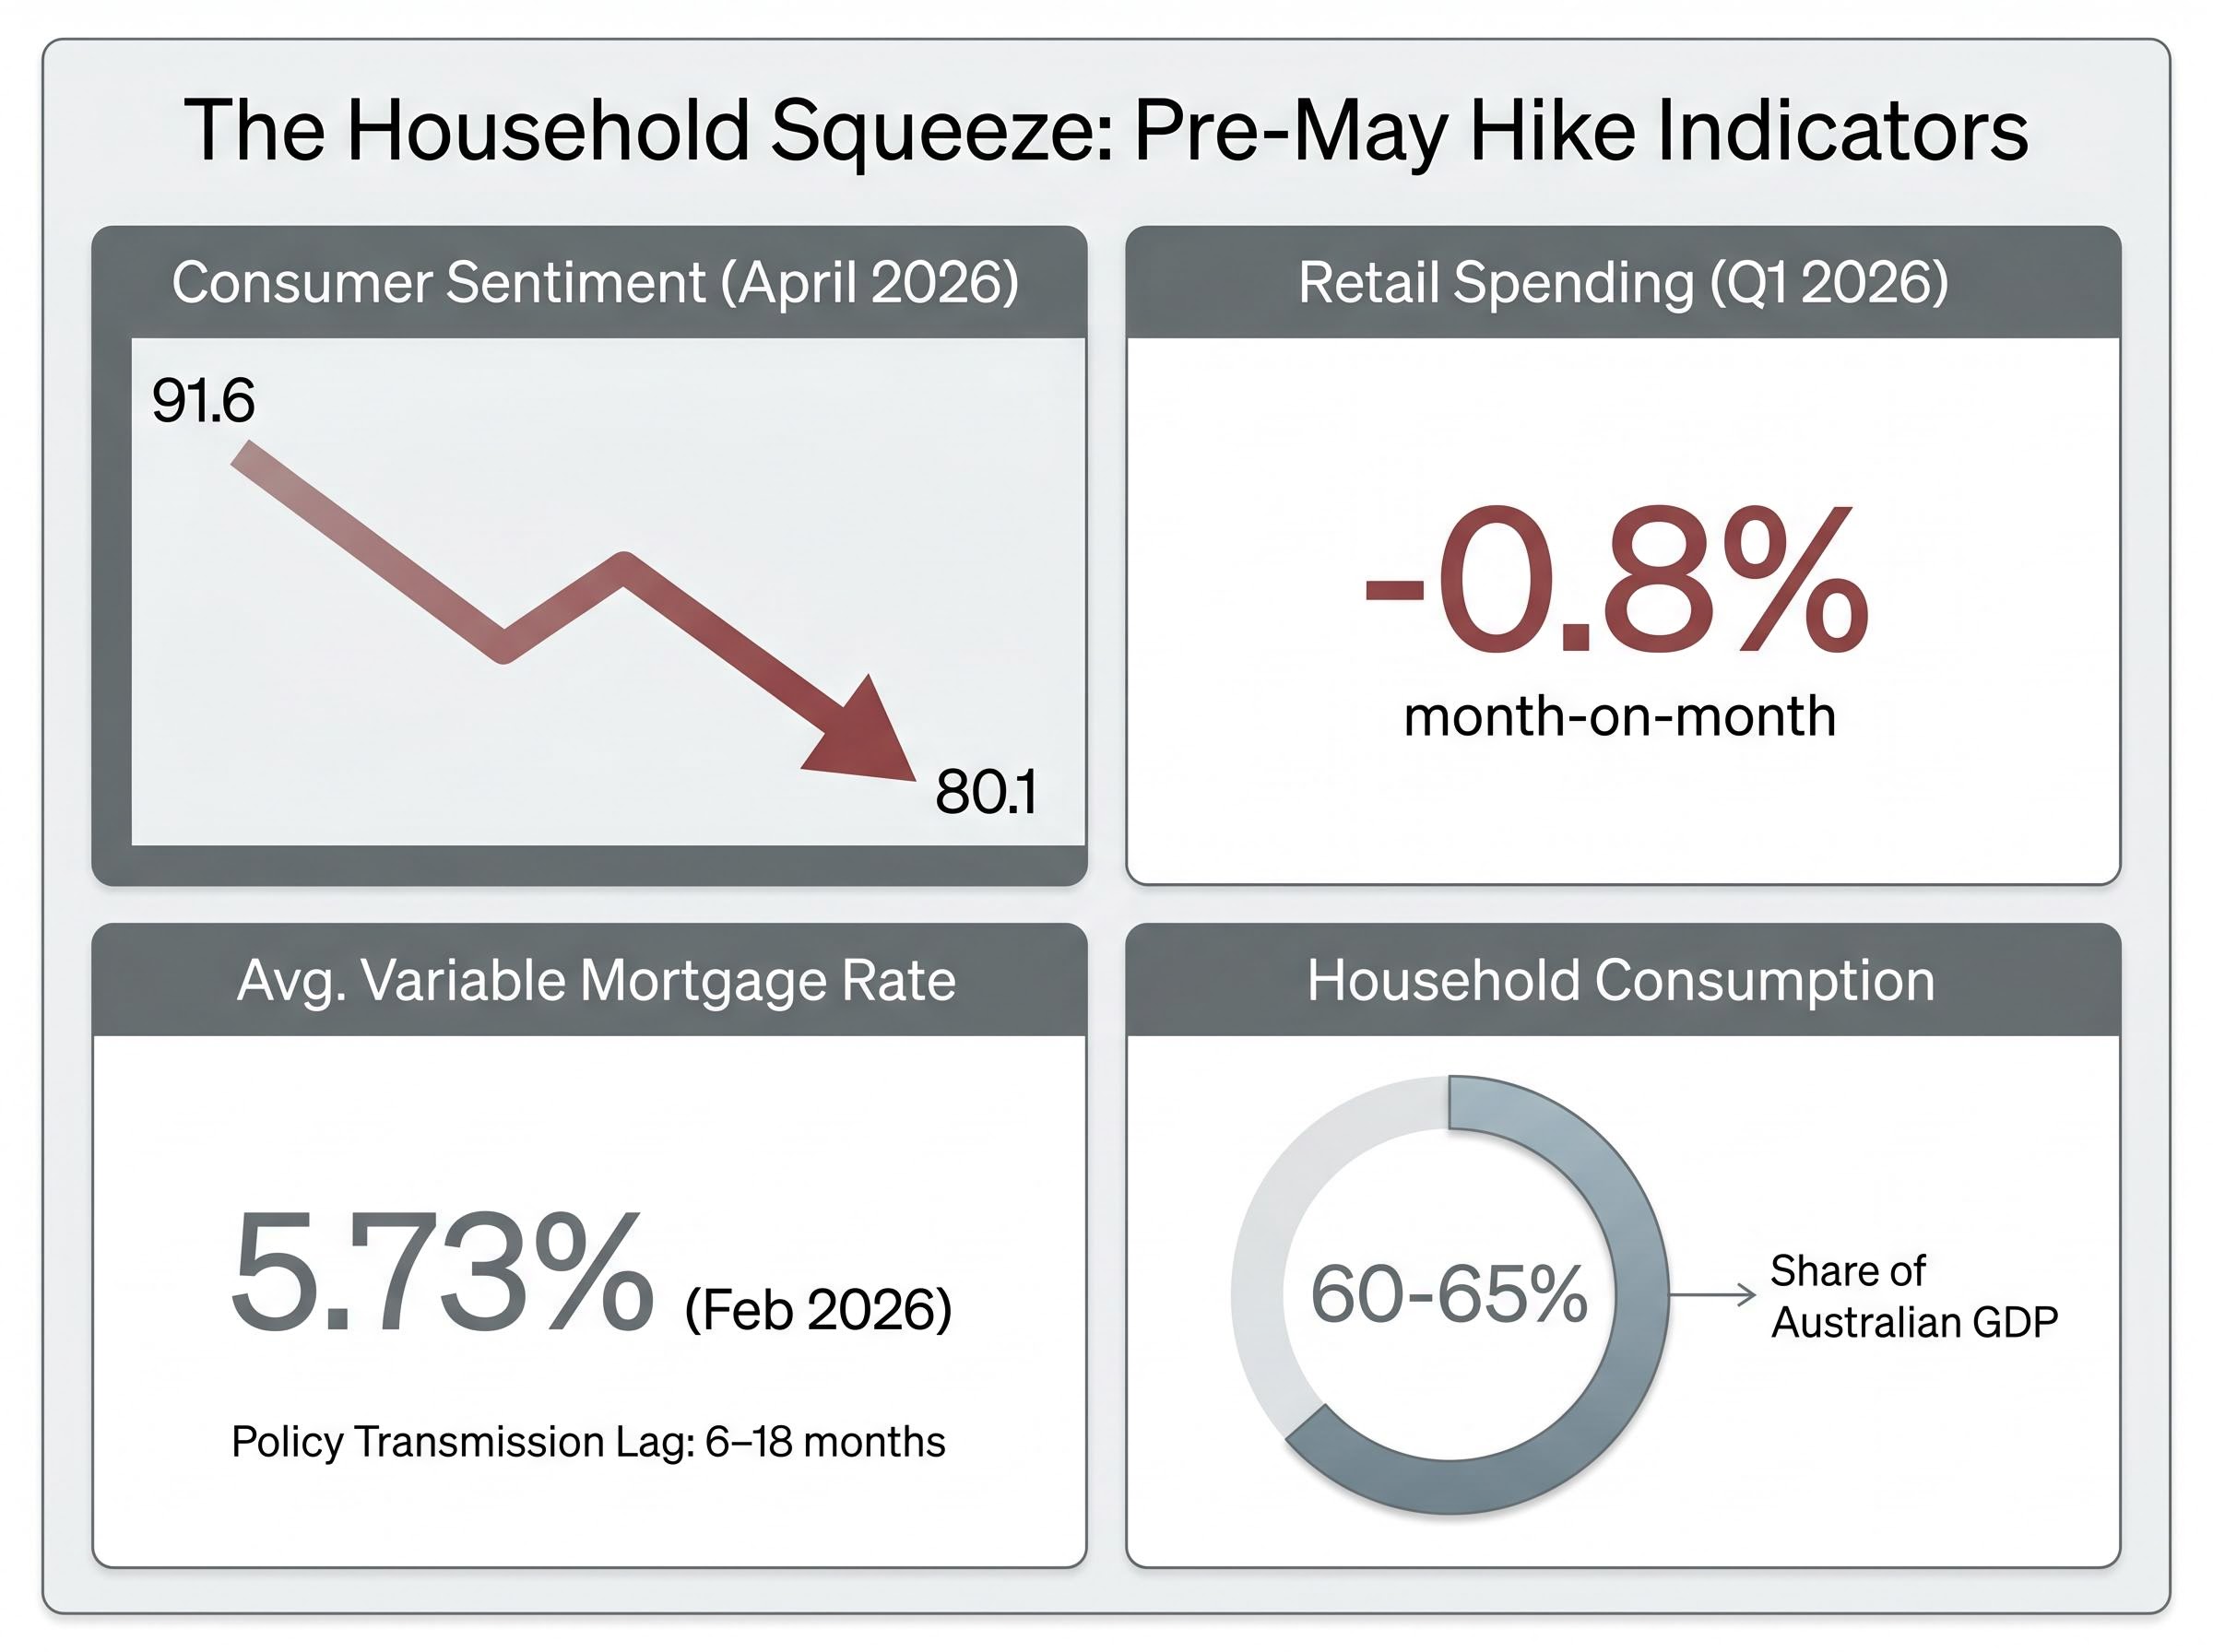
The policy debate carries real cost. Consumer sentiment collapsed from 91.6 to 80.1 in the Westpac-Melbourne Institute survey for April 2026, a sharper deterioration than initially reported. Retail spending contracted 0.8% month-on-month according to Westpac’s Q1 2026 survey. The average variable owner-occupier mortgage rate stood at approximately 5.73% as of February 2026 RBA data, with the May hike not yet reflected in official statistics.
The New Daily described the hike on 5 May 2026 as “wiping out more than a year of interest savings” for borrowers.
Household consumption represents approximately 60-65% of GDP. When consumers pull back at this scale, the macroeconomic consequences follow. Governor Bullock acknowledged that the effects of prior hikes will not appear in data for at least six months, raising the risk that the RBA is tightening past the point where cumulative damage becomes visible. For investors with exposure to consumer-facing sectors, the demand compression signal matters as much as the rate level itself.
For investors with positions in rate-sensitive equities, ASX sector rotation following Bullock’s afternoon press conference illustrated how quickly market expectations can reprice: Real Estate, Information Technology, and Communication Services recovered after the governor’s dovish tone, while Financials and Consumer Discretionary finished lower on net interest margin compression concerns.
The yield curve, the spread between short-term and long-term government bond rates, is one of the clearest forward-looking signals available for assessing where monetary policy is heading. When the curve is steep, banks lend freely and growth is supported. When it flattens, lending margins compress. When it inverts (short-term rates exceed long-term rates), recession risk is elevated. Most Australian home loans are floating-rate and tied to the cash rate directly, but business lending is the channel where yield curve shape exerts its strongest influence on economic activity.
Recent hikes have flattened Australia’s yield curve, roughly reversing the steepening that occurred in late 2025. The current spread sits at approximately mid-to-late 2025 levels, a period considered economically stable, but has not yet pushed into inversion. The global yield curve, by contrast, has continued to steepen over the same six-month period, reinforcing the RBA’s divergence from international trends.
Goldman Sachs commentary, reported by the Financial Times on 5 May 2026, questioned whether rate hikes are the appropriate tool for addressing supply-side energy shocks.
A further hike could push the curve into warning territory. The yield curve does not guarantee a recession, but it has historically provided a six-to-twelve-month leading signal on credit conditions and growth prospects that is more reliable than any single data release.
The RBA’s concern is not irrational. If inflation expectations become unanchored, the self-fulfilling dynamic is real: workers expect higher prices, demand higher wages, and businesses pass those costs through. The board’s decision to act reflects a genuine analytical framework, not carelessness.
The counterargument is equally grounded. If M3 money supply growth is near its 60-year average and not accelerating, there is no monetary basis for sustained broad inflation. Hiking into a supply-side shock risks inducing a recession that the data does not yet require. Westpac analysts argued the RBA is “behind the curve” not in tightening, but in its analysis, failing to distinguish monetary factors from energy pass-through.
An economist quoted by The New Daily on 5 May 2026 described the hike as “overly reactive” and a “misread” of the current inflationary environment.
The 2022 precedent is instructive. The Fed, ECB, and Bank of England pivoted abruptly from “transitory” framing to aggressive hiking. The same analytical error, ignoring money supply dynamics, can operate in both directions. ASX 30-Day Cash Rate Futures currently price approximately 65-74% probability of another 25 basis point hike by August 2026, implying a cash rate peak around 4.85% by November 2026.
Readers can apply a two-step framework to future central bank decisions:
These two signals, taken together, offer a clearer picture of inflation sustainability and recession risk than any single CPI print.
August 2026 is the next meeting where the RBA board will reassess whether energy pass-through has materialised into broader wage and price dynamics. Three signals will determine whether the RBA’s bet was correct:
Central bank decisions are not mechanistic. They are shaped by the biases and judgments of individual voting members, and data surprises between now and August can shift the 8-1 balance. Pre-May markets priced only approximately 40% probability of the hike that was ultimately delivered, a reminder that futures pricing is a directional signal, not a guarantee.
For borrowers trying to plan ahead beyond the August meeting, our comprehensive walkthrough of the major bank rate forecasts sets out each institution’s projected path including Westpac’s scenario for a cash rate of 4.85% by August, the conditions that would trigger further hikes in June and August 2026, and why the duration of the plateau rather than the peak rate level is the most consequential variable for household mortgage costs.
This article is for informational purposes only and should not be considered financial advice. Investors should conduct their own research and consult with financial professionals before making investment decisions. Past performance does not guarantee future results. Financial projections are subject to market conditions and various risk factors.
The Reserve Bank of Australia raised the cash rate to 4.35% on 5 May 2026, following an 8-1 board vote, marking the third consecutive hike and the highest rate among major developed-world central banks.
The RBA cited energy-driven cost pressures, capacity constraints in the domestic labour market, and rising short-term inflation expectations, arguing that pre-emptive action was needed to prevent energy costs from embedding into wages and broader prices.
Cost-push inflation arises from rising input costs like energy, while demand-pull inflation stems from excessive money supply growth relative to goods and services. The distinction matters because Australian M3 money supply growth of around 7.5-8.3% is near its 60-year historical average, which critics argue undermines the RBA's case for sustained broad inflation.
The average variable owner-occupier mortgage rate was approximately 5.73% before the May hike, and consumer sentiment collapsed from 91.6 to 80.1 in April 2026 while retail spending contracted 0.8% month-on-month, reflecting the cumulative pressure of three consecutive rate increases on household budgets.
The three key signals are trimmed mean CPI trajectory (to see if inflation is broadening beyond energy), M3 money supply growth rate (to assess monetary conditions), and the yield curve spread (to gauge recession risk), with ASX futures currently pricing a 65-74% probability of a further 25 basis point hike by August 2026.