
Most investors track what institutions own. Far fewer track what happens when the two largest institutional camps, hedge funds and mutual funds, converge on exactly the same names at exactly the same time.
Goldman Sachs tracks nearly 1,500 funds managing roughly $10 trillion in equity assets through two separate quarterly reports. Its “shared favourites” methodology identifies the specific stocks sitting at the intersection of the Hedge Fund VIP basket and the Mutual Fund Overweight basket simultaneously. This intersection is narrow by design: most of the time, the two investor types position very differently. When they agree, the overlap is worth examining.
Here is a clear read on the current overlap, the sector-level signal behind it, the structural risk that comes with it, and what the long-run performance record actually looks like once you strip away the most aggressive claims. If you use institutional positioning as one input in your own decisions, the analytical framework here is more durable than the headlines.
How Goldman Sachs identifies the stocks both hedge funds and mutual funds own
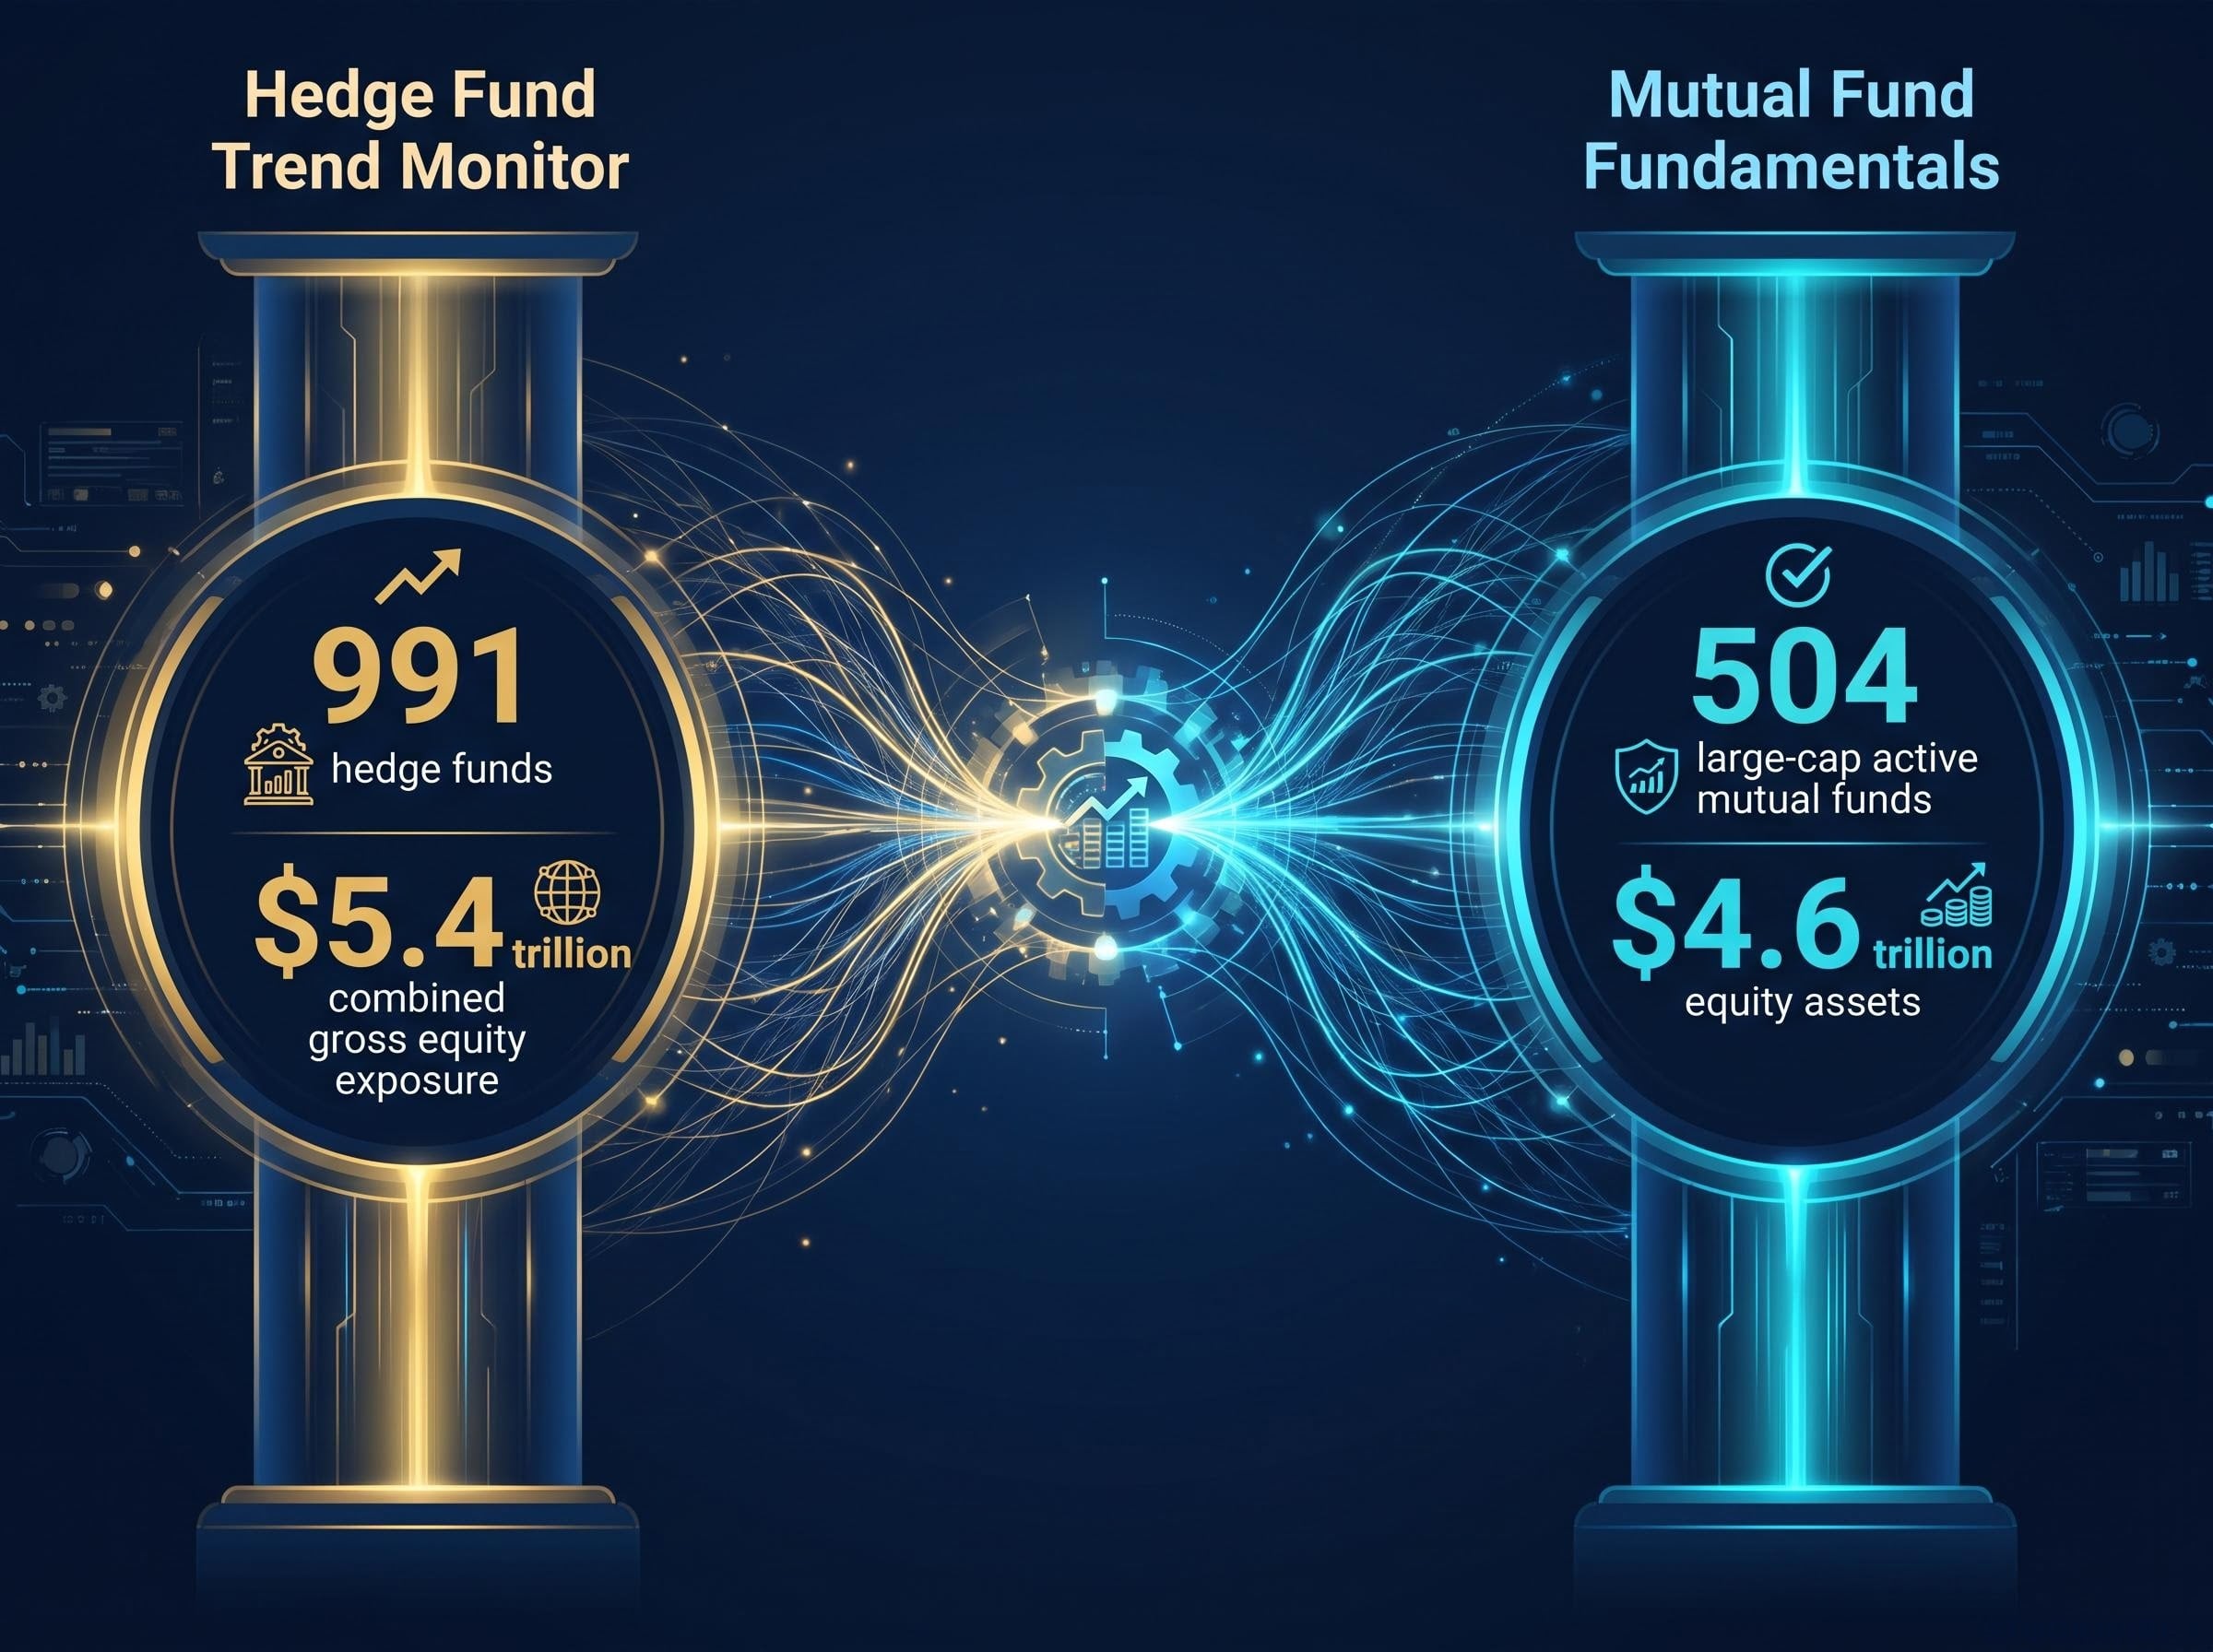
Goldman publishes two distinct quarterly reports that, taken together, map the equity positioning of professional capital at scale. The Hedge Fund Trend Monitor covers 991 hedge funds whose combined gross equity exposure totals approximately $5.4 trillion. The Mutual Fund Fundamentals report encompasses 504 large-cap active mutual funds whose equity assets total approximately $4.6 trillion. Those fund counts and asset figures come from the primary source and have not been independently confirmed, but the scope of coverage is directionally consistent with Goldman’s publicly described methodology.
The shared favourites concept identifies stocks that appear simultaneously in two baskets:
- Hedge Fund VIP basket: The stocks that appear most frequently among the top concentrated holdings of individual hedge funds, capturing where hedge fund managers have placed their highest-conviction bets.
- Mutual Fund Overweight basket: The stocks where large-cap active mutual funds hold positions most overweight relative to their benchmarks, capturing where fund managers have deliberately tilted away from index weights.
When a stock lands in both baskets at once, it means two structurally different investor types, with different mandates, different time horizons, and different benchmark constraints, have independently reached the same conclusion about the same name.
The 13F boundary and what it means for the list
Goldman draws exclusively from 13F filings, the quarterly disclosure that institutional managers above a certain threshold must file with the SEC. 13F filings cover long positions in publicly traded equities. They do not cover private company stakes, short positions, or derivatives.
This structural constraint defines the boundary of what can and cannot appear in a Goldman basket. Any name that is not a publicly traded equity, regardless of how widely it is held by institutional investors, cannot structurally appear in a list built from 13F data. Hold that boundary in mind when evaluating the specific names on the current list; it becomes directly relevant in the next section.
The 13F filing limitations that constrain Goldman’s baskets, including the quarterly reporting lag and exclusion of short positions, apply equally to any institutional positioning analysis: the Q1 2026 divergence between Berkshire adding Alphabet while Pershing Square exited the same stock illustrates how the same publicly available data can support opposite conclusions.
When big ASX news breaks, our subscribers know first
Which stocks made the current shared-favourites list, and which sources disagree
For Q3 2026, the primary source names six shared favourites: Boeing, Capital One Financial, Mastercard, SpaceX, Thermo Fisher Scientific, and Visa. That same source indicates Capital One, SpaceX, and Thermo Fisher joined the basket this quarter as new entrants, with Marvell Technology departing.
A separate set of research summaries covering early 2026 Goldman reports identifies a different five-stock overlap: Boeing, Citigroup, Mastercard, Vertiv, and Visa. Three positions diverge between the two versions.
The discrepancy may reflect different reporting periods within 2026, different versions of the Goldman report, or sourcing error. Neither version should be treated as definitive without direct access to the underlying Goldman publication.
| Stock | Q3 2026 source list | Early 2026 research list |
|---|---|---|
| Boeing | Yes | Yes |
| Capital One Financial | Yes | No |
| Citigroup | No | Yes |
| Mastercard | Yes | Yes |
| SpaceX | Yes | No |
| Thermo Fisher Scientific | Yes | No |
| Vertiv | No | Yes |
| Visa | Yes | Yes |
SpaceX and the 13F constraint: SpaceX remains a private company. Private companies are not 13F-reportable. Under the methodology Goldman uses to build these baskets, a private company cannot structurally appear. Readers should treat the SpaceX inclusion with particular scrutiny.
The more investable signal sits in what does not change between versions. Mastercard and Visa appear in both lists, in a 2023 Goldman overlap (alongside Cigna, Fiserv, Uber, and Workday), and in multiple interim periods. Persistent recurrence across years reflects durable institutional conviction, not quarterly rotation. That consistency is a stronger signal than any single-quarter composition.
What the long-run performance record actually shows
Performance claims for the shared-favourites basket vary depending on the source, and the gap between the most aggressive numbers and the independently supported figures is wide enough to change how you should size your conviction.
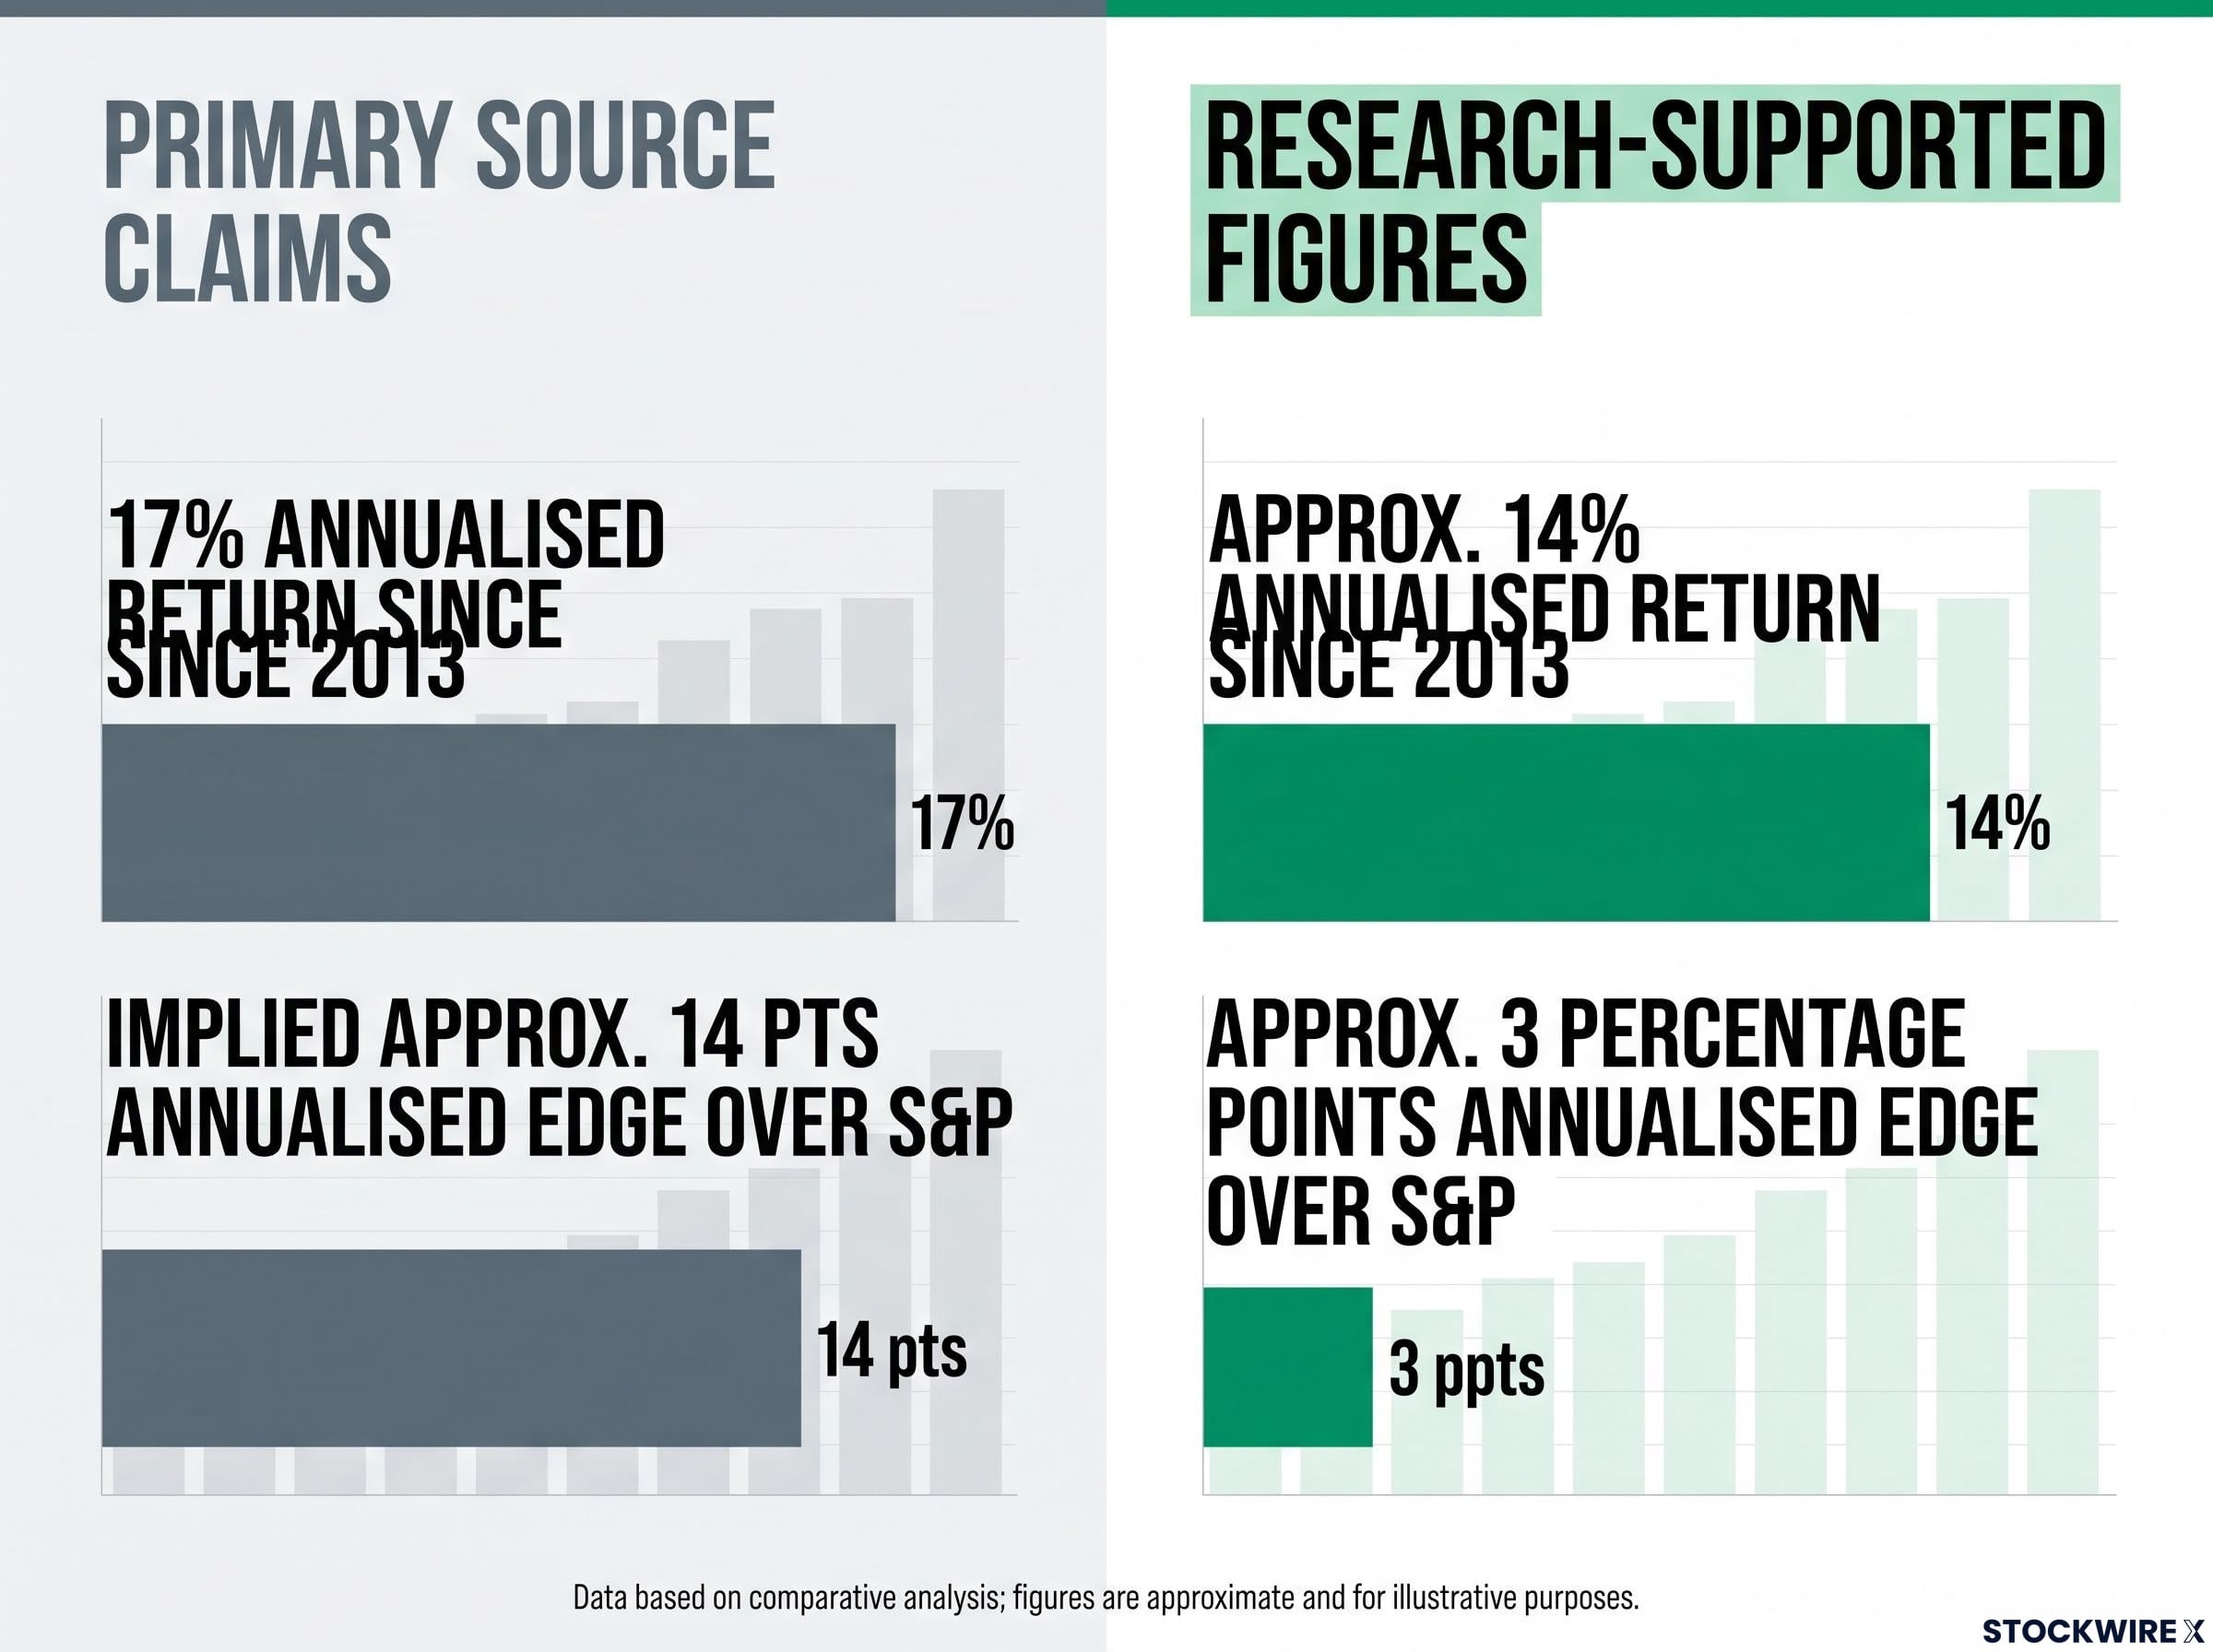
According to the primary source, the shared favourites basket generated a 29% year-to-date gain in 2026, beating the equal-weighted S&P 500‘s 16% return by 13 percentage points. The same source puts the basket’s annualised return since 2013 at 17%. Research summaries of Goldman’s early 2026 reports tell a different story: approximately a 2-percentage-point year-to-date edge and a 6-percentage-point trailing-month edge, not 13 points.
For longer-run figures, a 2024 CNBC summary citing Goldman’s overlap baskets reports approximately 14% annualised since 2013 with a 3-percentage-point annualised advantage over the S&P 500. A 2023 CNBC summary reports the same 14% annualised figure.
| Metric | Primary source figure | Research-supported figure |
|---|---|---|
| YTD return (shared favourites) | 29% | Approximately 2 pts above S&P YTD |
| YTD benchmark (equal-weight S&P 500) | 16% | Not confirmed at this level |
| Annualised return since 2013 | 17% | Approximately 14% |
| Annualised edge over S&P | Implied approximately 14 pts | Approximately 3 percentage points |
| Months outperforming since 2013 | Not stated | Approximately 61% |
The anchor figure: Approximately 14% annualised since 2013, with an approximately 3-percentage-point annualised edge over the S&P 500, supported across multiple independent Goldman summaries.
A consistent 3-percentage-point annualised edge compounded over more than a decade is genuinely meaningful for a simple rules-based basket. But it is a very different decision input than a 13-point single-year gap. The figure you anchor on should be the one that survives independent corroboration, and that is the modest, persistent edge, not the headline number.
The financials signal, and why institutional consensus in one sector deserves attention
The primary source characterises the current financials positioning as historically rare. According to that source, both hedge funds and mutual funds are simultaneously overweight financials, described as only the third instance in Goldman’s historical dataset. Hedge funds reportedly lifted their net financials exposure by more than 300 basis points during Q2 2026, bringing the sector to its heaviest weighting since the period before the global financial crisis. Mutual funds, according to the same source, built their financials tilt to a level that exceeds any prior reading in Goldman data stretching back to at least 2012.
According to the primary source, this is only the third time Goldman’s data has recorded both hedge funds and mutual funds simultaneously overweight financials. This framing has not been independently confirmed in publicly available Goldman materials.
The research layer tells a more measured story. Financials and payment networks show up as a durable, recurring presence in Goldman’s overlap baskets across 2023, 2024, and 2025 summaries. That is well-documented. The superlative language, “third time ever,” “largest since pre-GFC,” is not corroborated outside the primary source.
Large-cap financials stocks both groups reportedly purchased include:
- Capital One Financial
- Corpay
- Fiserv
- Interactive Brokers Group
Whether or not this is literally the third time in history both camps have leaned into financials together, the direction of the signal matters. Two structurally different investor types with different mandates and different time horizons have independently reached the same sector conclusion. Net interest margin dynamics and the Capital One/Discover merger context are plausible institutional drivers, though these represent analytical interpretation rather than explicit Goldman claims. The convergence itself is the data point worth weighing.
Financials sector positioning from multiple institutional vantage points converges on the same directional bet: JPMorgan’s July 2026 note assigned banks an overweight on the basis that S&P 500 financials were already beating Q2 2026 EPS estimates by 13%, providing the kind of near-term earnings catalyst that supports the institutional thesis Goldman’s data identifies from the ownership side.
Where hedge funds and mutual funds still disagree, and what that tells you
The convergence story gets more interesting when you see where it breaks down. In consumer sectors, hedge funds and mutual funds hold positions that are almost perfectly opposite.
| Sector | Hedge fund stance | Mutual fund stance |
|---|---|---|
| Consumer discretionary | Overweight | Underweight |
| Consumer staples | Underweight | Overweight |
| Health care | Overweight | Overweight |
| Financials | Overweight | Overweight |
The divergence reflects the structural difference between the two investor types. Hedge funds operate without long-only benchmark constraints and can express more aggressive cyclical tilts, favouring discretionary over staples. Mutual funds carry benchmark accountability and tend toward more defensive sector positioning, favouring staples over discretionary.
If you are deciding how to weight cyclical versus defensive consumer exposure, this divergence is a real-time read on where professional capital sits on the question of economic resilience. The two largest pools of institutional money are currently staking out opposite answers.
Health care as the quieter area of agreement
Both investor types maintain sizable health care overweights alongside their financials positioning. When two structurally different investor types agree across two sectors simultaneously, the pattern carries more weight than any single-sector call. Health care’s convergence reinforces the shared-favourites methodology’s value: the signal sharpens when it recurs across multiple areas of the market.
The valuation premium and crowding risk that come with the consensus
The shared-favourites basket has a well-documented outperformance record. It also comes with a structural cost that should inform how you size any position based on it.
The primary source reports that the median shared favourite carries a price-to-earnings (P/E) ratio, the stock price divided by per-share earnings, of 25x, a meaningful premium to the 19x recorded for the median S&P 500 constituent. Those specific multiples have not been independently confirmed, but the general finding that shared-favourites stocks trade at elevated valuations relative to the broader market is well-supported across multiple summaries.
That premium tells you institutional consensus has already been priced in to a meaningful degree. The remaining upside depends on underlying business performance, not further multiple expansion from additional institutional buying.
Three crowding risk factors come with the territory:
- Concentrated institutional ownership: Both hedge funds and mutual funds hold the same names, meaning two massive pools of capital are positioned on the same side.
- Amplified selling pressure: If either investor type begins to rotate out, forced selling from one pool can trigger exits from the other, compounding downside.
- Valuation premium: The elevated P/E already reflects existing consensus, leaving less margin for error if earnings disappoint.
Crowding risk signals extend well beyond any single basket: Barclays identified June 2026’s record $150 billion in US equity inflows as a FOMO-driven culmination rather than a fundamental re-rating, with US equity longs and crowded long-dollar positions sitting on top of each other in a reinforcing feedback loop that amplifies the downside scenario the article’s crowding framework describes.
According to the primary source, the median shared favourite trades at approximately 25x earnings versus 19x for the median S&P 500 constituent. These figures have not been independently confirmed but are directionally consistent with the well-documented valuation premium of shared-favourites stocks.
None of this disqualifies the basket. It tells you that crowding and valuation should function as position-sizing inputs, not reasons to dismiss the signal entirely.
This article is for informational purposes only and should not be considered financial advice. Investors should conduct their own research and consult with financial professionals before making investment decisions. Past performance does not guarantee future results.
Using the institutional overlap as one input, not a buy list
The shared-favourites basket has a defensible long-run track record: approximately 14% annualised since 2013, with an approximately 3-percentage-point edge over the S&P 500. That survives even the more conservative interpretation of the data. It also comes packaged with elevated valuations, crowding risk, and quarterly data that may lag actual institutional positioning, since Goldman’s reports capture holdings as reported at quarter-end, reflecting where institutional money was rather than where it is moving.
Mastercard and Visa are the strongest signals in the basket. They recur across virtually every version of the overlap list since at least 2023, pointing to persistent institutional conviction rather than quarterly noise.
Three practical steps for using the shared-favourites basket as a research input:
- Identify recurring names across multiple quarters. Stocks that appear in the overlap basket across multiple reporting periods carry a stronger conviction signal than newly rotated additions. Persistence is the filter.
- Assess individual valuation and crowding metrics before adding to a portfolio. The basket tells you where institutional money has converged; your own analysis should tell you whether the entry price still offers adequate risk-adjusted opportunity.
- Account for the 13F quarterly lag. Goldman’s data is backward-looking by design. By the time you read the report, the positioning may have already shifted. Treat it as a directional indicator, not a real-time signal.
The distinction between holdings versus trades is not semantic: Morgan Stanley’s tracking of 62 Australian active equity funds found that mechanically copying top overweight positions returned approximately -21%, while following position changes returned approximately +17%, a gap driven entirely by the difference between where institutional conviction was and where it is moving.
The institutional overlap is a research filter that narrows the investable universe. It is not a ready-made portfolio. The reader who anchors on the long-run 3-percentage-point edge rather than the 13-point single-year headline, and who treats recurring names as the strongest signals, is using this data the way it works best.