Oil Shock, Chipflation and the Fed’s 2026 Rate Hike Case
31 mins ago
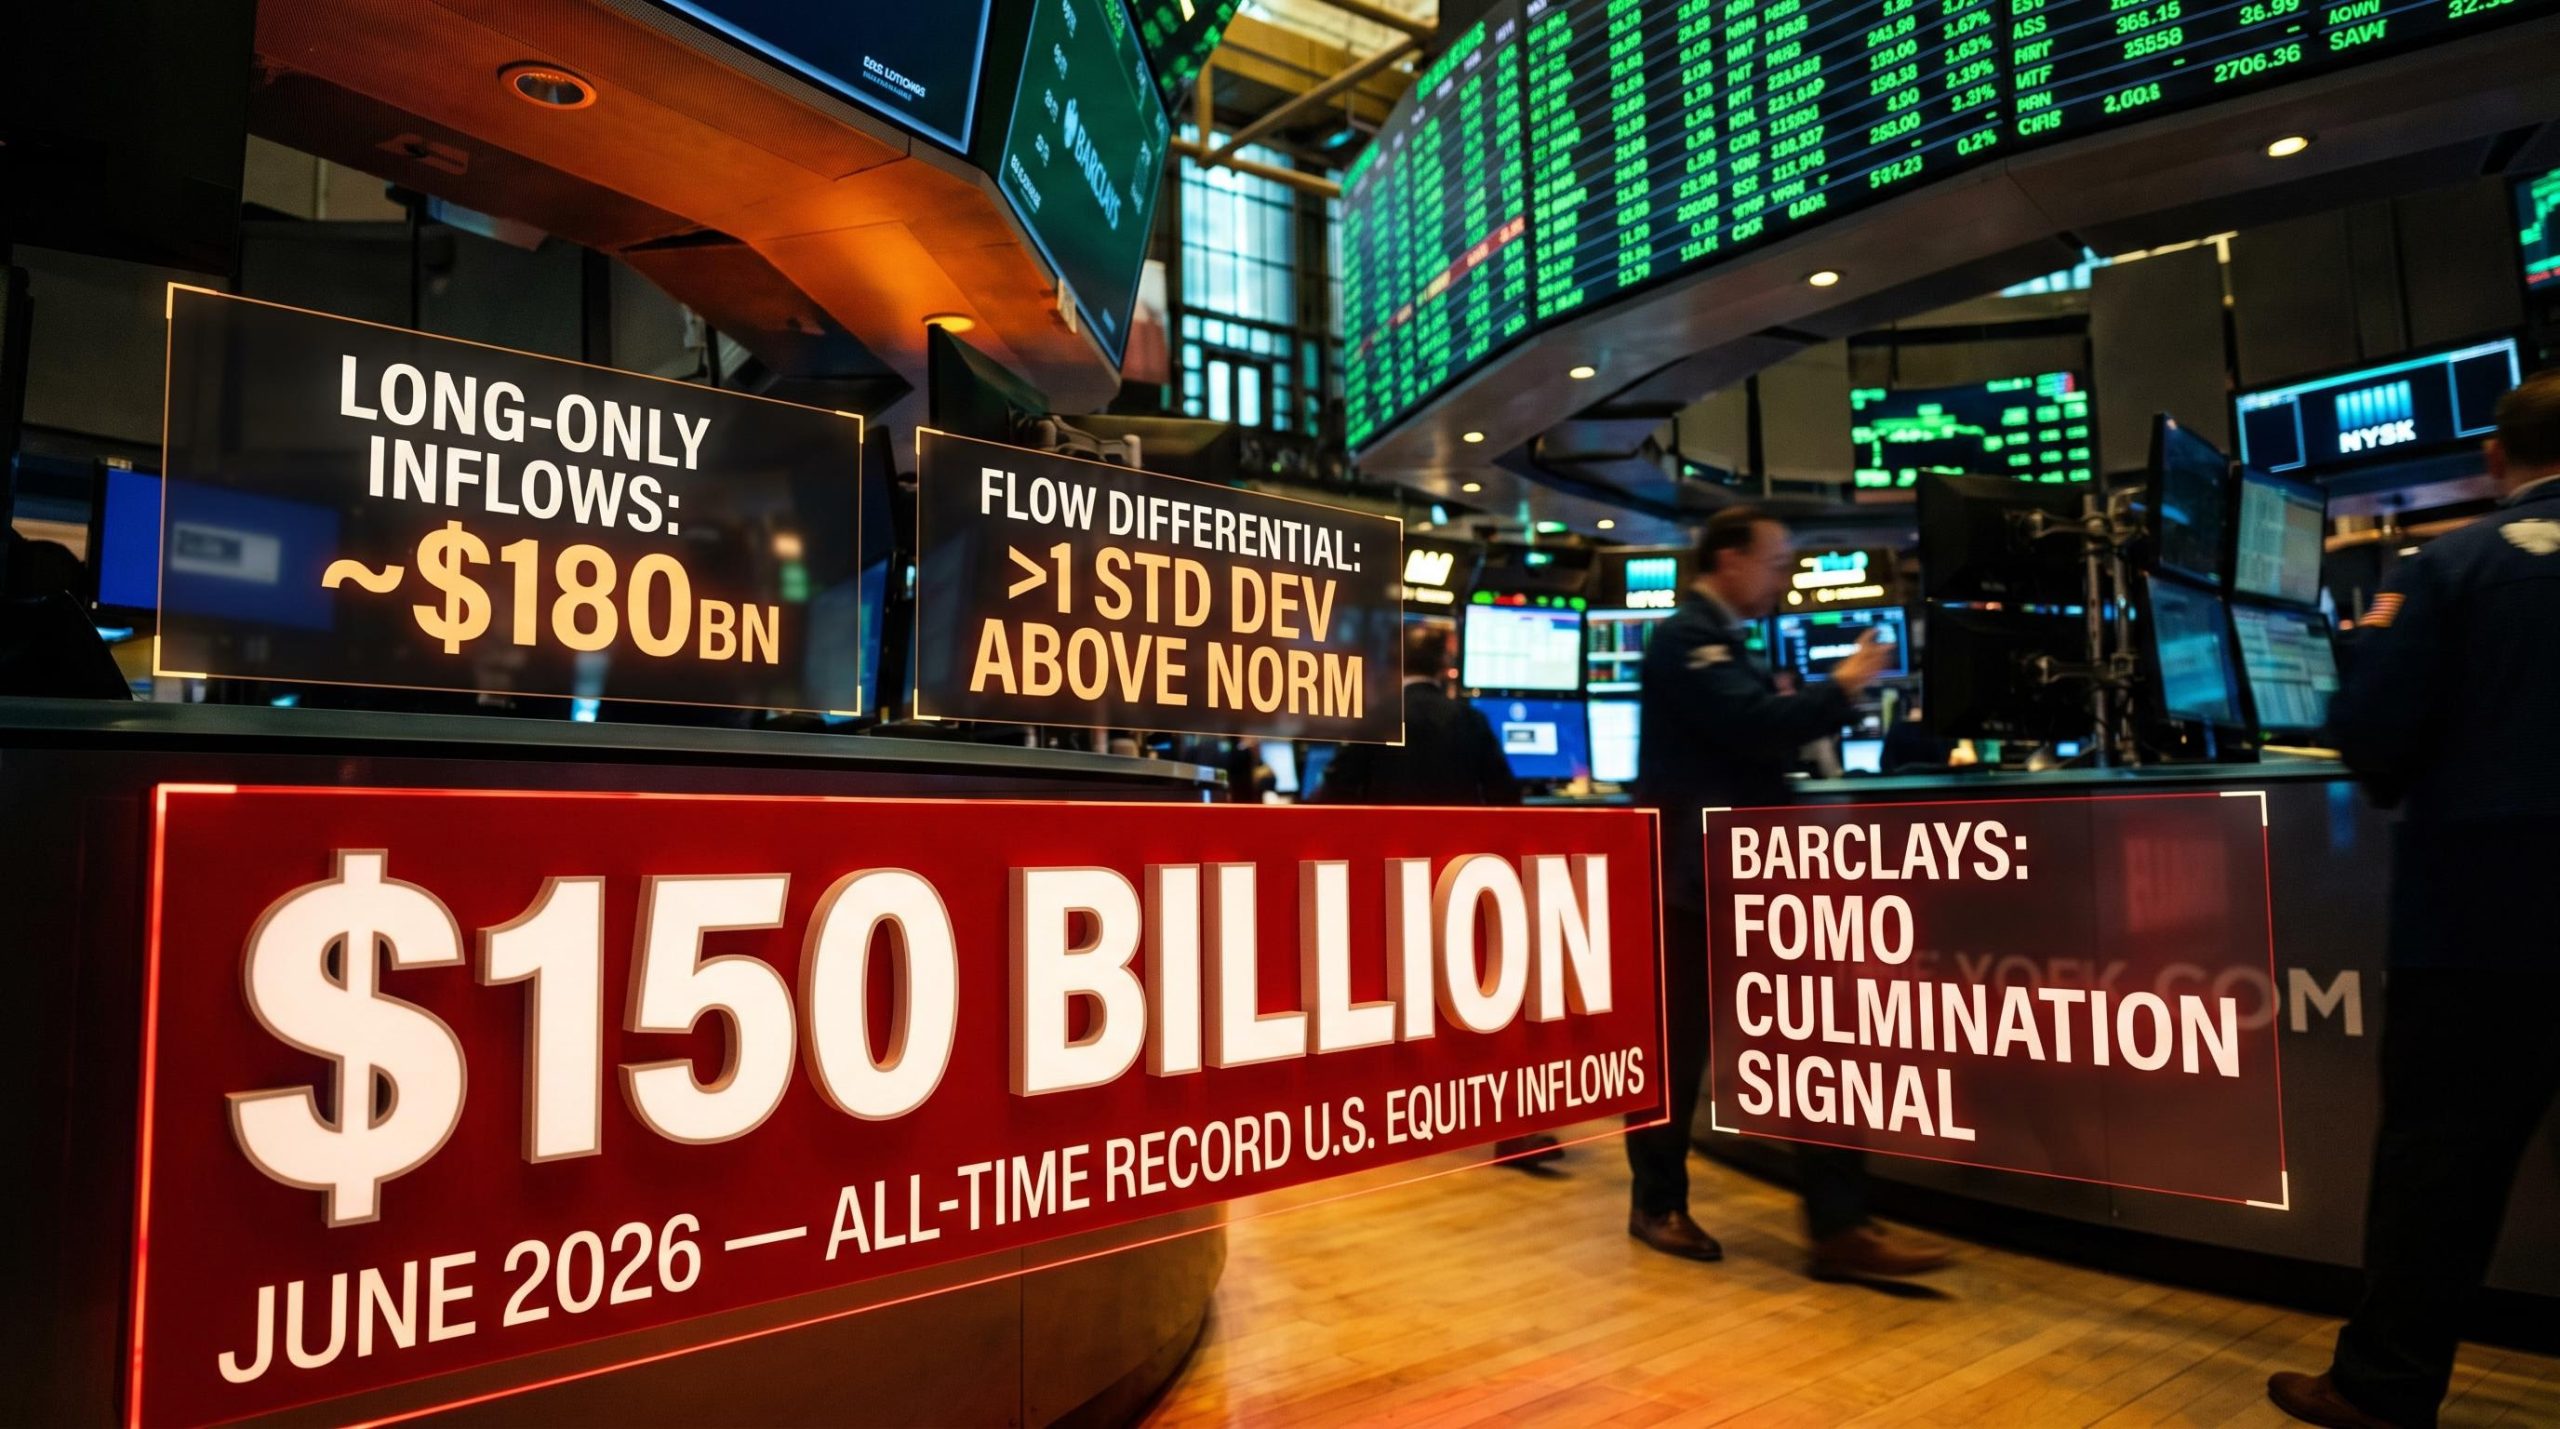
Investors poured more money into U.S. equities in June than in any single month on record. The $150 billion figure would be easy to read as a vote of confidence. Barclays argues it signals something closer to the opposite.
In a client note published 1 July 2026, analyst Emmanuel Cau framed the record inflows not as validation of U.S. fundamentals but as the culmination of a fear-of-missing-out positioning cycle that has left markets structurally fragile. Cau is not calling a top. He is describing a setup in which the upside is capped by the sheer volume of capital that has already arrived, and the downside is amplified by precisely that crowding.
Here is a clear framework for reading what record U.S. equity inflows actually signal, where the specific vulnerabilities sit in the current setup, and what to watch over the next several weeks as earnings season begins.
The headline is striking enough on its own.
June 2026 saw $150 billion enter U.S. equities, a figure that surpassed every prior monthly inflow in recorded history.
Morningstar U.S. fund flow data for 2025 recorded December’s $149 billion as the highest single-month inflow figure of that year, making June 2026’s $150 billion the first time that threshold has been surpassed in the subsequent period.
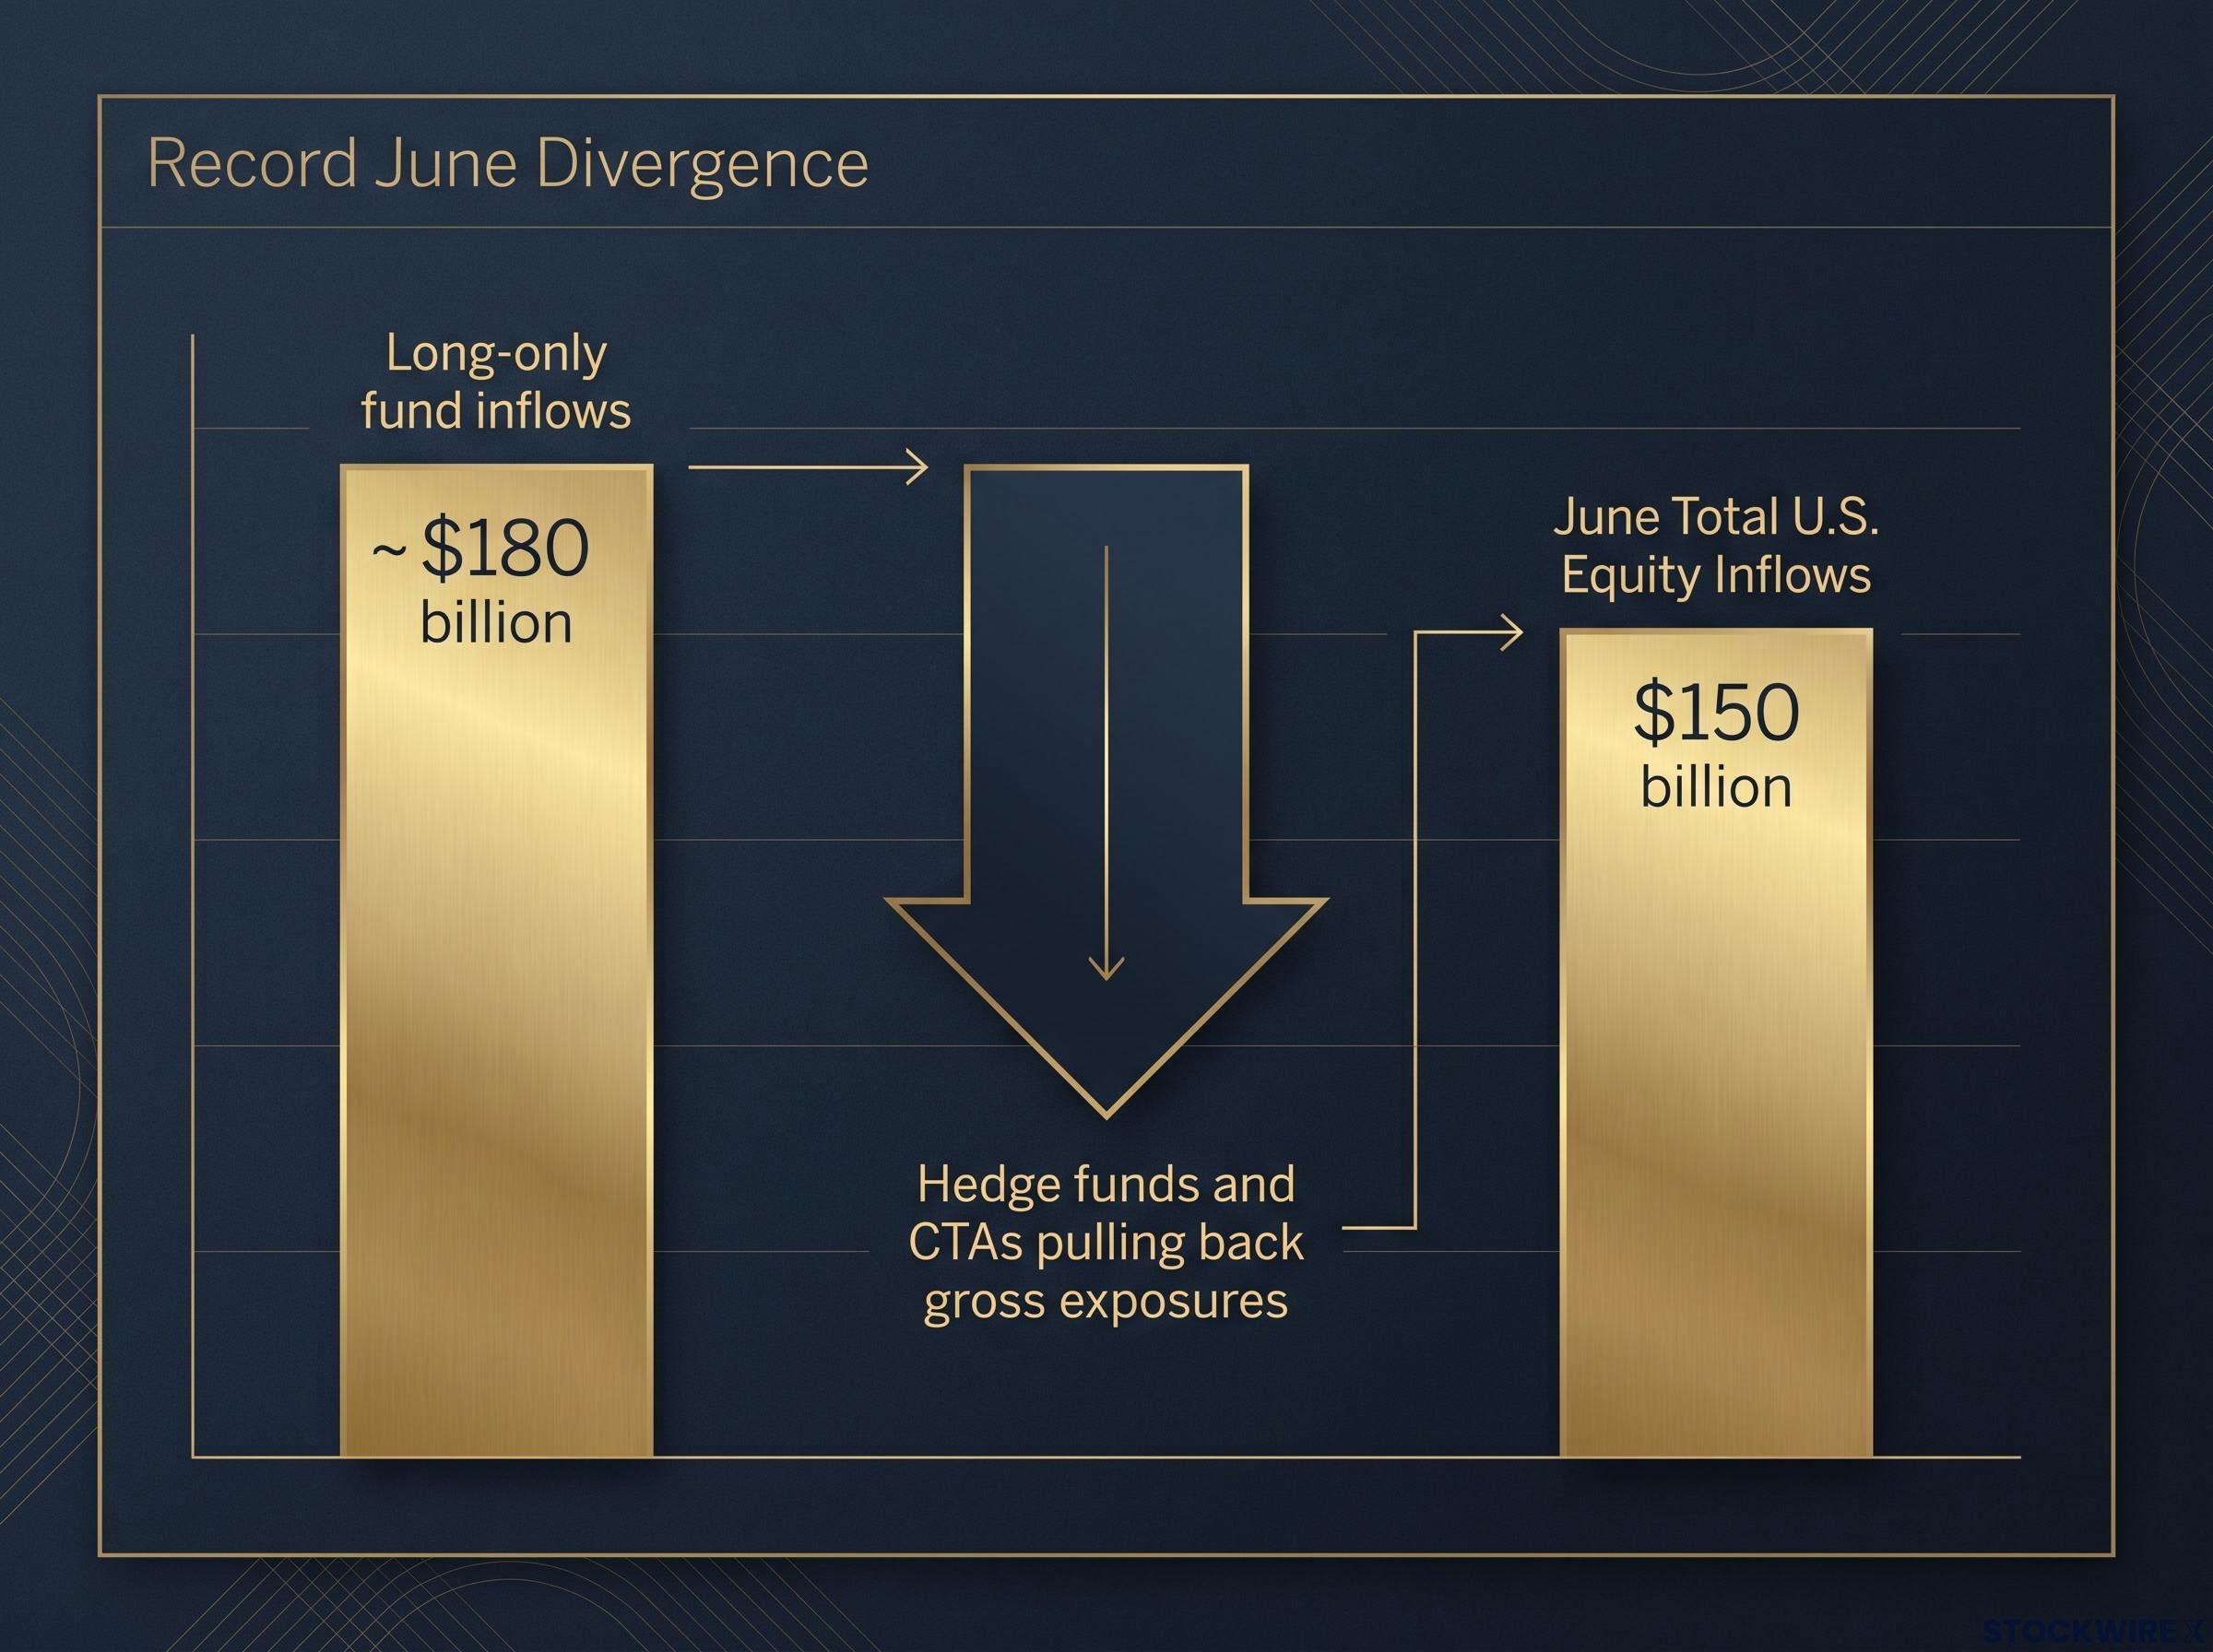
But the composition of that number matters more than its size. The three data points that define this record:
The divergence tells you something specific. The rally’s most recent leg was not driven by nimble, leveraged players positioning for further upside. It was driven by benchmarked, institutional long-only money, the kind of capital that follows mandates and performance benchmarks rather than conviction trades. That capital is sticky on the way in but subject to rapid redemption pressure if sentiment turns. It cannot exit quickly, which concentrates reversal risk in a single category of holder that already has.
Cau’s note uses a specific term: FOMO. Fear of missing out. That is not editorial colour. It is an analytical distinction with mechanical consequences.
FOMO-driven flows chase returns that have already happened. They accelerate into strength, crowd into the same positions, and reverse without needing a clear fundamental trigger. The catalyst for the exit is not bad news; it is the realisation that everyone who was going to buy has already bought.
The May 2026 BofA Fund Manager Survey captured the same dynamic a month earlier, recording record equity overweights alongside cash levels below the 4.0% sell-signal threshold, a configuration that institutional strategists have historically associated with late-cycle vulnerability rather than momentum continuation.
Flows driven by genuine fundamental re-assessment behave differently. They anchor to earnings revisions, valuation shifts, or structural changes in the economy. They are more durable because they are tethered to something that can be measured and updated.
Barclays frames the record June inflows as a culmination signal, not a momentum continuation signal. The FOMO phase has produced its largest-ever output. That is precisely the condition under which a sharp reversal becomes possible without any change in the underlying earnings story, because FOMO flows do not need a fundamental reason to leave. They just need to sense the crowd thinning.
This is not a single-asset positioning story. Capital is stacked in two overlapping trades simultaneously, and their interaction compounds the risk.
| Positioning Metric | Current Status |
|---|---|
| U.S. equity flows vs. rest-of-world differential | Stretched beyond one standard deviation above historical norms |
| USD positioning | Rebuilt to the prior peak last seen around “Liberation Day” |
| Rest-of-world equity flows | Largely for sale in June |
Dollar debasement fears receded on the back of solid U.S. growth and reduced anxieties around Federal Reserve independence, allowing investors to rebuild their long-dollar exposure until it matched the prior high reached around “Liberation Day”. Solid U.S. growth and reduced worries about Federal Reserve independence have given investors confidence to rebuild crowded long-dollar positions alongside their crowded long-equity positions.
The dollar positioning mechanics behind this rebuild trace directly to the Fed’s June 2026 guidance shift: with core PCE holding at 3.4% year-over-year and the FOMC stripping out language that had left room for earlier cuts, investors repriced the rate timeline in a way that made rebuilding long-dollar exposure the path of least resistance.
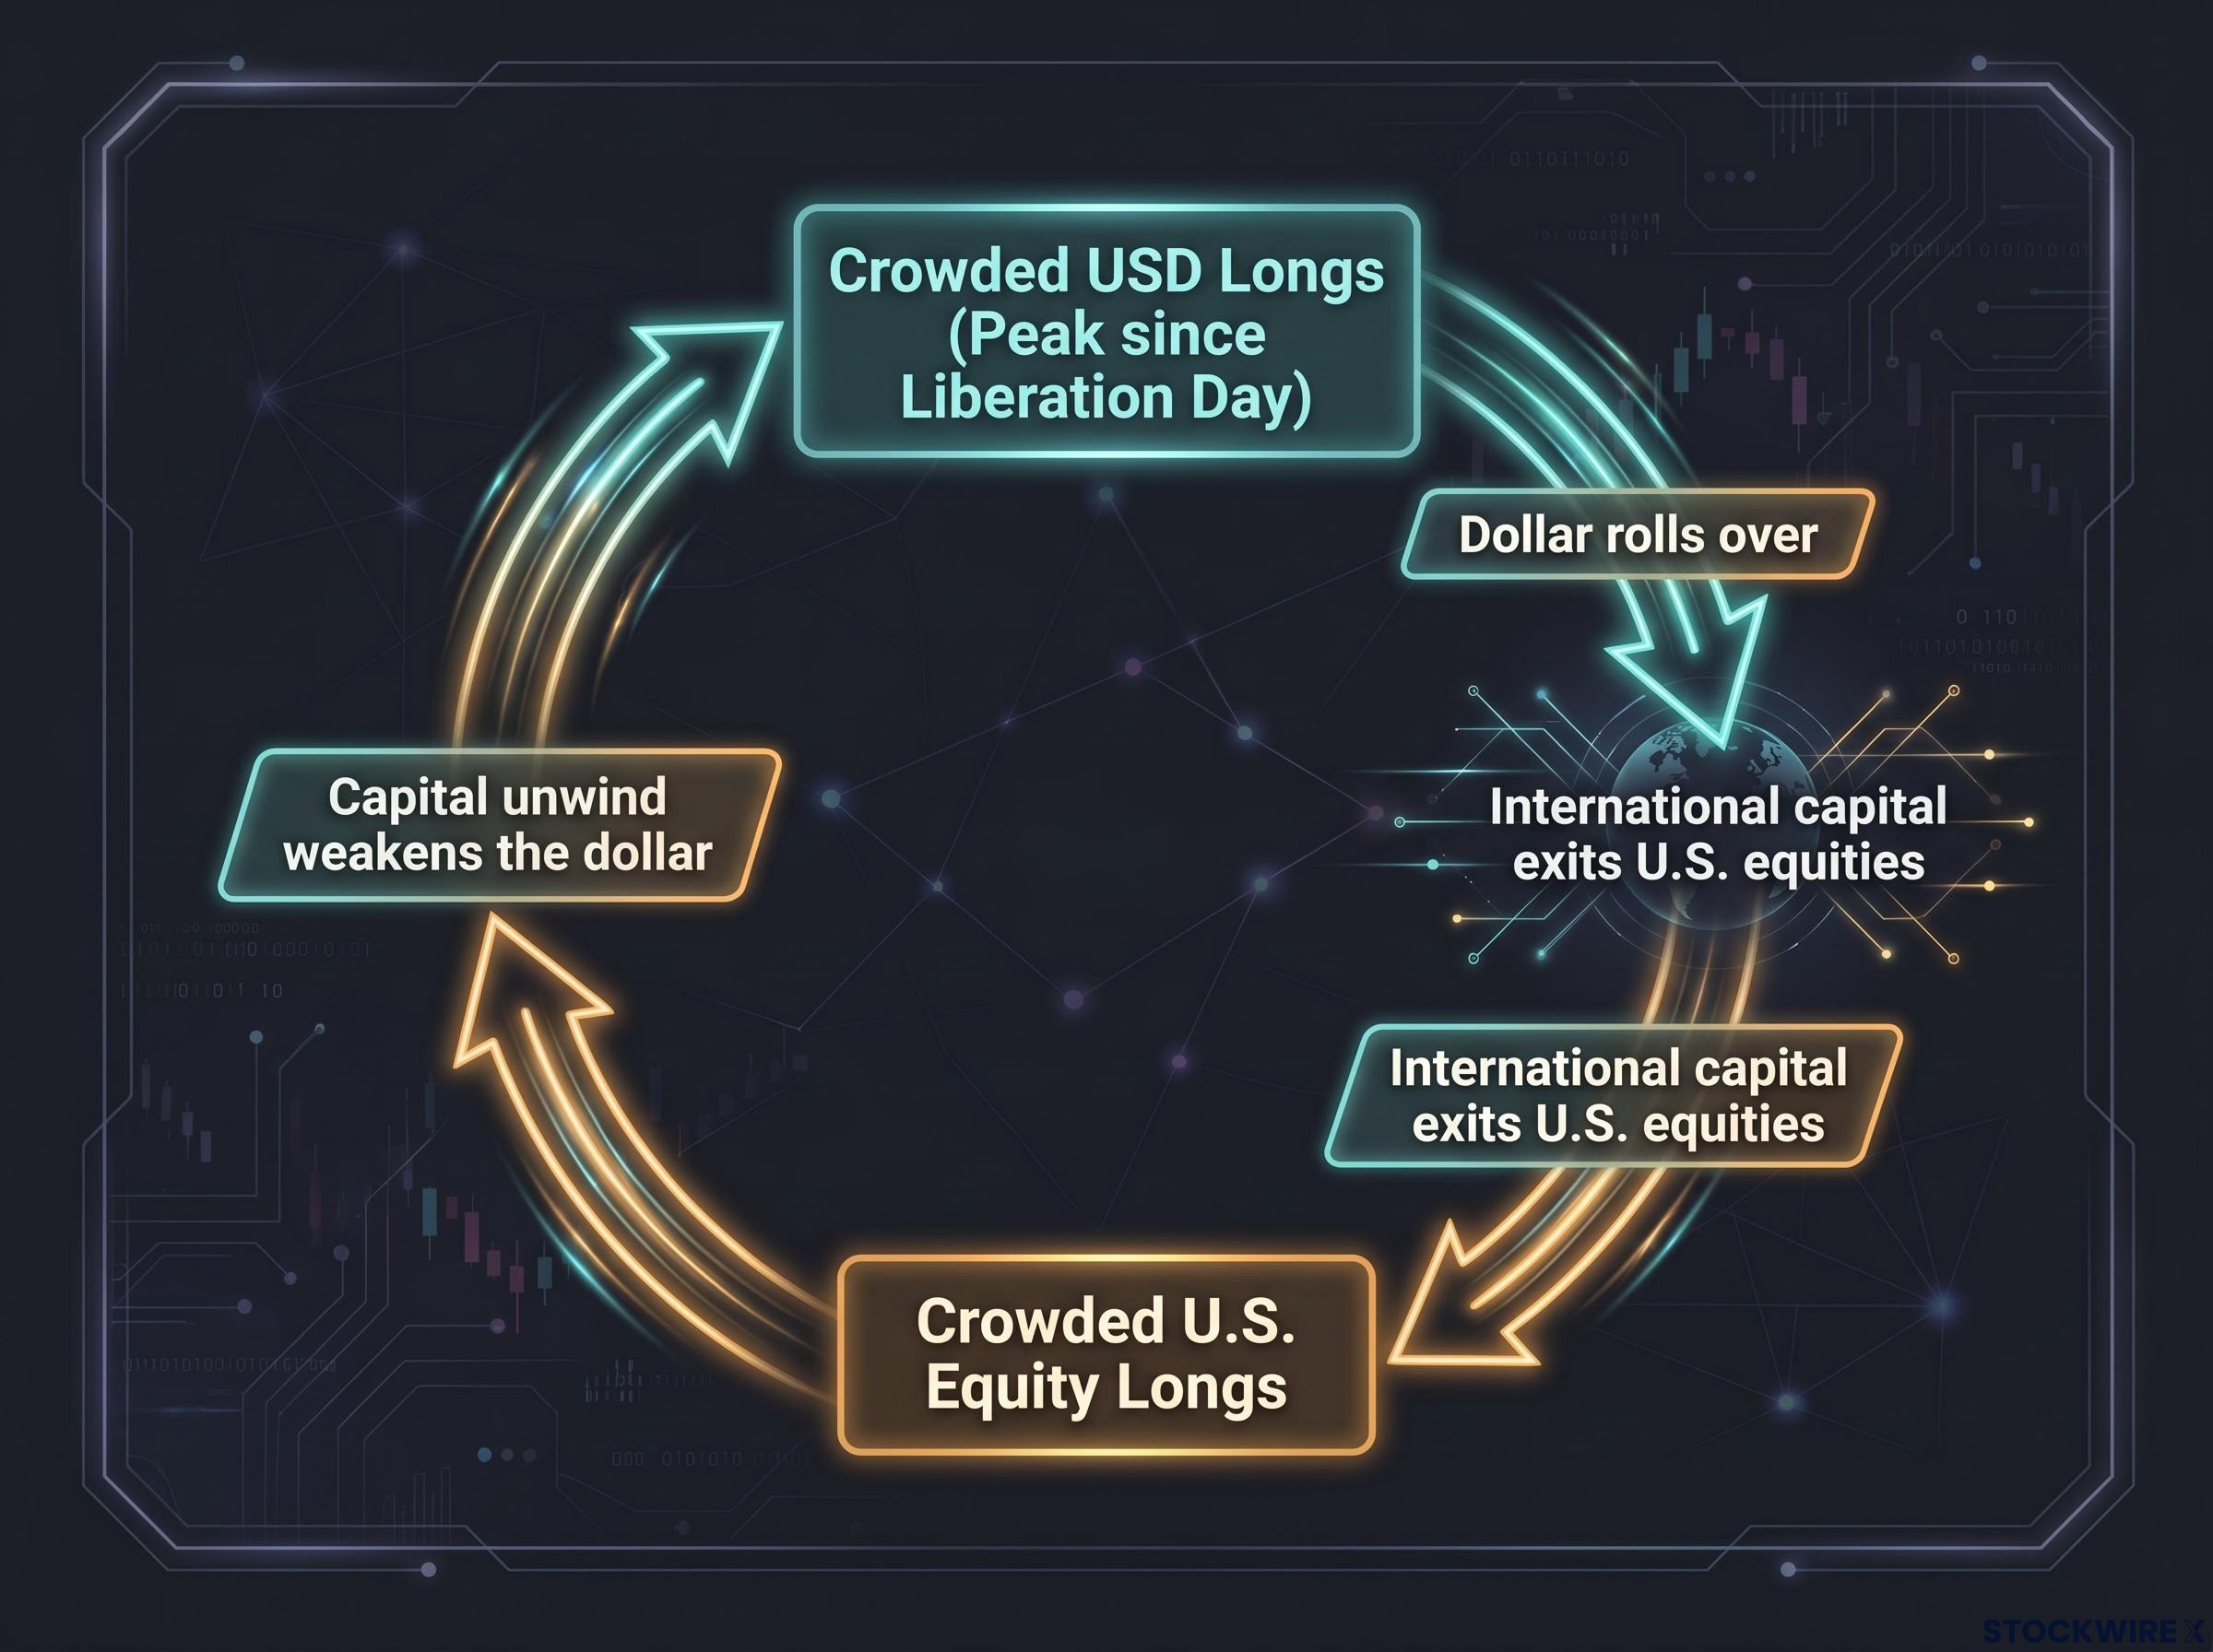
The problem is that crowded equity longs and crowded dollar longs sitting on top of each other create a reinforcing feedback loop. A reversal in either position mechanically increases selling pressure in the other. If the dollar rolls over, it pressures international capital to exit U.S. equities. If U.S. equity flows reverse, the same capital unwind weakens the dollar. That doubling of exit pressure is what separates this setup from a routine period of U.S. outperformance.
A flow differential, in this context, measures the gap between how much capital flows into U.S. equities versus how much flows into all other equity markets globally. When the differential is wide, it means investors are disproportionately choosing U.S. stocks over everything else. When it is narrow, capital allocation is more balanced.
Here is why the statistical threshold matters:
For a U.S.-focused investor, this means the relative-performance advantage U.S. equities have held over international markets is likely closer to its peak than its trough. Other 2026 institutional outlooks reflect a growing willingness to consider European and international equities as the flow differential normalises.
Global positioning extremes across other major indices reinforce the mean-reversion case: Citi’s 30 June 2026 audit identified the Hang Seng short as the most extreme bearish trade globally, Russell 2000 longs as a crowded consensus trade with minimal embedded profit cushion, and continental European equities facing simultaneous long unwinds and new short builds, a pattern consistent with capital rotating out of the U.S. and into markets where positioning is less stretched.
Three separate risk factors are converging right now, not as a hypothetical future scenario but as a present condition.
Barclays identifies this as a period where multiple risk factors peak simultaneously: maximum crowding, minimum mechanical demand, and reduced liquidity.
Corporate buybacks are one of the most reliable structural buyers in U.S. equity markets. Their temporary absence removes a support pillar that normally absorbs selling pressure during periods of volatility. Combined with thinner summer volumes, the result is a market where a modest sentiment shift can produce a disproportionate price reaction.
If you hold crowded U.S. equity positions right now, the structural buyer that normally cushions drawdowns is absent, and the liquidity environment that normally dampens price moves is at its seasonal weakest. That is a specific, time-bound vulnerability, not a permanent condition, but one that concentrates risk in the weeks ahead.
Cau’s framework is not a sell signal. It is an asymmetric risk description. Strong earnings-per-share (EPS) momentum, especially in AI-linked sectors, continues to underpin the bull case on the upside. The downside is amplified by the crowding, flow extremes, and technical factors already outlined.
The three specific signals to monitor over the coming weeks:
The relative-versus-absolute distinction matters here. Barclays’ scenario does not require a U.S. market collapse. The more probable manifestation is gradual outperformance by European and international equities as the flow differential normalises. The margin for error in U.S. equity positioning has narrowed: earnings need to deliver, flows need to hold, and the dollar needs to stay bid. Right now, all three conditions are required simultaneously to sustain the current level.
This article is for informational purposes only and should not be considered financial advice. Investors should conduct their own research and consult with financial professionals before making investment decisions. These statements are speculative and subject to change based on market developments and company performance.
June’s $150 billion inflow is simultaneously evidence of U.S. equity market dominance and evidence of its fragility. The same crowding that demonstrates strength is what amplifies downside risk. Barclays is not calling a top. It is describing a market where the upside is capped by the fact that so much buying has already happened, and the downside is amplified by that same fact.
The most proximate test arrives with Q2 2026 earnings season. If EPS momentum proves strong enough to absorb flow normalisation, the record will look like a milestone. If guidance disappoints into a market where the marginal buyer has already bought, the buybacks are blacked out, and the liquidity is thin, the same record will look like the moment the asymmetry became undeniable.
For investors wanting to understand an additional structural headwind forming alongside the positioning risk, our deep-dive into AI IPO supply dynamics examines how Alphabet’s $80 billion capital programme has already flipped U.S. net equity supply from negative to positive, adding an issuance-side pressure the Barclays crowding framework does not address.
US equity inflows measure the total capital flowing into US stock markets within a given period. When inflows reach extremes, as they did in June 2026 with a record $150 billion, they can signal crowded positioning where the majority of potential buyers have already committed capital, leaving the market more vulnerable to sharp reversals.
Barclays analyst Emmanuel Cau describes it as FOMO-driven because the flows chased returns that had already happened rather than responding to new fundamental data; FOMO flows accelerate into strength, crowd into the same positions, and can reverse without any negative earnings catalyst, simply because everyone who was going to buy has already bought.
A buyback blackout window is the period before a company reports earnings when it is prohibited from repurchasing its own shares; with Q2 2026 earnings season beginning, corporate buybacks, one of the most consistent and non-discretionary sources of equity demand, are suspended simultaneously with record crowded positioning and reduced summer liquidity, creating a narrow window of elevated vulnerability.
When the gap between US equity inflows and flows into all other global equity markets exceeds one standard deviation above its historical norm, it has historically been associated with elevated mean-reversion risk, meaning the differential tends to close over subsequent months, often through international equities outperforming rather than through a US market crash.
Barclays identifies three signals: whether July flow data slows or reverses (suggesting FOMO exhaustion), whether USD positioning begins to roll over (confirming one side of the dual crowded trade is unwinding), and whether Q2 earnings guidance quality clears the higher bar that stretched positioning demands, since cautious forward guidance could have an outsized negative impact in this environment.