The United States government carries a gross debt burden of approximately $40.05 trillion. Servicing that debt now costs $1.1 trillion per year in net interest, a figure that has not been seen before in American fiscal history. Those two figures frame every conversation about Treasury markets right now, but they do not answer the question that matters most: who is actually writing the cheque?
The headline debt number gets the attention. The buyer base underneath it does not. Yet a structural rotation is underway in who holds U.S. government debt, and it changes the risk calculus for anyone with exposure to interest rates, equities, or credit. The foreign buyers who anchored the Treasury market for two decades now hold a shrinking share of a growing pie. Domestic commercial banks have stepped into the gap, pushing their holdings to a record $4.8 trillion. The motivations, the price sensitivities, and the stress tolerances of these two buyer groups are fundamentally different.
Here is what the ownership data actually tells you about Treasury market risk in this cycle: who holds the debt now, why the rotation happened, what it means for market stability, and which signals will warn you if the buyer base comes under pressure.
A $40 trillion problem with a $1.1 trillion annual price tag
The scale of U.S. government indebtedness is no longer a projection. It is arithmetic.
- Gross national debt: approximately $40.05 trillion as of mid-August 2026
- Debt held by the public: approximately $32.1-$32.3 trillion
- Marketable Treasury securities: approximately $31 trillion
- Debt-to-GDP ratio: 122.6% (Q1 2026, Federal Reserve data)
Intragovernmental holdings, primarily Social Security trust funds and similar accounts, make up the remaining $7.73 trillion. But the investable universe, the Treasuries that foreign governments, banks, funds, and households actually buy and sell, is the $31 trillion in marketable securities.
The debt-to-GDP ratio of 122.6% anchors the headline conversation, but the fiscal health metrics that bond markets and analysts actually rely on, particularly the interest-to-revenue ratio currently running in the 17-19% range, produce a considerably more nuanced picture of sovereign affordability than the raw ratio suggests.
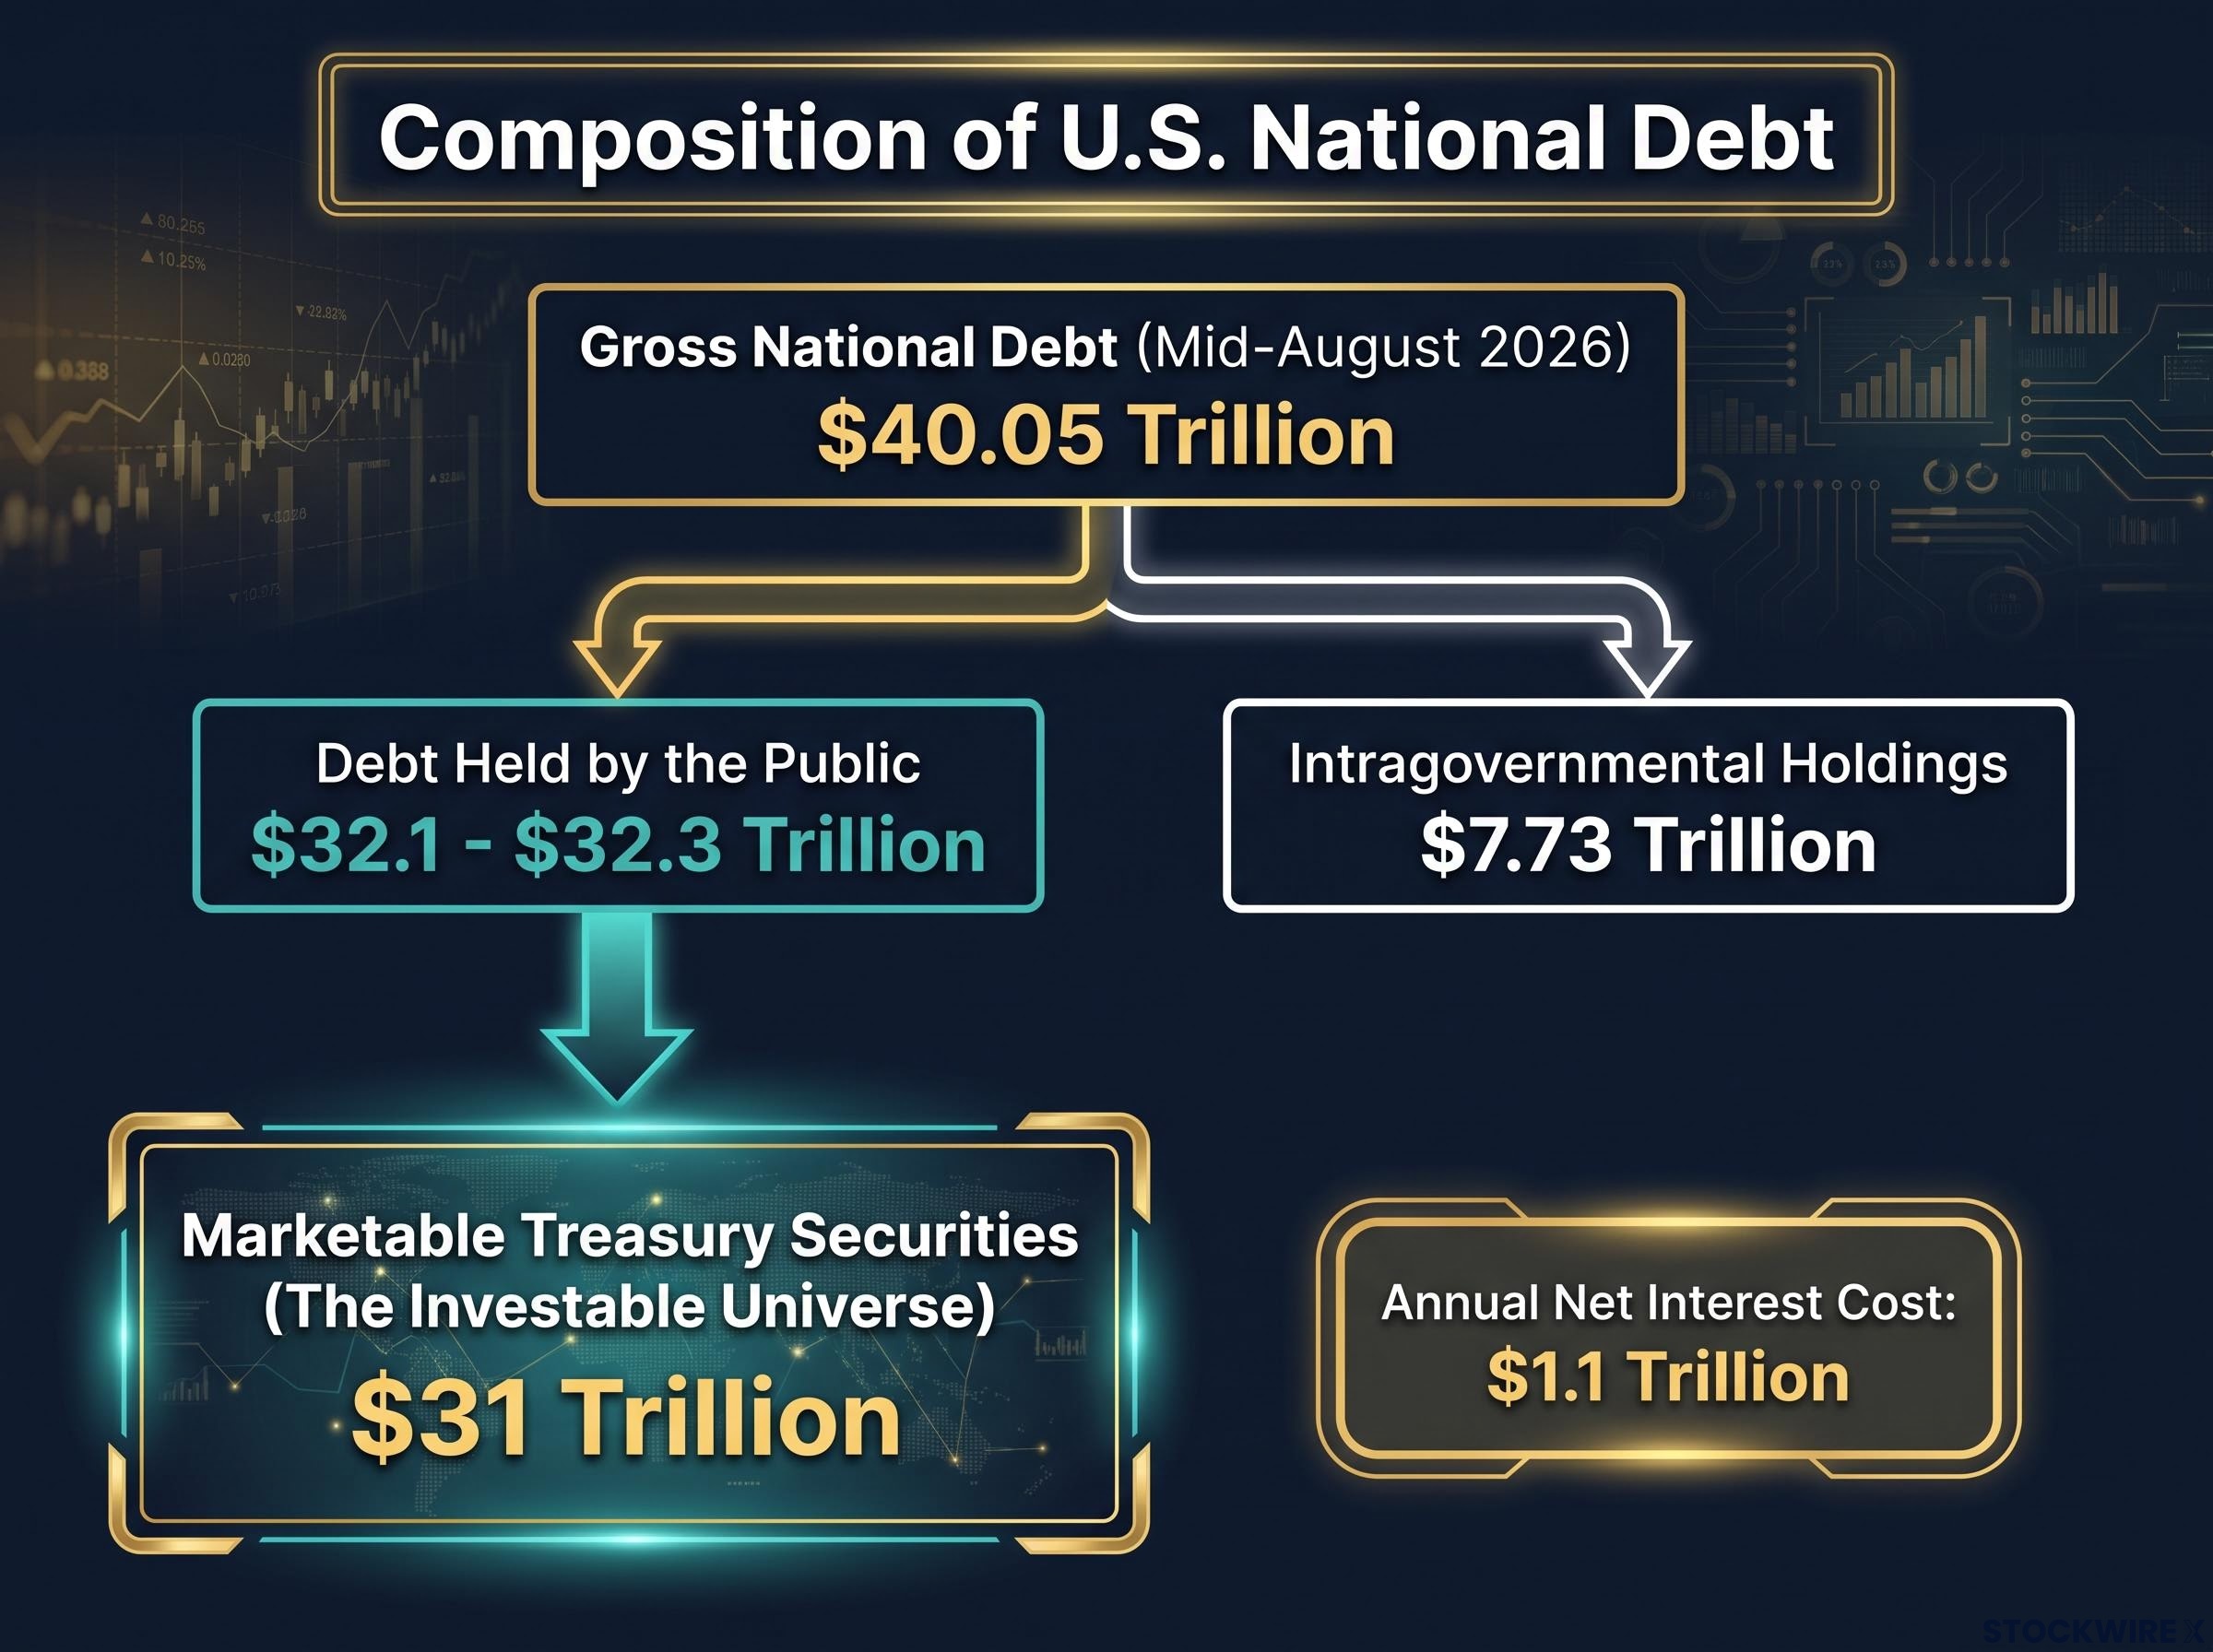
$1.1 trillion in annual net interest costs. That is the record the U.S. government set this year, reflecting what happens when a massive stock of low-rate debt rolls into a higher-rate environment. This figure is consistent with independent analyses from Yardeni Research and Congressional Budget Office projections.
That interest bill is not an abstraction. It represents a structural floor of Treasury issuance that must be absorbed by the market every year regardless of fiscal policy decisions. Which is precisely why the question of who shows up to buy matters more now than at any point in recent decades.
When big ASX news breaks, our subscribers know first
How foreign buyers went from anchor to plateau
For the better part of two decades, foreign central banks and reserve managers were the structural backstop of the Treasury market. They bought consistently, held patiently, and were largely insensitive to price. That era has not ended, but it has stalled.
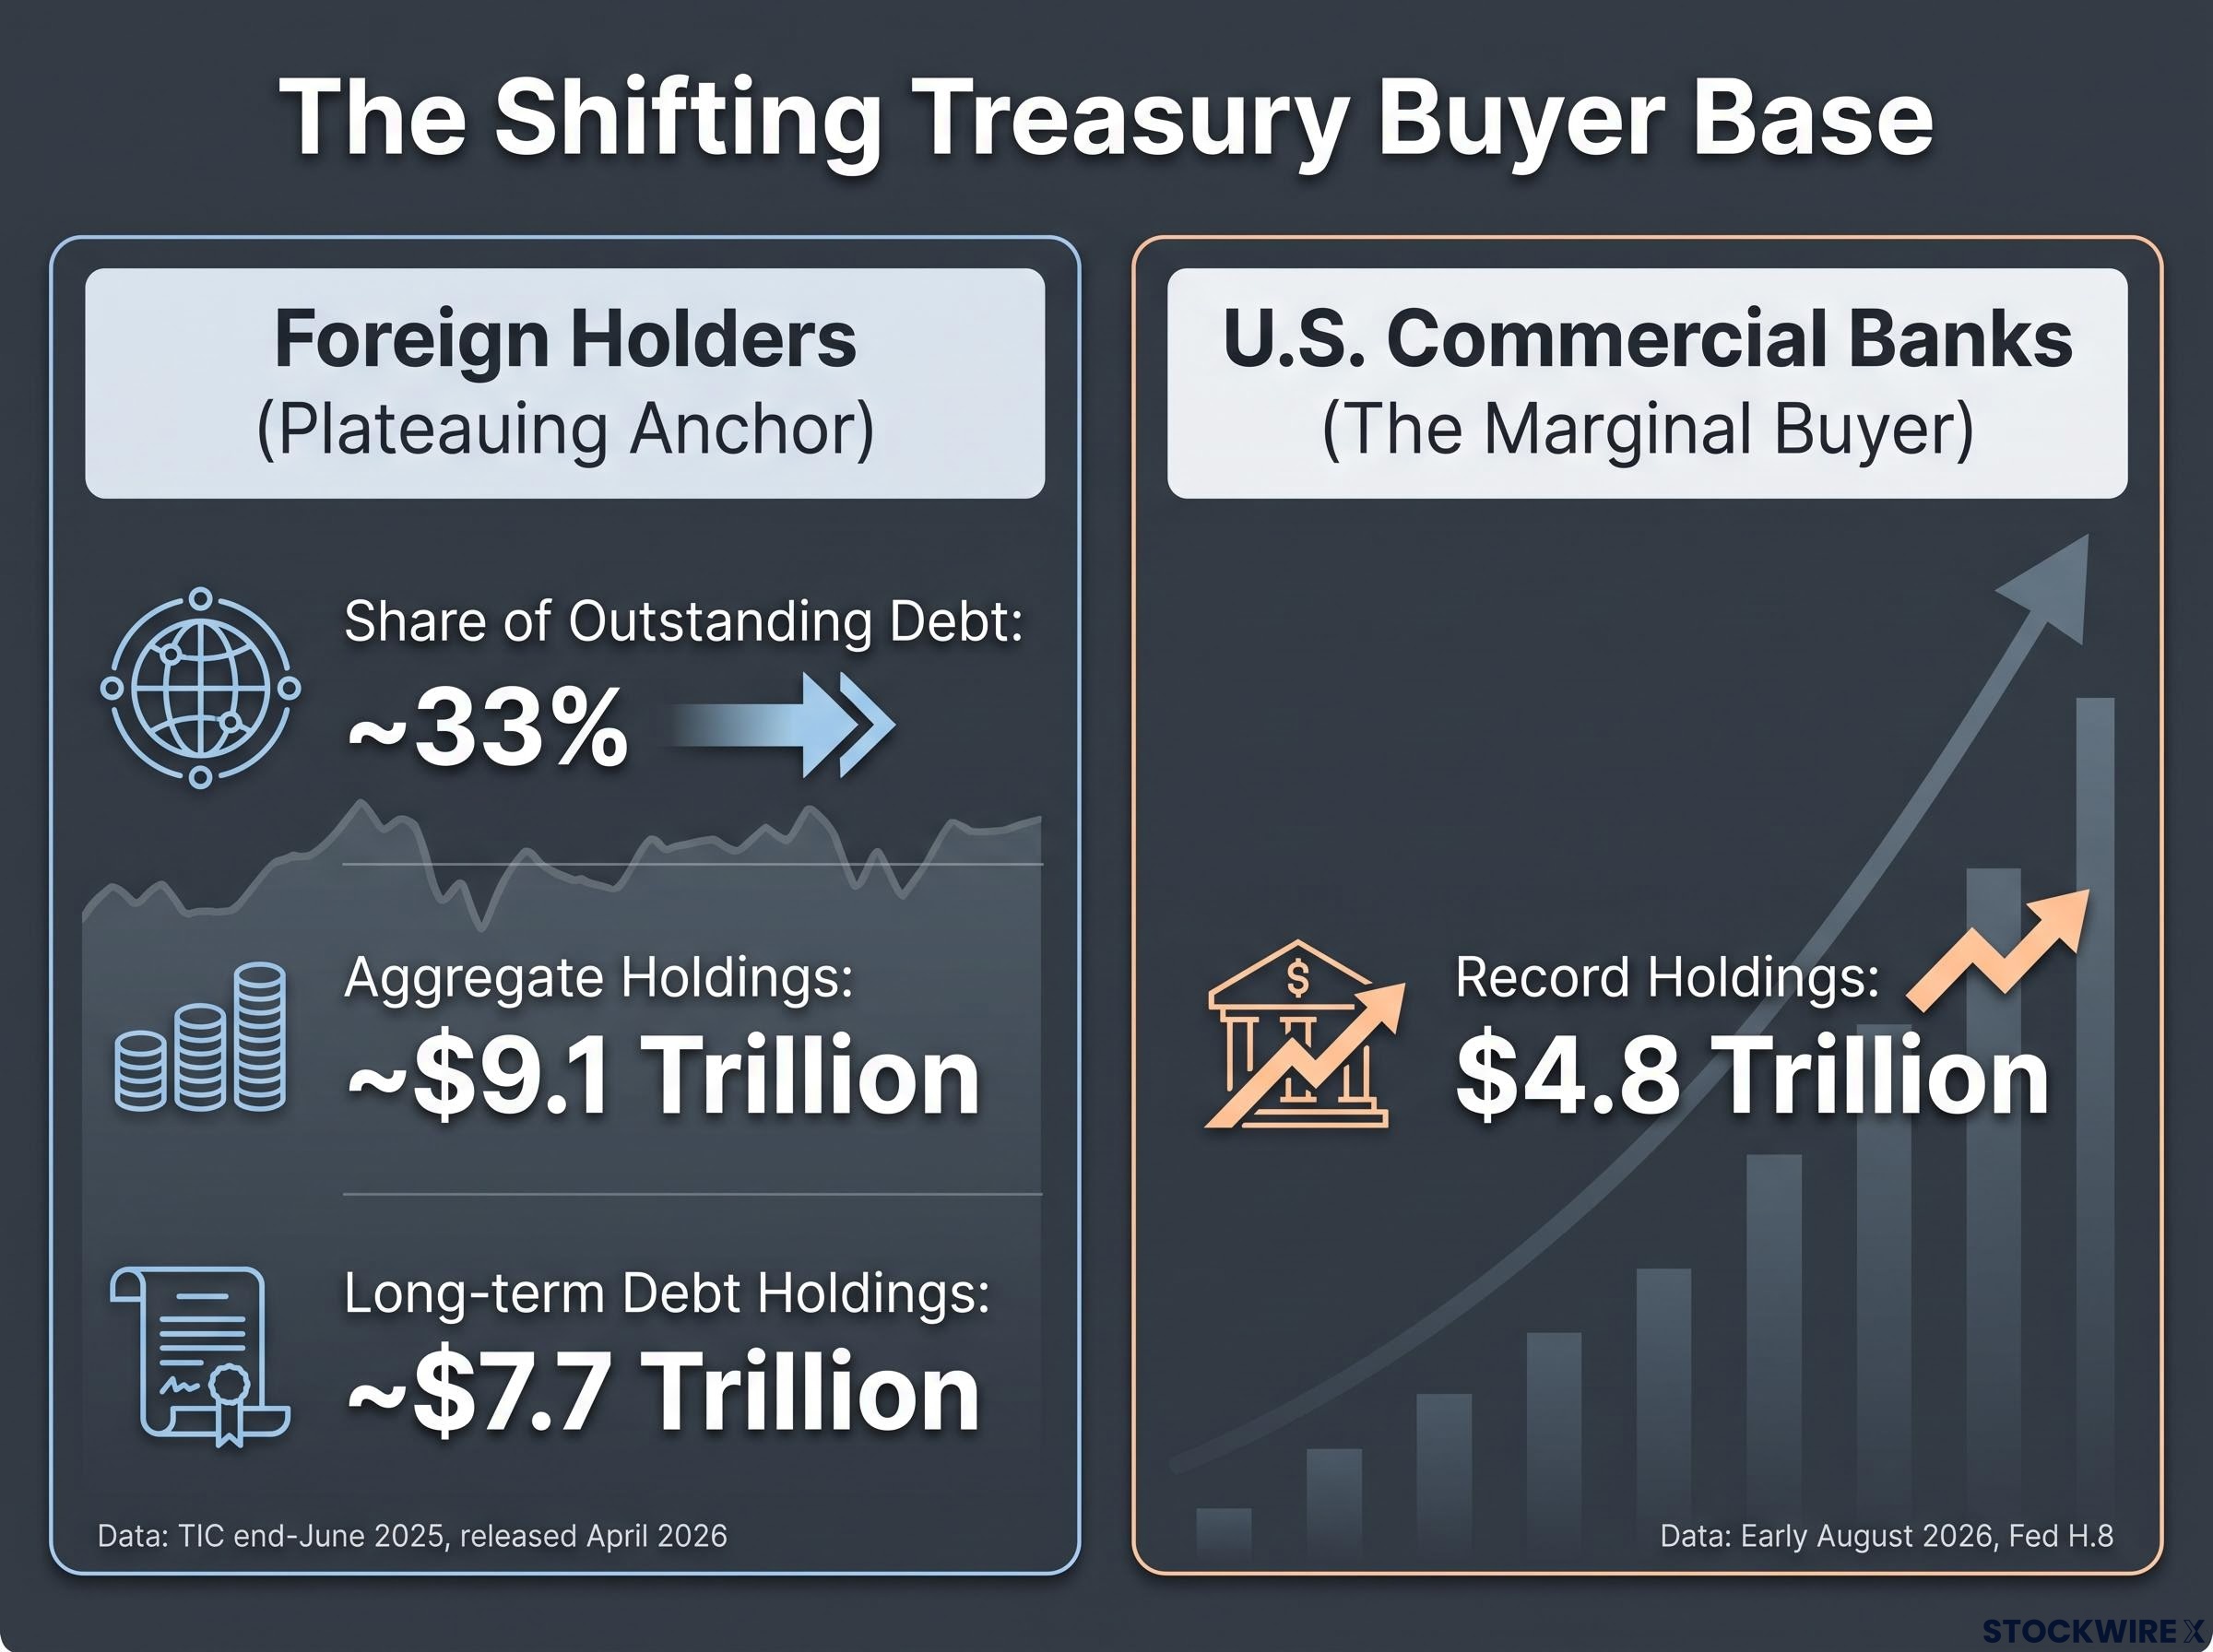
The latest Treasury International Capital (TIC) annual survey, covering end-June 2025 and released in April 2026, places aggregate foreign Treasury holdings near $9.1 trillion across all instruments, with long-term debt holdings alone totalling approximately $7.7 trillion. In dollar terms, that is near record levels. As a share of outstanding debt, it has declined to approximately 33%, down from historical peaks.
The distinction matters. Foreign holders are still enormous buyers in absolute terms. They are no longer expanding in line with supply growth. Three structural forces explain the plateau:
- Geopolitical diversification, accelerated by the post-Russia sanctions environment, which raised the perceived political risk of holding dollar-denominated assets
- Elevated currency-hedging costs, which compress or entirely eliminate the yield advantage of Treasuries for yen-based and euro-based investors
- Reserve asset diversification, with sovereign wealth funds and central banks shifting allocations toward gold and alternative currencies
Reserve currency risk operates on a longer timeline than yield volatility, but the two are not independent: the OMFIF Global Public Investor 2026 survey marks the first time more central banks plan to reduce rather than increase dollar allocations over the next decade, adding a qualitative layer to the quantitative plateau visible in TIC data.
Why reserve managers are looking elsewhere
The freezing of Russian central bank reserves in 2022 was a turning point. For reserve managers in China, the Gulf states, and parts of Asia, it demonstrated that dollar assets carry a form of political risk that had previously been treated as negligible. Diversification did not begin overnight, but the trend accelerated measurably.
Currency-hedging mechanics compound the problem. A Japanese investor buying a 10-year Treasury must hedge yen exposure to lock in returns, and when the cost of that hedge exceeds the yield pickup, the trade produces a negative return in home-currency terms. Euro-based investors face a similar dynamic.
The result is visible in central bank reserve surveys: gold holdings among reserve managers have risen meaningfully over the past three years, and the dollar’s share of allocated global reserves, while still dominant, has trended lower.
For a U.S. investor, this is not theoretical. It is already in the data. The marginal demand responsibility is shifting onto domestic institutions that behave very differently from the reserve managers they are partially replacing.
Who stepped in, and why domestic banks are now holding a record $4.8 trillion
The domestic rotation has a clear leader.
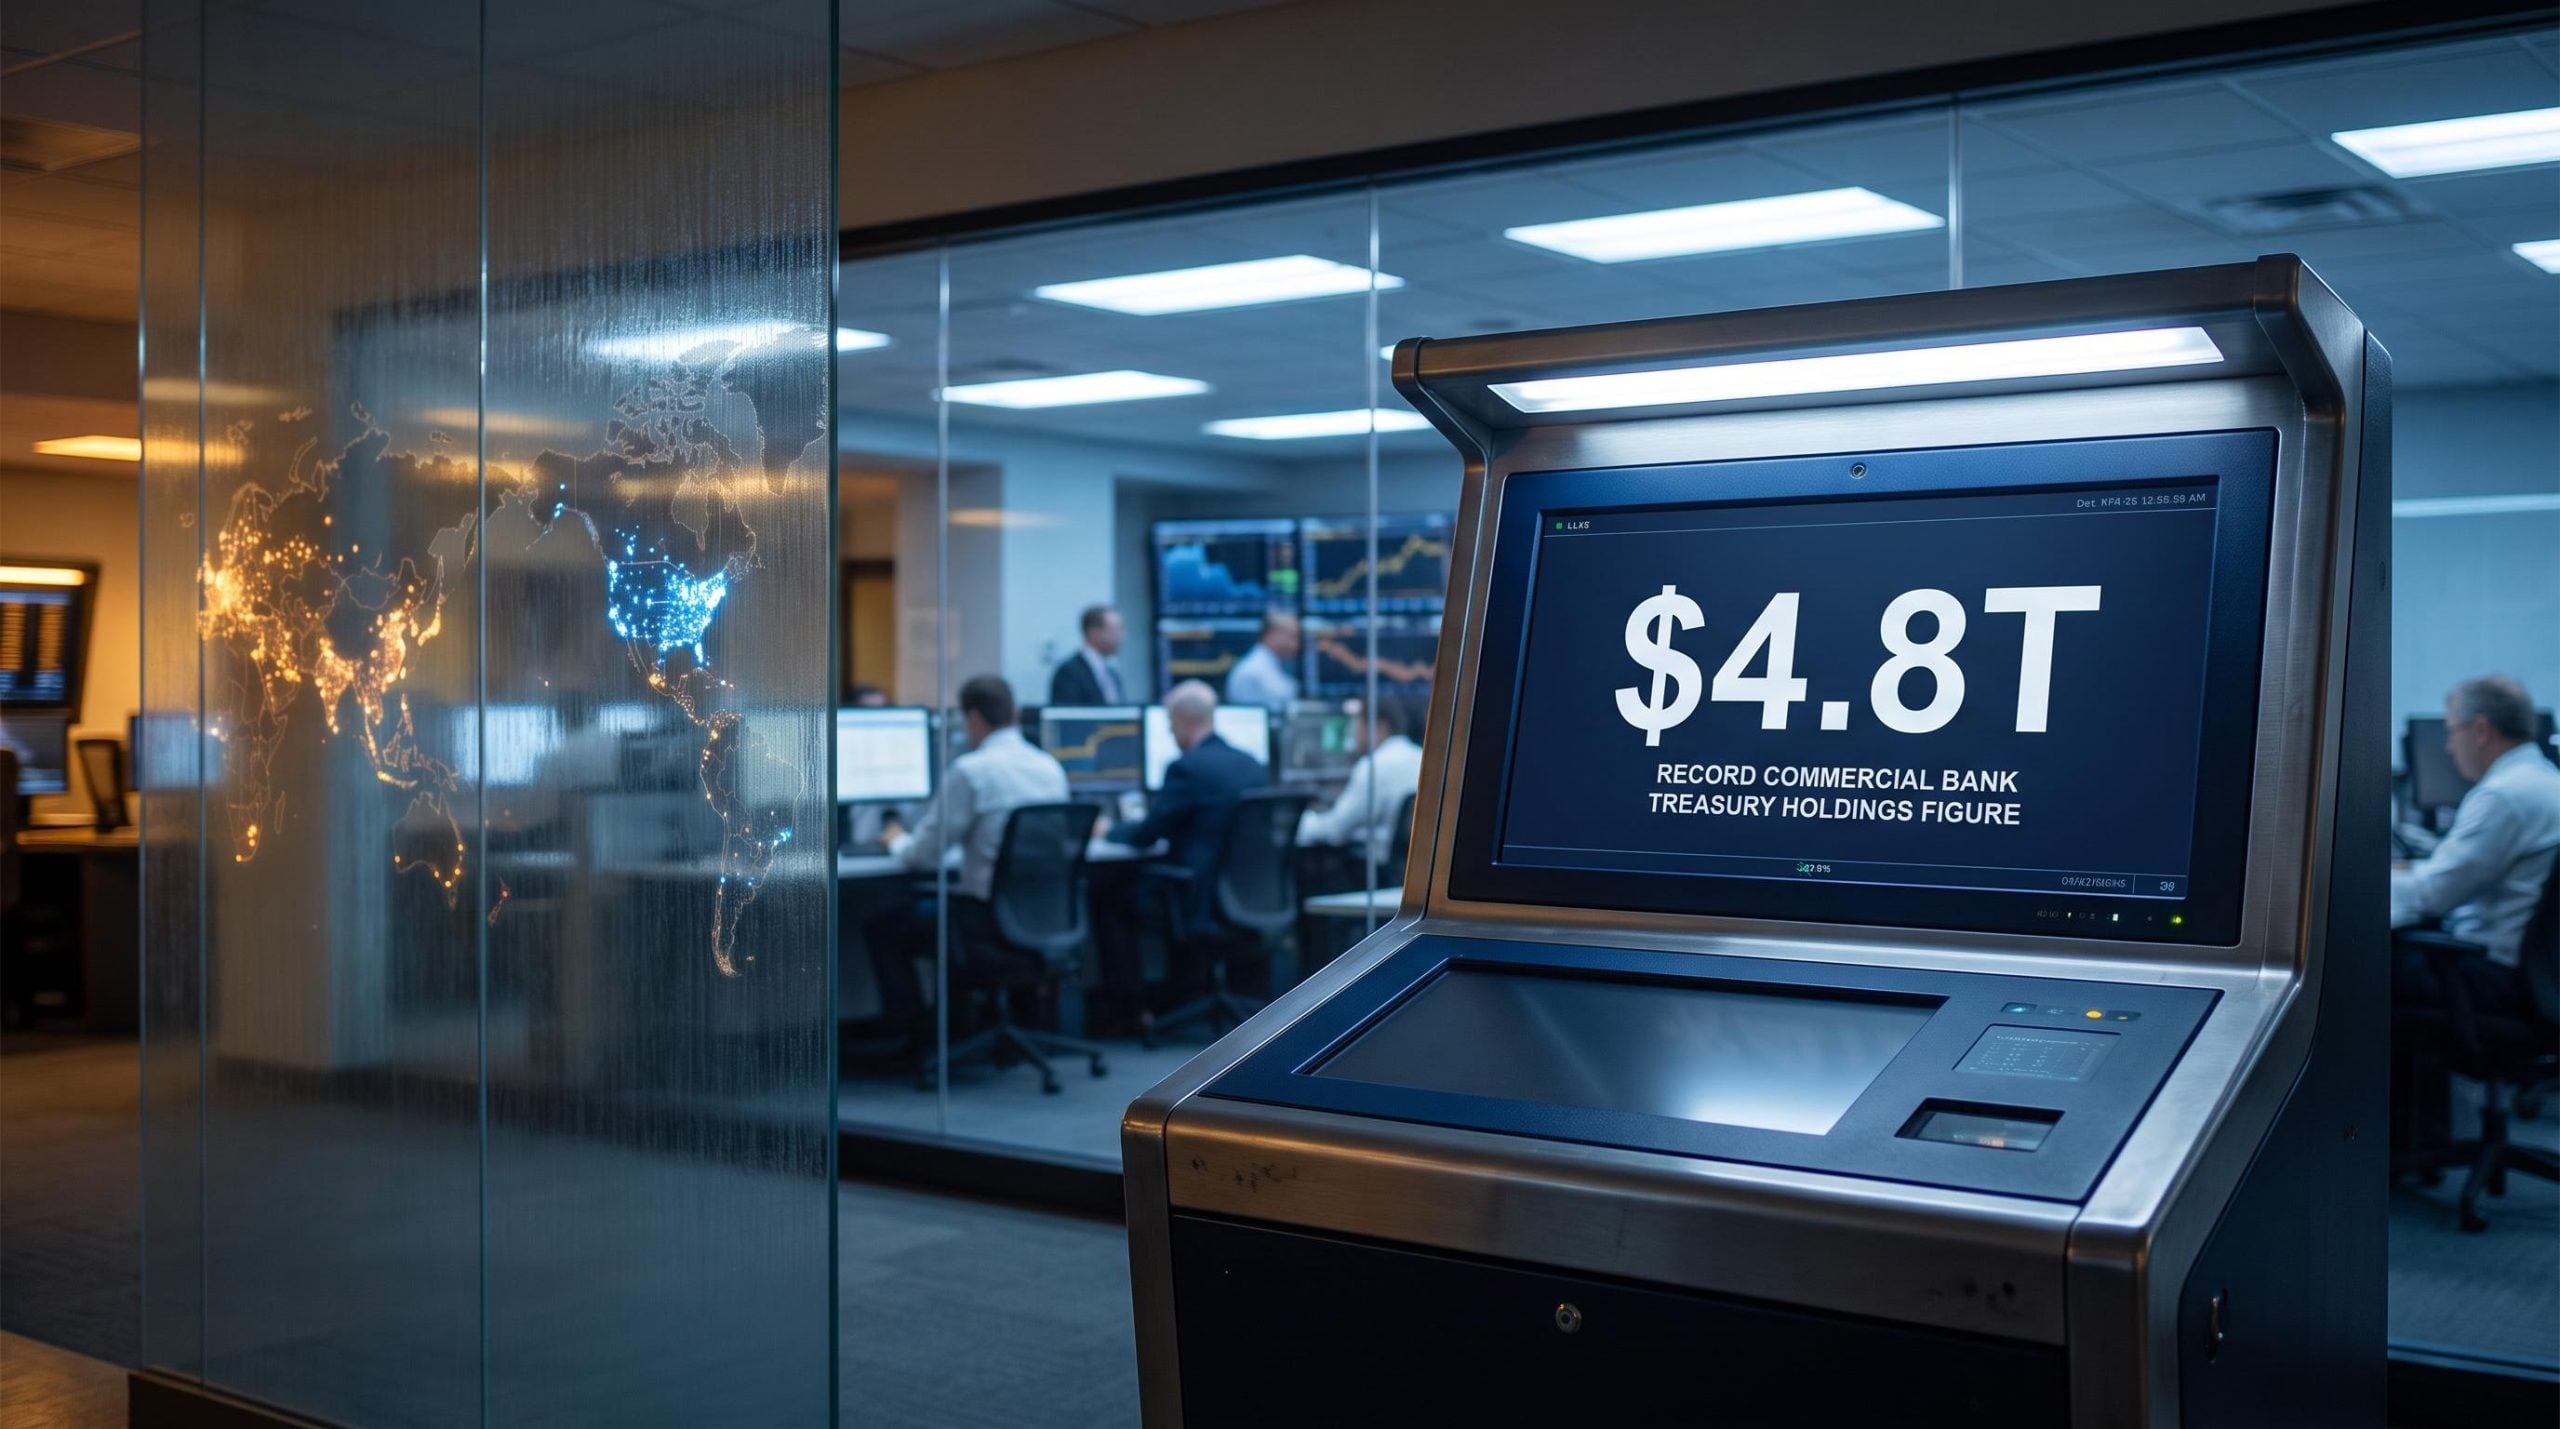
$4.8 trillion. That is how much U.S. commercial banks held in Treasury securities by early August 2026, a record high according to Federal Reserve H.8 data, reflecting the extent to which domestic institutions have absorbed supply as foreign demand has plateaued.
Two structural incentives explain why banks are the marginal buyer. First, Treasuries carry a zero risk weight under Basel capital rules, meaning banks allocate no regulatory capital against them. Second, Treasuries qualify as high-quality liquid assets (HQLAs), the securities banks must hold to satisfy liquidity coverage requirements. Combined with a yield environment that makes Treasuries attractive relative to marginal loan growth, the regulatory and economic logic is compelling.
But banks are not the only domestic buyers filling the gap. The full landscape looks like this:
| Buyer Category | Current Role | Key Characteristic | Cyclicality |
|---|---|---|---|
| Foreign official and private holders | Large, stable in dollars | Shrinking share of outstanding debt | Low (structurally anchored) |
| U.S. commercial banks | Record $4.8T; primary marginal buyer | Regulatory demand anchor; yield-sensitive | High (pro-cyclical) |
| Money market funds | Large buyer of bills and repo | Expanded post-2023 deposit migration | Moderate (cash-flow driven) |
| Mutual funds, ETFs, pensions | Steady structural buyer across the curve | Allocation-driven; relatively stable | Low to moderate |
| Households | Growing direct and indirect buyer | Yield-motivated via brokerage platforms | Moderate (price-sensitive) |
| Federal Reserve | Net non-buyer (QT) | Latent buyer of last resort | Counter-cyclical (intervenes in stress) |
The Federal Reserve, still shrinking its balance sheet under quantitative tightening (QT), is notably absent as a buyer. It remains the backstop if market functioning deteriorates, but in the current environment, the marginal demand is coming from institutions whose appetite is tied to yield levels, balance-sheet health, and regulatory standing, not from a central bank with an open-ended mandate.
Banks are buying because regulation and the yield environment make it rational right now, not because of a strategic commitment to absorb U.S. government debt regardless of conditions. That distinction is the key to understanding why this support is cyclical rather than structural.
What this ownership rotation actually means for market stability
Why does buyer composition matter? Because different buyers react to stress differently.
Reserve managers historically held through volatility. They were buying to manage currency reserves and geopolitical relationships, not to trade yield. When long-term rates moved against them, they absorbed the mark-to-market loss and stayed. Domestic commercial banks do not operate under the same logic. They are yield-sensitive, balance-sheet constrained, and subject to deposit competition that can force them to reduce holdings precisely when the market needs support.
Two structural vulnerabilities define the current configuration:
- Pro-cyclicality of bank demand: Banks buy Treasuries when liquidity is ample and yields are attractive. They slow or stop buying, and can become forced sellers, when facing deposit outflows or capital pressure.
- Balance-sheet feedback loops: Rising yields mark down the value of banks’ fixed-rate securities portfolios, creating unrealised losses. Those losses can impair capital ratios and curtail future buying capacity, creating a self-reinforcing cycle.
The 2020 and 2023 stress episodes as a template
In March 2020, the world’s deepest and most liquid sovereign bond market temporarily seized. Forced selling by leveraged funds and dealers overwhelmed dealer balance-sheet capacity, and the Federal Reserve had to intervene with emergency purchases to restore functioning. The episode demonstrated that even Treasuries are not immune to liquidity crises when cyclically motivated participants become forced sellers simultaneously.
The 2023 regional bank episode provided a more targeted illustration. Silicon Valley Bank and several peers had loaded their balance sheets with long-duration fixed-rate securities. When yields rose sharply and deposit outflows accelerated, the unrealised losses in those portfolios became existential. The mechanism is directly applicable to the current environment: banks with record Treasury exposure face the same duration risk if long yields rise sharply while funding pressure builds.
The SVB episode showed that duration risk in bank securities portfolios is not hypothetical. When long yields rise sharply and funding stress appears simultaneously, the institutions doing the most marginal buying become the institutions most at risk of forced reduction. That is the feedback loop that matters most for this cycle.
The slow-motion risk: term premium and what higher-for-longer debt costs mean for your portfolio
Not every risk announces itself with a headline. The more insidious scenario is a persistent upward drift in the term premium, the additional yield investors demand to hold long-duration U.S. debt as compensation for uncertainty over future inflation, fiscal trajectories, and policy credibility. The term premium is distinct from expectations about Federal Reserve rate policy; it captures structural investor sentiment about the risk of holding duration.
Term premium repricing is already visible in live market data: the 30-year Treasury yield closed at 5.33% on 18 August 2026, with the ACM model placing the 10-year term premium estimate at 0.99-1.35%, a simultaneous G10 sovereign repricing that confirms the structural drift described here is not a theoretical projection but a current market condition.
The New York Federal Reserve’s ACM (Adrian-Crump-Moench) model separates rate expectations from the term premium embedded in long-term yields. It is the most widely referenced tool for monitoring whether investors are demanding more compensation to hold U.S. government duration risk, independent of the Fed’s rate path. It is worth adding to your macro monitoring toolkit.
The combination of deficits consistently exceeding $1 trillion annually, a $1.1 trillion annual interest bill, a debt-to-GDP ratio of 122.6%, and a more cyclically sensitive buyer base creates the conditions for a structural upward drift in the term premium, even without an acute crisis.
What does that mean across asset classes? The transmission channels are direct:
- Equity valuations: Higher discount rates compress present values and lower price-to-earnings multiples
- Credit conditions: Higher risk-free rates tighten credit spreads at the margin and raise borrowing costs
- Leveraged positions: Higher duration costs raise the hurdle rate for every leveraged position in the portfolio
If the term premium drifts structurally higher by even 50-100 basis points over the next several years, that is not a bond market story in isolation. It reprices equity valuations downward and raises the cost of capital for every leveraged position you hold. This is a cross-asset risk, not just a fixed-income risk.
This article is for informational purposes only and should not be considered financial advice. Investors should conduct their own research and consult with financial professionals before making investment decisions. Past performance does not guarantee future results. Financial projections are subject to market conditions and various risk factors.
Four signals that will tell you when the buyer base is under stress
The structural analysis above is a framework. These are the instruments on the dashboard.
- TIC data (foreign holdings): Monthly flow data and annual surveys from the U.S. Treasury track foreign purchases and sales of U.S. securities. The June 2025 survey (released April 2026) provides the current baseline.
- Federal Reserve H.8 (bank balance sheets): Released weekly, this report tracks commercial bank securities holdings relative to loans and deposits.
- Treasury auction metrics: Bid-to-cover ratios, indirect bidder share, primary dealer allotments, and auction tails (the gap between the clearing yield and the pre-auction when-issued yield) collectively signal the health of primary market demand.
- ACM term-premium estimates: The New York Fed publishes updated estimates that allow you to separate structural duration risk from rate-path expectations.
| Indicator | What to Watch | Warning Signal |
|---|---|---|
| TIC data | Holdings by Japan, China, euro area, oil exporters | Sustained declines or acceleration of the plateau among major official holders |
| Fed H.8 | Bank Treasury holdings relative to deposit trends | Plateau or decline in holdings, especially alongside rising yields |
| Treasury auctions | Bid-to-cover ratios, indirect bidder share, dealer takedowns, auction tails | Persistently heavy dealer allotments (weak end-investor demand) and large auction tails |
| ACM term premium | Level and direction of estimated term premium | Persistent upward drift distinct from rate expectations, signalling structural demand erosion |
None of these indicators is currently at a warning threshold. But knowing what a deteriorating reading looks like gives you the ability to respond to a regime change early, rather than after yield moves have already repriced your portfolio.
Not a crisis, but a regime change worth pricing in
The Treasury market is functioning. Auctions are clearing. There is no buyers’ strike in the data.
What the data does show is a regime-level shift. The buyer base is now more cyclical, more yield-sensitive, and more concentrated in domestic institutions whose capacity to absorb supply is tied to their own balance-sheet health and regulatory standing. Foreign holders have plateaued near 33% of outstanding debt. Domestic banks sit at a record $4.8 trillion. The Federal Reserve is shrinking its balance sheet, not expanding it.
The question for investors is not whether Treasuries will “fail.” It is whether the cost of U.S. government borrowing is structurally trending higher and more volatile, and what that means for portfolio construction in a world where the risk-free rate is no longer reliably stable.
The actionable implication is a positioning principle, not a trade recommendation. In a world where the marginal Treasury buyer is a domestic bank with balance-sheet constraints rather than a reserve manager with political mandates, the term premium and yield volatility are more likely to be persistent features than temporary distortions. That is not alarm. It is a calibration that belongs in every portfolio conversation this cycle.
For investors wanting to understand how the government is actively managing long-end supply alongside the buyer rotation described here, our dedicated guide to Treasury buyback mechanics explains how the August 2026 programme expansion differs structurally from QE and what signal a language shift toward yield targets would represent.
These statements are speculative and subject to change based on market developments and policy decisions.