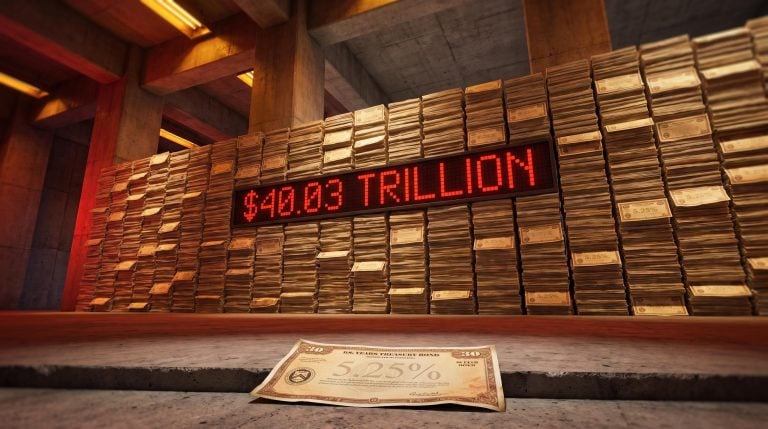
The Treasury doubled its bond buyback programme last week. The bond market reversed every gain within a single trading session, sending the 30-year yield back to just below 5.3%. That is not a policy hiccup. It is a power map, drawn in real time, showing who actually sets the price of long-term money in the United States.
The timing sharpens the picture. The Jackson Hole Symposium is underway, Kevin Warsh is making his inaugural appearance as Fed Chair, and the 30-year Treasury yield is sitting near its highest level in roughly 25 years. Most readers have seen the yield headlines. Fewer have the structural framework to interpret what those numbers actually mean for the assets they hold.
Here is that framework. What follows covers which yield level to watch, why the Fed cannot simply fix it, and what the structural forces driving this moment mean for how your portfolio is actually positioned right now.
How the bond market quietly took control of US interest rates
Start with a number Warsh himself acknowledged. Over a 42-day period when the Fed held its position, it was market forces rather than central bank action that pushed rates significantly. The institution charged with setting monetary policy stood aside while the bond market moved.
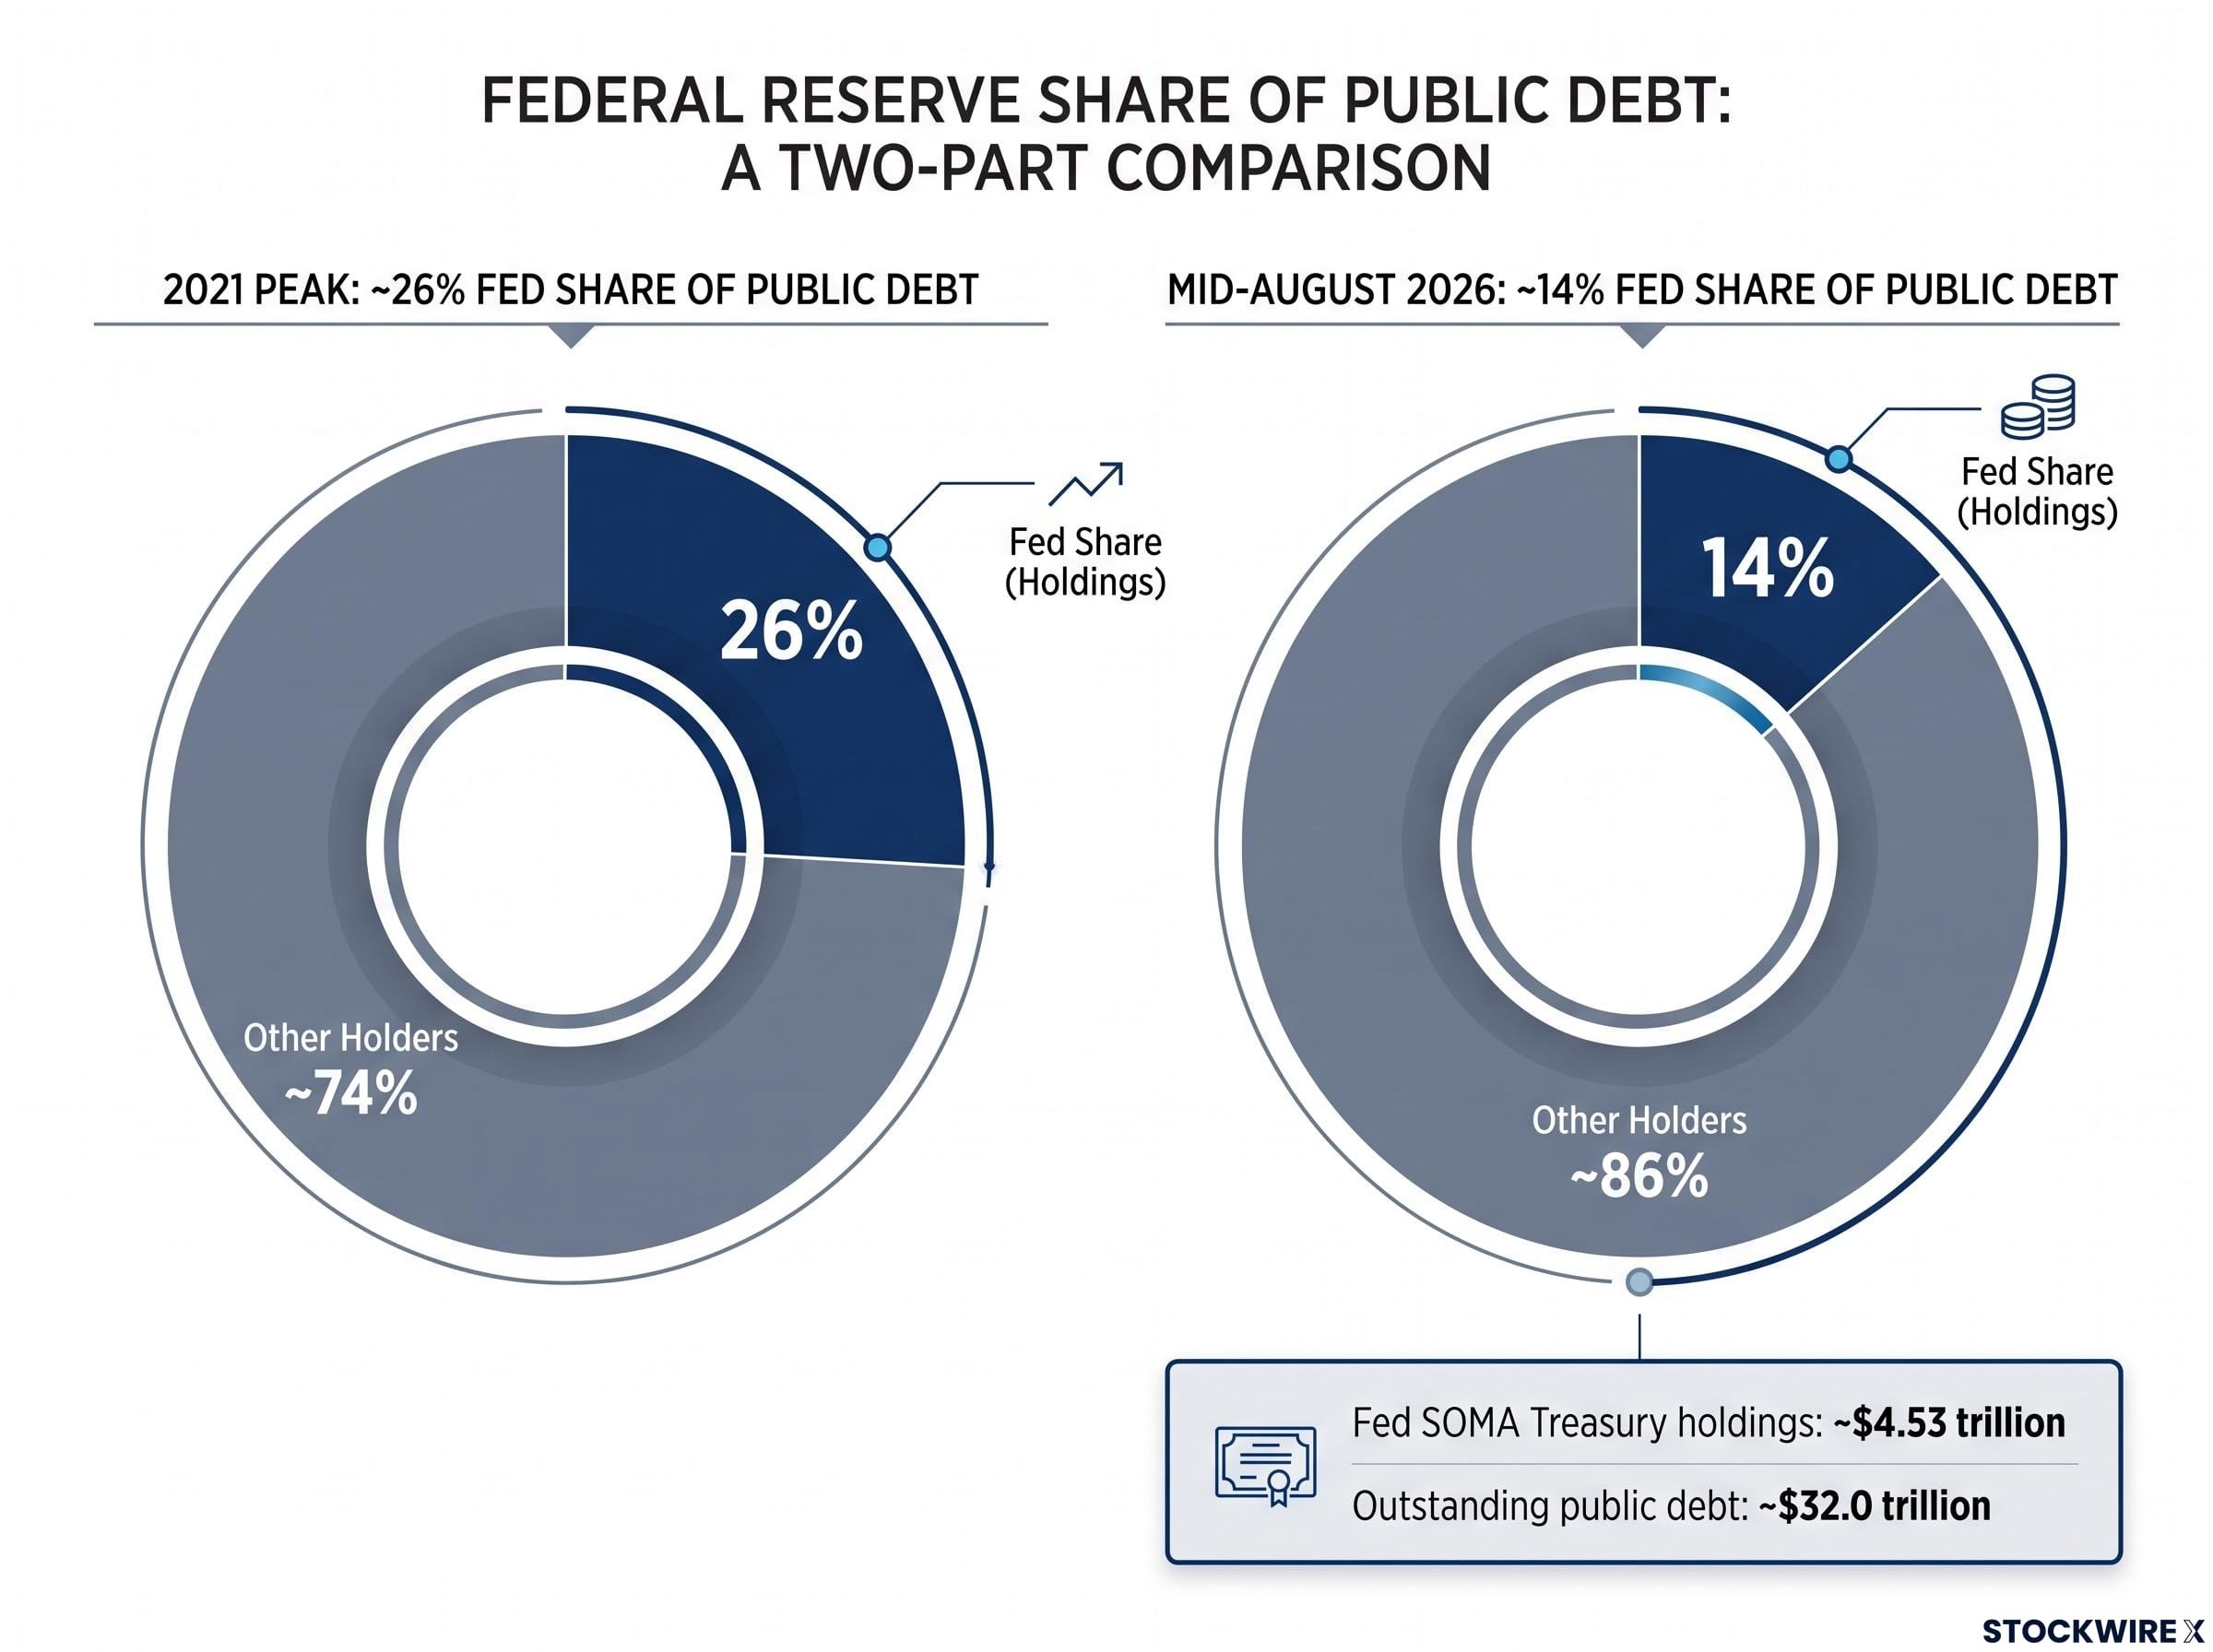
That was not a one-off. The Fed’s System Open Market Account (SOMA), its direct holdings of Treasury securities, stood near $4.53 trillion in mid-August 2026. That represents roughly 14% of debt held by the public, down from a peak of approximately 26% in 2021. The Fed’s direct leverage over long-term borrowing costs has roughly halved in five years.
The FRED Treasury holdings data published by the St. Louis Federal Reserve tracks the Fed’s balance sheet in real time, confirming the scale of quantitative tightening that has reduced the central bank’s footprint from a peak of roughly 26% of public debt to approximately 14% today.
| Metric | 2021 Peak | Mid-August 2026 |
|---|---|---|
| Fed share of public debt | ~26% | ~14% |
| Fed SOMA Treasury holdings | Peak level | ~$4.53 trillion |
| Outstanding public debt | — | ~$32.0 trillion |
Meanwhile, the market the Fed is trying to influence trades above $1 trillion per day. Peter Boockvar, CIO at Bleakley Financial Group, put it plainly.
The bond market is substantially larger than the Treasury. The government lacks the resources to prevail in a sustained confrontation with it.
Gareth Soloway of Verified Investing raised the logical follow-up: with the bond market moving rates under its own momentum, the question becomes whether the Fed retains any genuine authority over pricing across the full maturity spectrum. The answer is nuanced, the Fed still controls the short end of the curve, but if your portfolio assumes the central bank controls rates across the entire maturity spectrum, you are working with a model that stopped being accurate several years ago.
When big ASX news breaks, our subscribers know first
Structural retreat: why institutional demand for long-duration Treasuries has weakened
The auction room for long-dated US government debt is emptying out. Not in a single dramatic exit, but in a slow, persistent withdrawal of precisely the buyers the Treasury needs most.
Pension funds, insurance companies, and sovereign wealth funds, the investors whose mandates make them natural buyers of 20- and 30-year paper and who would typically hold those positions for decades, have been progressively stepping back from these auctions. A recent $25 billion auction of 30-year Treasury bonds completed at the highest yield in approximately 25 years. That yield did not attract them back.
Adrian Day, president of Adrian Day Asset Management, explained why higher yields do not automatically solve the problem. His argument is that a rising yield on its own does not signal opportunity; it can equally reflect underlying weakness in the issuing market or currency, deterring the very buyers it is meant to entice. He cited Brazil as a case in point, where bonds offering elevated yields still failed to deliver strong returns, because that yield was pricing in structural risk rather than attracting capital.
Day observed that while no US Treasury auction has technically failed, the pool of willing buyers for long-duration paper has been steadily contracting.
The categories of structural buyers that have retreated include:
- Domestic pension funds reducing duration exposure
- Insurance companies reallocating away from long-dated government paper
- Sovereign wealth funds diversifying reserves
- The Bank of Japan, historically one of the largest foreign holders
Boockvar noted that foreign holders account for roughly 30% of total outstanding Treasuries, but a meaningful portion of that figure represents hedge fund activity routed through the Cayman Islands, not genuine long-term institutional demand. The headline number overstates the structural bid beneath these bonds.
The structural rotation in Treasury buyers, from foreign reserve managers toward domestic commercial banks now holding a record $4.8 trillion, has materially altered the risk profile of the long end in ways that the headline yield number alone does not capture.
That distinction matters. If you hold long-duration Treasuries as safe-haven assets, the risk profile has changed even though the asset class label has not. The 30-year yield above 5.2% is not just a price signal; it reflects a growing gap between what the Treasury needs to borrow at long maturities and what genuine institutional buyers are willing to absorb.
Japan’s retreat and what it signals about foreign demand
Japan cut its Treasury holdings by nearly 4% in March 2026, reducing its position to roughly $1.19 trillion. The reason was not geopolitical. As the Bank of Japan normalised domestic policy and Japanese yields rose, the incentive to hold US Treasuries instead of domestic bonds weakened.
That makes this reduction persistent rather than episodic. It is a rational response to changing domestic conditions, and those conditions are moving in one direction. As long as Japanese domestic yields continue to rise, the structural pull toward US Treasuries continues to weaken.
The yen carry trade: the hidden wire connecting Tokyo to Treasury yields
There is a direct mechanical link between the value of the Japanese yen and demand for US Treasuries, and understanding it changes how you interpret both Japanese monetary policy and US yield movements.
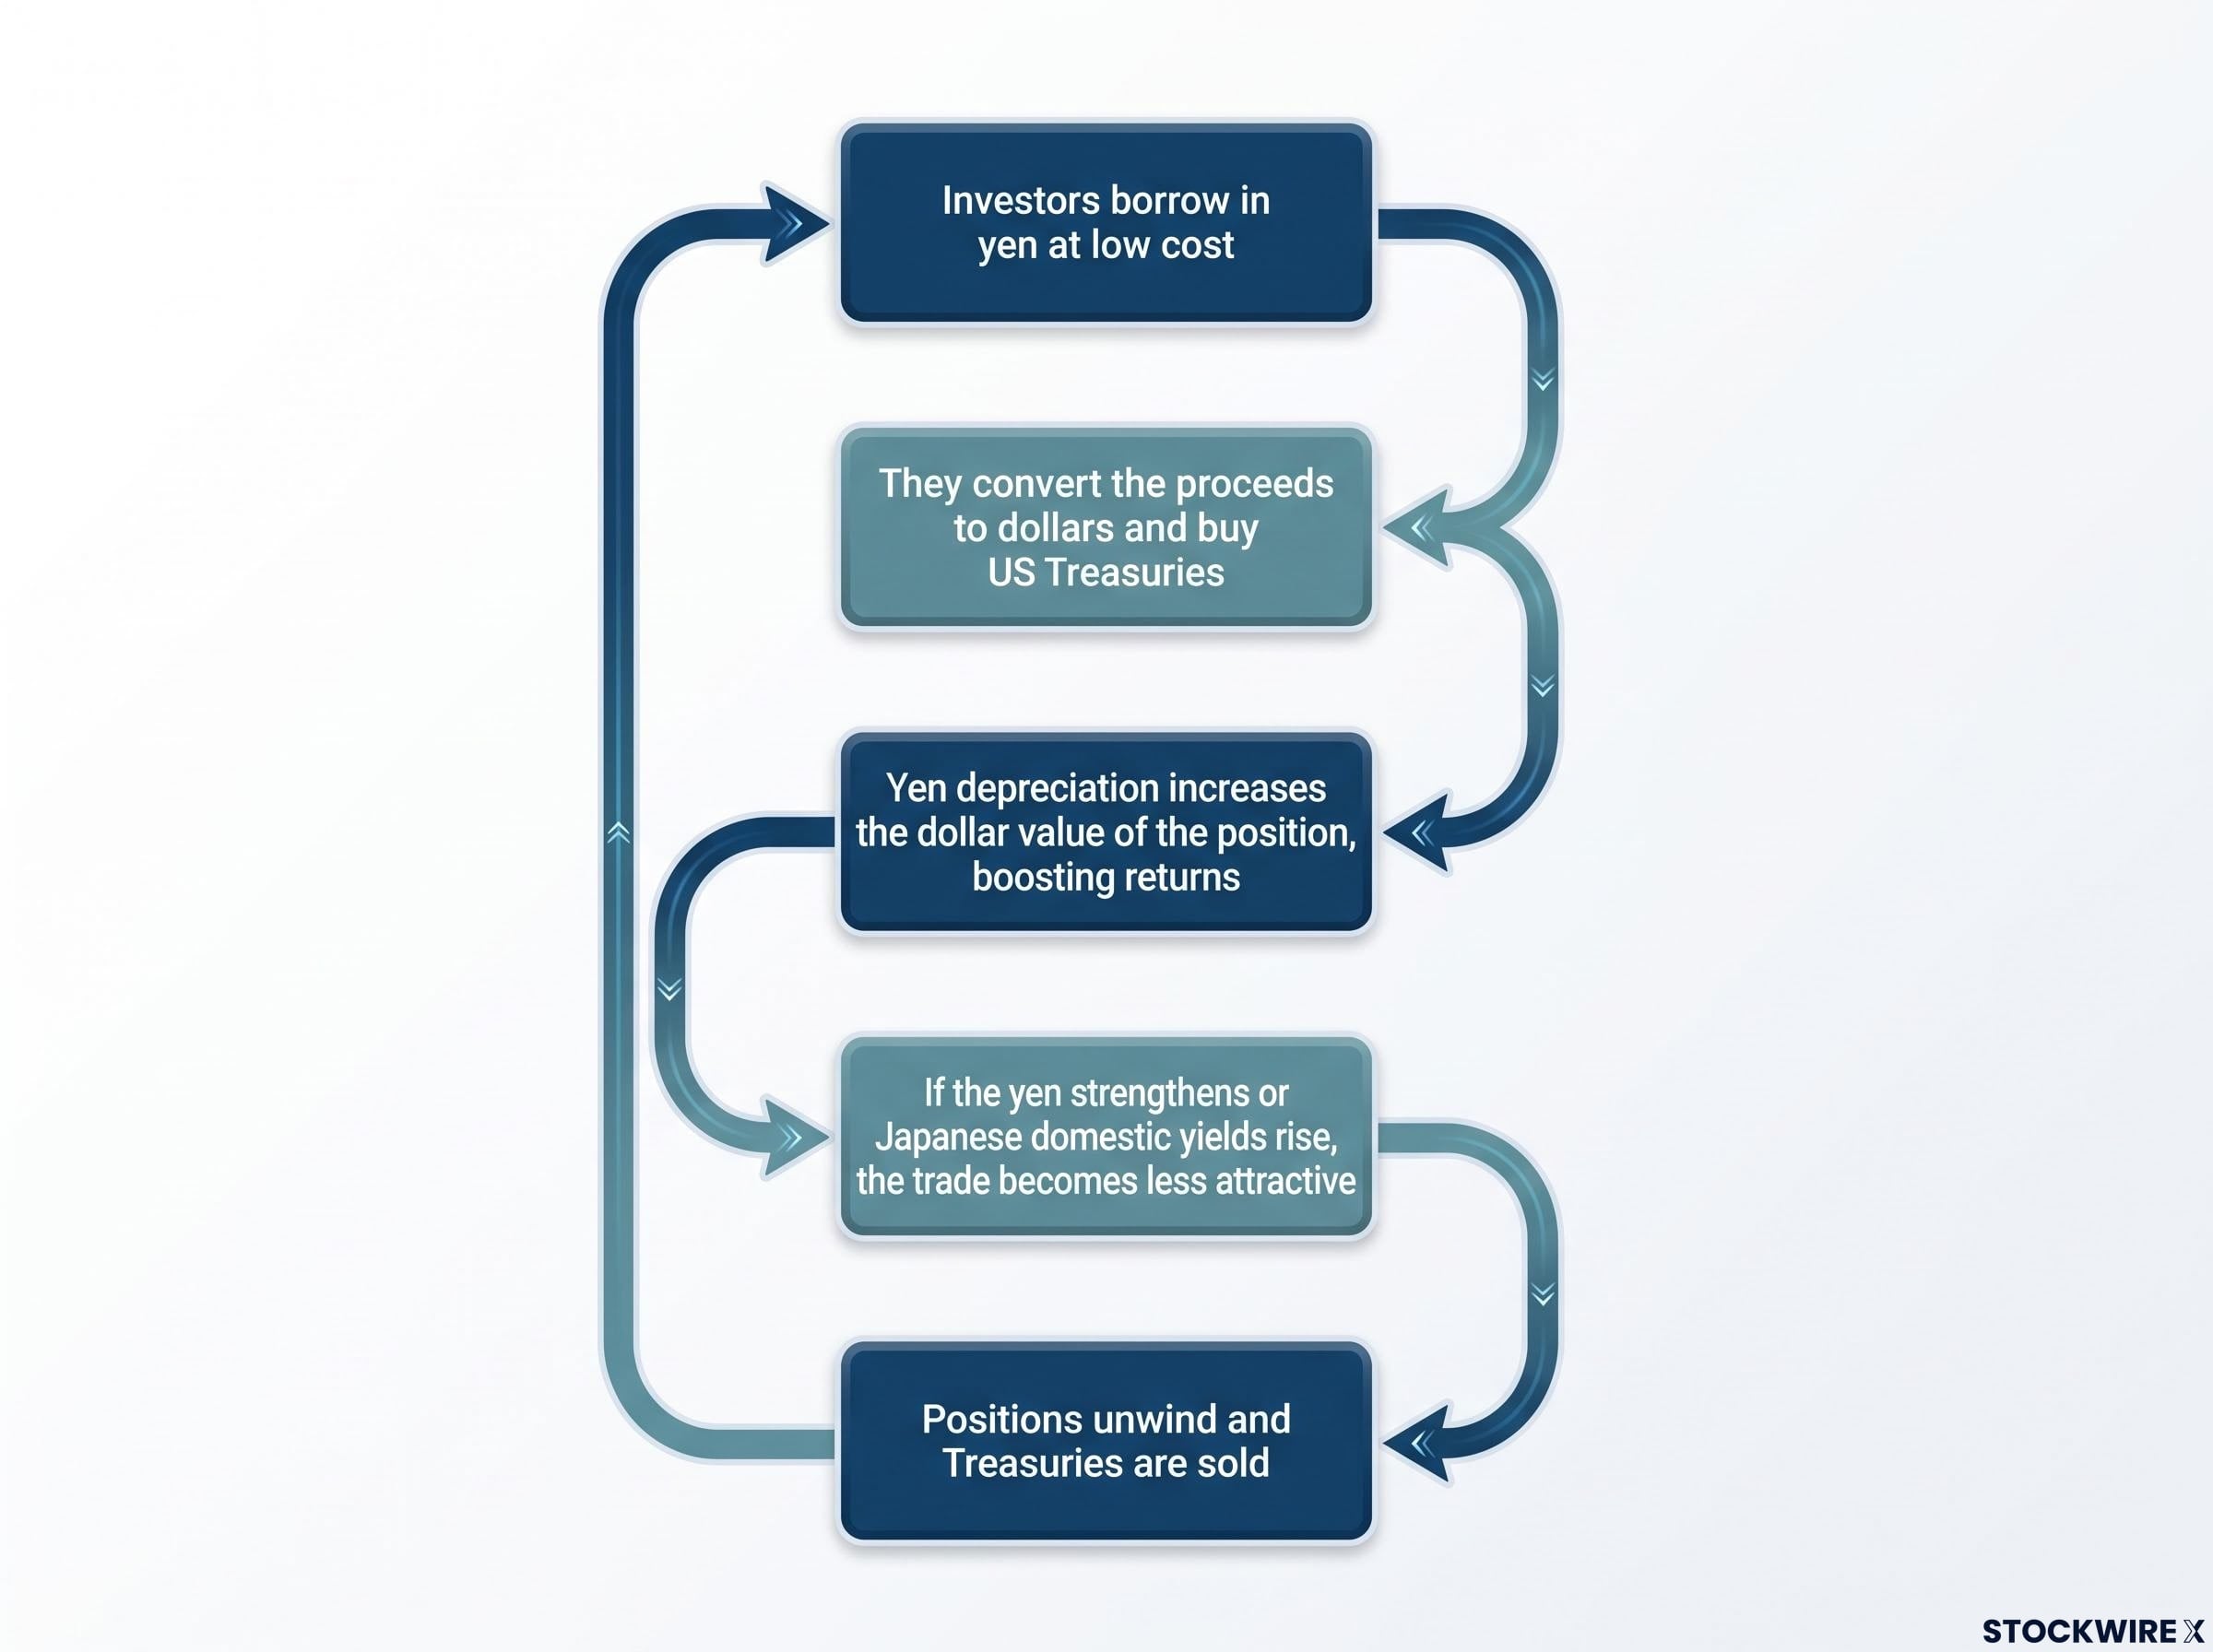
The mechanism works in a chain:
- Investors borrow in yen at low cost
- They convert the proceeds to dollars and buy US Treasuries
- Yen depreciation increases the dollar value of the position, boosting returns
- If the yen strengthens or Japanese domestic yields rise, the trade becomes less attractive
- Positions unwind and Treasuries are sold
Professor Steve Hanke of Johns Hopkins University identified this carry trade channel as the structural mechanism connecting yen value to US Treasury demand. For years, cheap yen funding underwrote a significant flow of capital into US government bonds.
Hanke explained that defending Japan’s currency simultaneously supports the US bond market, because a sharp yen decline would compel carry trade investors to unwind positions and sell Treasuries.
That is exactly why the Treasury’s July 31st yen intervention mattered. Washington had not moved to support the yen in nearly three decades, making this the first such action since 1998, and Hanke identified it as structurally connected to the bond buyback that followed within weeks. Defending the yen was, in effect, a US bond market operation.
The unwinding risk is real. Estimates suggest that reduced Japanese demand and fiscal deficits could add 20-50 basis points to the 10-year yield over the medium term. A rapid yen move could force leveraged positions to liquidate US Treasury holdings quickly, amplifying volatility in a market that is already structurally fragile.
Carry trade unwind risk is real but historically episodic: the 2024 episode cleared 40-60% of speculative positioning within weeks and produced no cascading structural breakdown, a precedent that matters when assessing how quickly a yen move could force leveraged Treasury liquidations.
What this tells you is that the Fed is not the only institution whose policy decisions move US long-term rates. The Bank of Japan’s domestic normalisation is effectively a slow-motion tightening of conditions in the US Treasury market, independent of anything Warsh decides at his next meeting. If you are not monitoring Japanese monetary policy and yen movements as leading indicators for Treasury volatility, you are missing a connection that most equity-focused portfolios completely ignore.
One session: what the Treasury’s failed bond buyback actually proved
The Treasury doubled its bond buyback programme to approximately $4 billion per month. Danielle DiMartino Booth, CEO of QI Research, had called the move a day ahead of the official announcement, framing it as a Treasury-administered version of Operation Twist (a strategy where the government buys long-dated bonds to push down long-term yields while selling short-dated ones), with the key difference being that this time the executive branch, not the Fed, was pulling the levers.
The market reaction sequence tells the story:
- The buyback was announced
- Gold rallied roughly 3% to approximately $4,500 per ounce
- Bitcoin climbed over 5% in the session
- The Dow Jones Industrial Average dropped more than 700 points the following day
- The 30-year Treasury yield returned to just below 5.3%, fully erasing all gains
One session. Every gain reversed.
Boockvar described the Treasury’s position as a classic whack-a-mole dilemma, noting that each lever pulled creates unavoidable knock-on effects elsewhere: a weaker dollar resulting from intervention could prompt unhedged foreign Treasury holders to sell their positions, making the yield problem worse rather than better.
The arithmetic explains why the buyback could not hold. Compare the programme’s scale to the market it is trying to move:
| Measure | Scale |
|---|---|
| Treasury buyback programme | ~$4 billion/month |
| Outstanding public debt | ~$32 trillion |
| Daily trading volume | Above $1 trillion |
| Fed SOMA holdings | ~$4.53 trillion |
DiMartino Booth expressed a preference for Treasury-led intervention over forcing the Fed into additional quantitative easing, but the one-session reversal demonstrated the core limitation. At this scale, $4 billion per month is not a credible counterweight. The bond market set the price, and the question for any future intervention is not whether it will produce a rally, but whether that rally will hold.
Where the 10-year yield becomes a systemic stress signal for financial markets
There is a specific number to watch, and it has a name behind it. DiMartino Booth pointed to 5% on the 10-year Treasury as the point beyond which the financial system would face broad and acute stress across markets.
As of mid-2026, the 10-year sits near 4.47%. Prediction markets estimate a one-in-three probability of it breaching 5% before year-end. That is not a tail risk. It is a live scenario.
DiMartino Booth described a 10-year yield at 5% as the line where pressures building across the financial system would shift from manageable to genuinely disruptive.
A move toward or above that level would compress valuations and widen spreads across the asset classes most exposed:
- Leveraged and rate-sensitive equities
- Commercial real estate dependent on refinancing at current rates
- Long-duration fixed income
- Heavily indebted corporate credits
A one-in-three probability is not a signal to panic. But it is a probability that should change how you think about current equity and real estate exposure, particularly in sectors where the valuation case depends on rates staying where they are.
Bear steepening and why the entire curve is repricing
The yield curve is transitioning from inversion to what fixed income analysts call a “bear steepening,” a state where long-term yields rise faster than short-term yields, driven not by rate hikes but by supply, fiscal deficits, and inflation expectations.
This matters because the 10-year yield is the benchmark discount rate for almost every major asset class. When it moves higher because of structural fiscal factors rather than cyclical monetary policy, the repricing is broader and more persistent. Equities, corporate debt, real estate, and private assets all recalculate present values from the same reference point.
Term premium dynamics are doing the heavy lifting behind the 30-year’s move: the ACM model places the 10-year term premium at 0.99-1.35%, confirming that the structural upward drift in duration risk compensation is already a live market condition rather than a forecast.
This is not a cycle-driven adjustment that normalises quickly. It reflects fiscal and demand factors that are likely to persist, and every portfolio that uses Treasuries as the risk-free rate is exposed to the repricing whether the holder recognises it or not.
Reading the bond market’s signals: a portfolio framework for the current regime
The structural forces covered in this analysis point to a single practical question: which assets in your portfolio are implicitly making a bet that the current yield regime does not worsen?
The framework below is not a set of recommendations. It is a lens for identifying where your positioning may be carrying structural risks that traditional allocation models do not reflect.
| Asset Class | Current Signal | Risk if Yields Rise Further | Portfolio Role in This Regime |
|---|---|---|---|
| Long-duration Treasuries | 30-year yield above 5.2%; weakening structural bid | High: duration and term-premium risk | Elevated risk; not the safe haven the label implies |
| Short-duration fixed income | Attractive yields with less term-premium exposure | Low: minimal sensitivity to long-end moves | Relatively attractive; reduces steepening exposure |
| Gold and real assets | Gold near $4,600/oz (three-month peak) | Moderate: may benefit from fiscal and currency concerns | Fiscal and currency hedge |
| Bitcoin and digital assets | Near $77,000; +22% over preceding week | High volatility; correlation instability | High-risk satellite, not core hedge |
| 10-year yield (risk gauge) | Near 4.47%; one-in-three probability of 5% | A breach of 5% reprices rate-sensitive assets broadly | Monitoring signal for exposure reassessment |
Boockvar warned that a weakening dollar resulting from intervention could trigger foreign Treasury holders to sell, compounding the yield problem the Treasury is trying to solve.
Gold’s move to approximately $4,500 per ounce on the buyback announcement day, and its subsequent hold near $4,600, reflects the fiscal and currency hedge case in real time. Bitcoin’s 5%+ single-session gain and its broader 22% weekly advance are consistent with macro-asset behaviour, though its volatility and regulatory uncertainty mean it belongs as a satellite position rather than a core allocation.
The key adjustment is not necessarily moving into or out of specific assets. It is ensuring that the implicit bets your portfolio is making, particularly any assumption that yields stay near current levels, are conscious rather than inherited from an allocation model built in a different rate environment.
What Warsh’s Jackson Hole moment tells us about where the power actually sits
Warsh steps to the Jackson Hole podium this week as the newest Fed Chair, and every section of this analysis should shape how you listen to what he says.
He has already acknowledged the core dynamic: across a 42-day stretch of Fed inactivity, it was the market rather than any policy action that drove a material shift in rates. That admission is the starting point. The structural forces covered here, the demand shortfall at the long end, the carry trade linkage to Tokyo, the one-session buyback failure, all define the boundaries of what Warsh can credibly promise and what the bond market will determine regardless.
The Fed retains real power over two things: the short end of the curve and market psychology. Both matter. Short-rate signalling still shapes the conditions in which the bond market makes its own pricing decisions. But the long end operates increasingly independently, priced by a $32 trillion market with daily volumes above $1 trillion and a Fed footprint that has shrunk to 14% of outstanding public debt.
Boockvar noted that quantitative easing and yield curve control remain available to the Fed in principle, but argued that both amount to short-term fixes carrying serious long-term costs, and that deploying yield curve control while inflation remains elevated would be an exceptionally expensive undertaking.
Fed balance sheet constraints extend well beyond the SOMA Treasury holdings: the agency MBS portfolio alone carries approximately $423 billion in unrealised losses and a weighted average life of roughly 8.8 years, meaning active normalisation toward pre-COVID size faces structural obstacles the short end of the curve cannot resolve.
When Warsh speaks, listen specifically for:
- Signals on the pace of quantitative tightening
- Any acknowledgement of term premium dynamics driving the long end
- Language on fiscal coordination between the Treasury and the Fed
- Any reference to yield curve control as a contingency
These are the tells that reveal whether Warsh understands the power map this analysis has traced, or whether he is still operating as though the Fed controls the entire curve. Readers who understand this distinction will interpret his commentary as one input among several, rather than as the definitive rate signal it might have been treated as a decade ago.
Warsh’s remarks are worth monitoring. Not because the Fed sets long-term rates, but because Fed credibility still shapes the environment in which the bond market makes its own decisions. The bond market is the larger force. How Warsh navigates that reality will tell you whether the next chapter of US rate policy is managed or improvised.
This article is for informational purposes only and should not be considered financial advice. Investors should conduct their own research and consult with financial professionals before making investment decisions. Past performance does not guarantee future results. Financial projections are subject to market conditions and various risk factors.