
By fiscal year 2026, the US government had already racked up $1.17 trillion in interest payments, a sum that had grown to dwarf the entire US defence budget. Gross federal debt surpassed $40.03 trillion in August 2026, and just last week the Treasury sold $25 billion worth of 30-year bonds at a yield not seen in a quarter of a century.
Those numbers alone would warrant attention. What makes this moment different is the convergence happening beneath them: a technical breakout pattern in long-term yields that mirrors conditions last seen before the global financial crisis, a set of geopolitical constraints that prevent the Federal Reserve from intervening the way it has in every prior bond-market stress episode, and an annual refinancing requirement north of $7 trillion that turns every auction cycle into a live stress test.
Here is what the data and the technicals are telling you simultaneously. The fiscal arithmetic is compounding structurally, the yield signal is already flashing, and the economists with the strongest track records are pointing to the same portfolio vulnerabilities. After this, you will know exactly which exposures carry the most risk, how to read the breakout signal that institutional traders are watching, and where the serious money is looking for protection.
The fiscal arithmetic that no budget forecast fully captures
Three numbers anchor the current fiscal reality:
- $40.03 trillion in gross federal debt as of 20 August 2026
- $1.17 trillion in fiscal-year-to-date interest expense, already surpassing the US defence budget
- $7 trillion-plus in annual debt that must be refinanced, a figure that grows each year
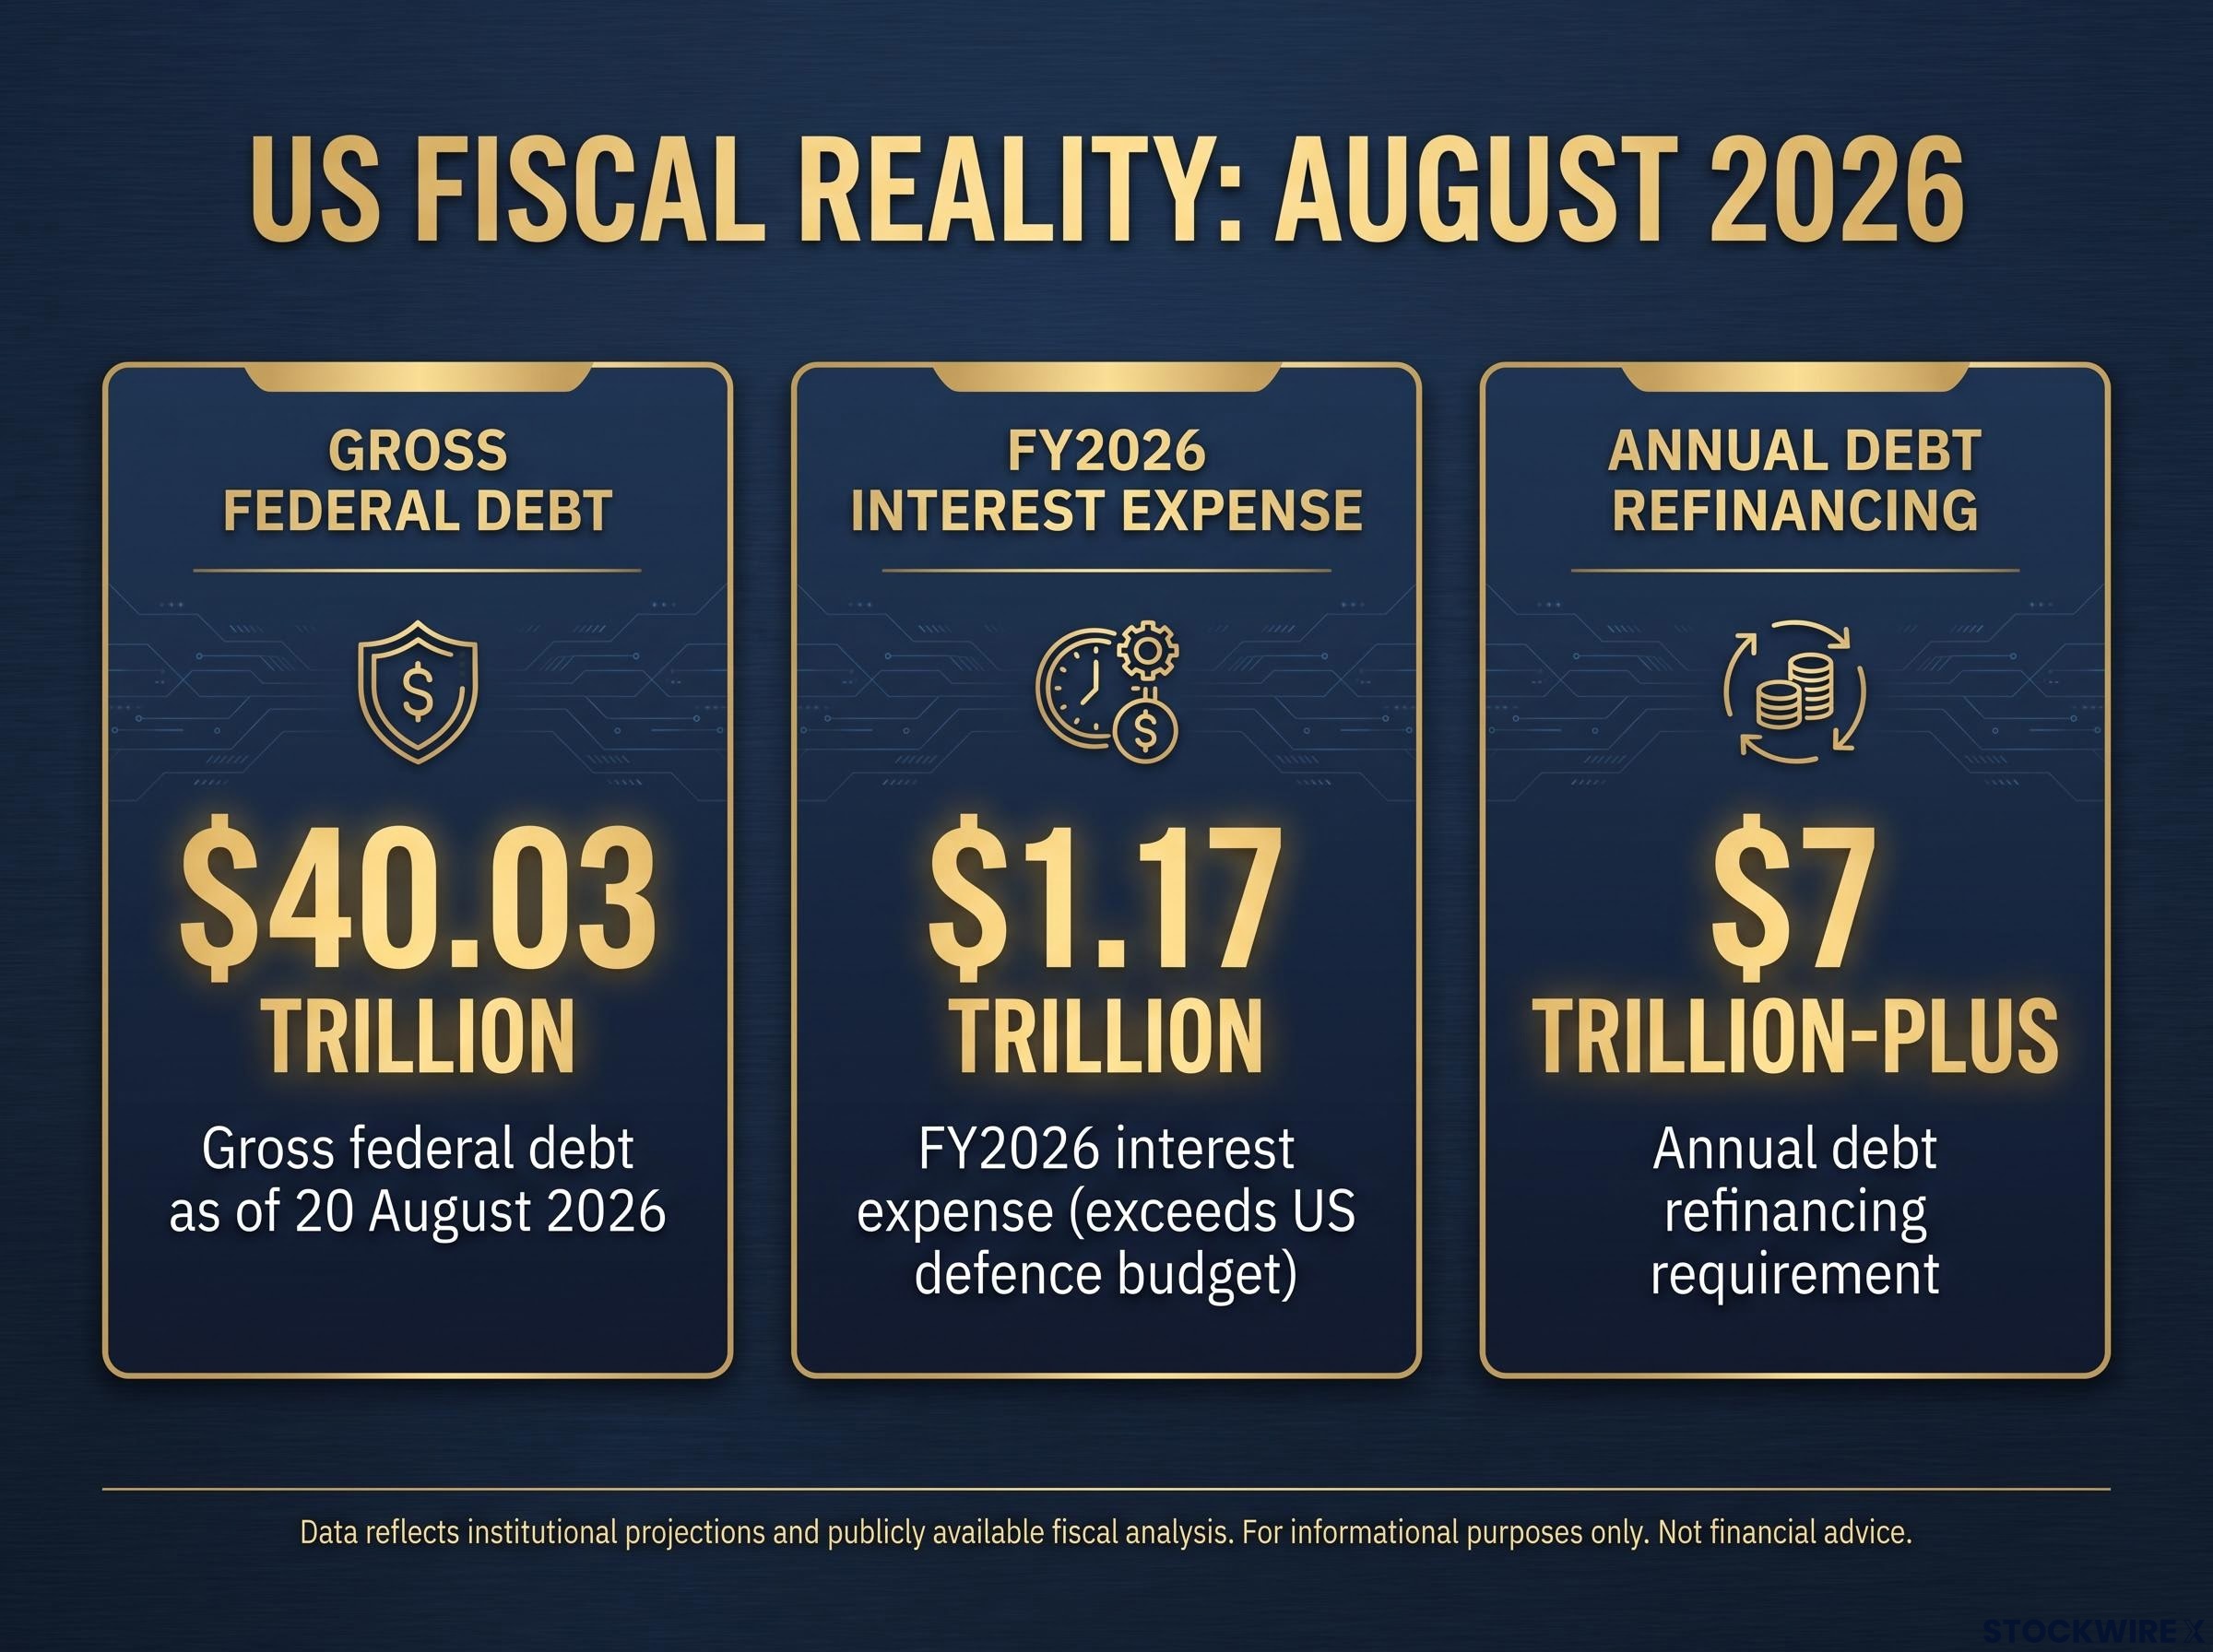
Debt servicing costs have overtaken national defence as the single largest claim on the federal budget. Interest outlays for fiscal year 2026 stand at $1.17 trillion, a figure that now exceeds what the United States spends on its armed forces in their entirety.
Each of those figures feeds the next. More issuance at higher rates drives up interest costs. Higher interest costs widen the deficit. A wider deficit demands still more issuance. The arithmetic is not theoretical; it is already in motion, visible in every auction calendar and every Treasury refunding announcement.
Danielle DiMartino Booth of QI Research has noted that US debt has nearly doubled since COVID without triggering significant market alarm. That observation is the quiet part: the debt roughly doubled from the mid-2010s to today, and the compounding cost only became visible once rates moved materially higher. The $7 trillion annual refinancing requirement is the mechanism that connects today’s fiscal position to tomorrow’s yield levels. It is not a future risk. It is a rolling structural reality already embedded in the auction schedule, repricing in real time.
Piper Sandler was among the first major institutions to move beyond trajectory warnings and apply explicit fiscal crisis language, identifying Treasury auction performance, term premium trajectory, and foreign holdings data from TIC reports as the key fiscal crisis signals that investors should monitor ahead of broader market repricing.
When big ASX news breaks, our subscribers know first
What the 30-year yield is actually signalling, and what history says comes next
The 30-year Treasury yield sits at 5.23-5.28% as of mid-to-late August 2026. The 10-year is at approximately 4.72%. Both are elevated relative to recent years, but neither is at stress levels.
The chart, however, is telling a different story. According to Chris Vermeulen, Chief Market Strategist at TheTechnicalTraders.com, the monthly chart of the 30-year yield is forming a pattern with close structural parallels to the pre-crisis setup visible in 2007, just ahead of the global financial crisis. His read of that pattern points to a potential upside move toward approximately 8%.
Vermeulen’s monthly chart analysis shows the 30-year yield forming a pattern that mirrors the 2007 setup. His upside target sits near 8%, approximately 275 basis points above current levels, a stress scenario that supply-and-demand dynamics for duration make structurally plausible.
Technical pattern recognition carries particular weight in a market driven by supply and demand for duration. The pattern is not sentiment; it reflects the structural auction pressure building under the surface.
Professor Steve Hanke of Johns Hopkins University corroborates the directional signal from the fundamental side. He points to three compounding pressures: ongoing geopolitical conflict (including Gulf closure and Houthi disruption of Red Sea trade routes), an inflation problem in the US that has yet to be resolved, and the fiscal trajectory that forces the government to issue growing volumes of Treasury paper to cover its deficit. Taking all three together, Hanke concludes the 30-year yield has a reasonable basis to move at least 50 basis points higher from where it currently stands.
An IMF working paper on US debt and long-term interest rates, drawing on a 50-year sample period, found statistically significant evidence that fiscal deterioration strengthens the relationship between deficit levels and the long end of the yield curve, a finding that gives the structural upward pressure on 30-year yields an empirical foundation beyond the technical chart signal.
| Scenario | 30-Year Yield | Basis Points Above Current | Characterisation |
|---|---|---|---|
| Current level | 5.25% | 0 | Prevailing market rate |
| Hanke minimum projection | ~5.75% | ~50 | Fundamental floor based on three identified drivers |
| Vermeulen stress scenario | ~8.00% | ~275 | Technical upside target; tail-risk scenario, not base case |
When a technically identifiable breakout pattern and three independently verifiable fundamental drivers converge, the 8% stress scenario becomes a legitimate planning assumption for portfolio stress-testing, even while current levels remain well below it. What this tells you is that the case for long-duration Treasuries as a risk-free anchor has materially weakened.
Why the Fed cannot simply cap yields this time
The standard resolution for bond-market stress has historically been aggressive Federal Reserve intervention: yield curve control, large-scale quantitative easing, or both. Every major bond-market dislocation since 2008 has been met with some version of this backstop.
This time, the tool is constrained.
Peter Boockvar of Bleakley Financial Group has argued that with inflation still unresolved, the cost of deploying yield curve control becomes prohibitive, because suppressing yields through renewed asset purchases risks entrenching the very price pressures that have not yet been contained.
Fed balance sheet constraints compound the yield curve control problem: the $1.93 trillion agency MBS portfolio, locked into low-coupon vintages with weighted average lives extending toward the mid-2030s under current prepayment conditions, structurally limits how aggressively the Fed can expand purchases without crystallising unrealised losses estimated at approximately $423 billion.
“Yield curve control is an extraordinarily expensive tool when inflation remains a live problem. That constraint limits what policymakers can realistically do to hold down the long end of the curve.” — Peter Boockvar, Bleakley Financial Group
The geopolitical layer compounds the constraint. Professor Hanke’s three yield-pressure factors each carry inflationary supply-side consequences:
- Active geopolitical conflicts: Gulf closure and Houthi disruption of Red Sea shipping lanes restrict energy and goods flow, keeping input costs elevated
- Persistent domestic inflation: not yet contained, not yet resolved, limiting the Fed’s room to ease aggressively
- Structural fiscal deterioration: ever-increasing Treasury issuance competing for buyer demand at every auction cycle
Adrian Day of Adrian Day Asset Management has argued that a lasting solution would require governments to bring their fiscal positions under genuine control, and that there is currently no sign of that happening.
Mark Skousen drew on the experience of Sweden in 1992, when that country’s authorities were forced to push short-term borrowing costs as high as 500% to stop investors abandoning the krona, as an illustration of how severely policy options can narrow once fiscal credibility comes into question.
The implication for your portfolio is direct: if your bond recovery assumptions depend on swift Fed intervention to suppress yields, you are carrying a model that may not reflect the current constraint environment.
Duration risk in plain numbers: what a move to 6%, 7%, or 8% means for a typical portfolio
Duration is a measure of how sensitive a bond’s price is to changes in interest rates. The longer the duration, the larger the price decline when yields rise.
Bond duration mechanics determine the exact dollar loss a portfolio absorbs for each percentage-point move in yields, and the 2022 episode, when long-dated zero-coupon Treasuries fell 39.2% as rates moved from near zero to above 4%, is the most instructive recent demonstration of how quickly mark-to-market losses accumulate in long-duration positions.
With the 30-year yield at approximately 5.25%, the mark-to-market risk on long-duration positions is already significant. If yields move higher, the losses are immediate. Duration is not a future risk; it is a real-time pricing mechanism.
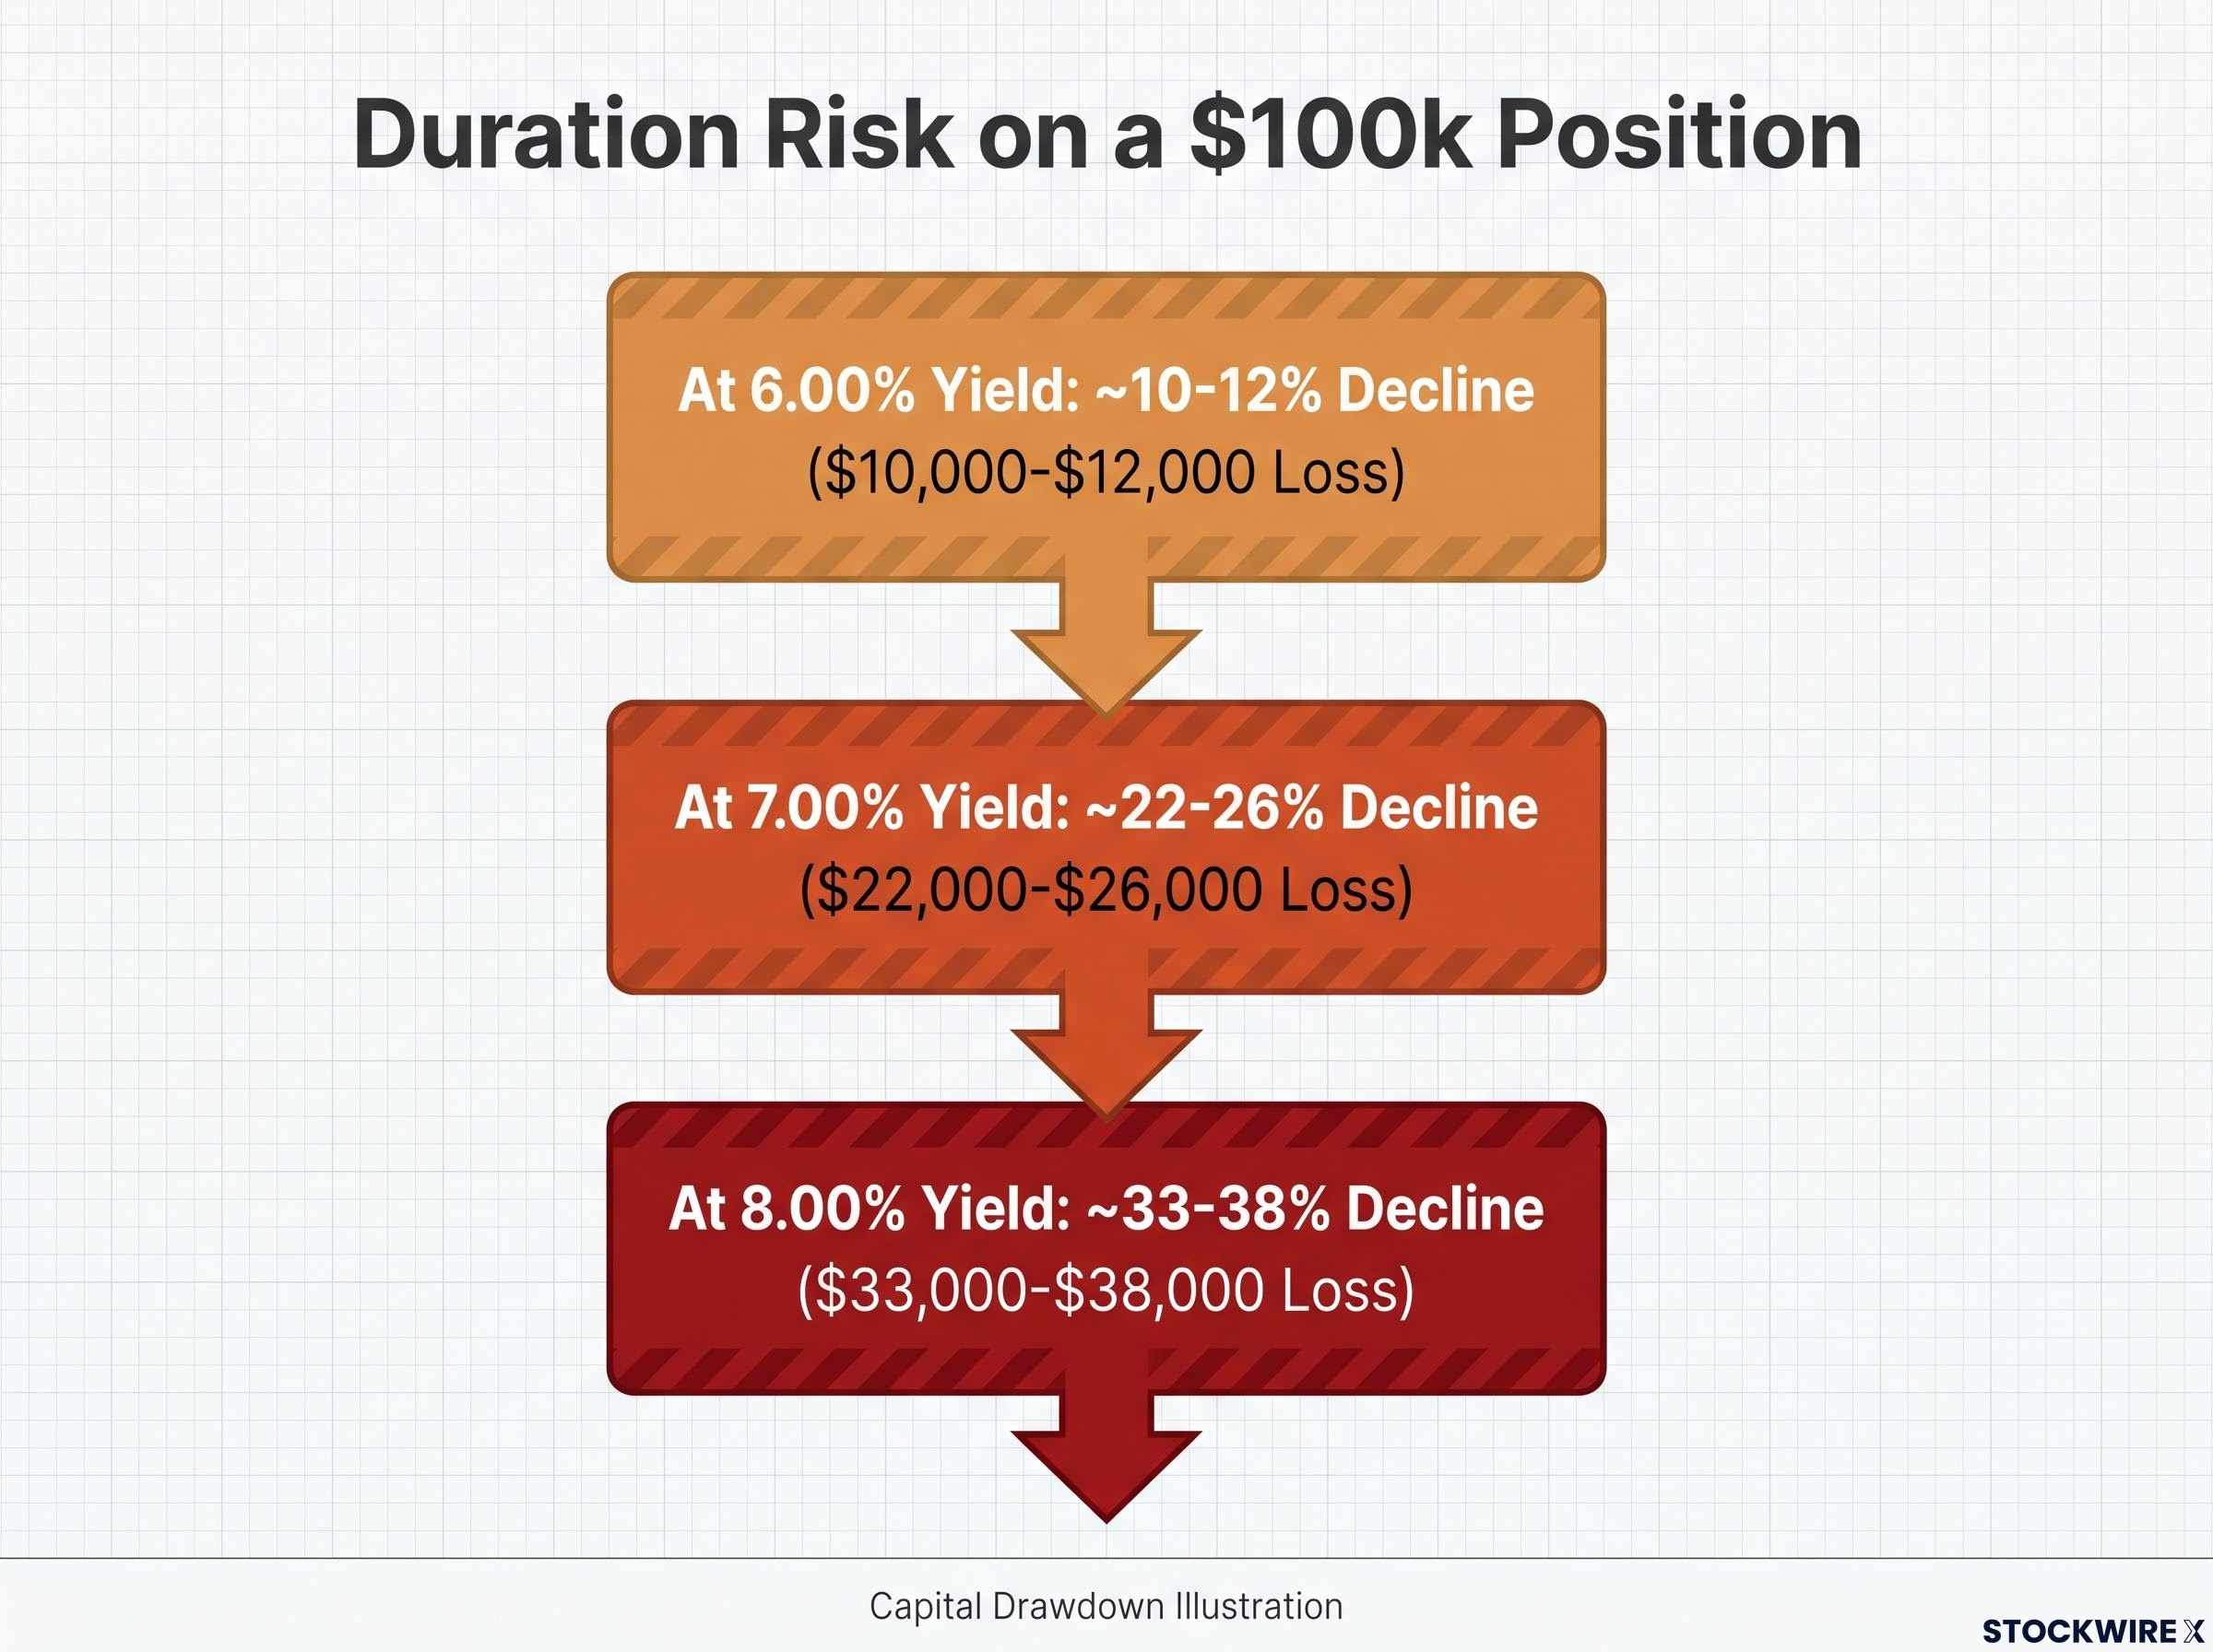
| Yield Scenario | Approximate Price Decline (%) | Estimated Loss on $100k Position |
|---|---|---|
| 30-year yield at 6.00% | ~10-12% | ~$10,000-$12,000 |
| 30-year yield at 7.00% | ~22-26% | ~$22,000-$26,000 |
| 30-year yield at 8.00% | ~33-38% | ~$33,000-$38,000 |
Those figures are illustrative based on long-duration bond price sensitivity, not precise predictions for any individual fund. But they capture the scale of the risk. A portfolio holding 20% in long Treasuries faces a materially different outcome from one holding 5% under any of these scenarios.
Skousen’s Sweden 1992 reference is the extreme case: yield spikes of that magnitude produced severe capital losses across fixed-income-heavy portfolios. The mechanism is the same whether yields move 75 basis points or 275.
The hidden duration in your bond fund
The direct exposure is the part most investors audit. The indirect exposure is where the risk concentrates unnoticed. Many investors hold long-duration Treasuries embedded in vehicles they do not think of as duration bets:
- Core bond funds: often hold 30-50% in Treasuries with weighted average durations of 6-8 years or more
- Balanced funds: the fixed-income sleeve frequently defaults to intermediate-to-long government bonds
- Target-date funds: the bond allocation increases as the target date approaches, often tilting toward longer-duration sovereigns
Your duration risk may be several times larger than your direct Treasury holdings suggest once embedded fund exposure is counted. One actionable check: pull the weighted average duration of every core bond, balanced, or target-date fund you hold and run it against the 6-8% yield scenarios above. If the implied price sensitivity exceeds what you would tolerate as a direct bond position, the fund-level allocation needs review.
Gold, Bitcoin, and the logic of hard assets in a fiscal dislocation scenario
The largest, most conservative reserve managers in the world have already made their call on this. Central banks have been persistent net buyers of gold for several years, with gold’s share in global reserves increasing materially relative to US Treasuries over the last decade, according to the World Gold Council Central Bank Gold Reserves Survey.
At the time of reporting, gold was changing hands at around $4,600 per ounce, a level that reflected a roughly 3% advance in the wake of the Treasury buyback announcement. That price reflects an institutional accumulation trend that preceded the retail conversation by years. When central banks diversify reserves away from Treasuries and toward gold, it tells you the largest sovereign wealth managers are hedging against exactly the fiscal and monetary risks this article describes.
The opportunity-cost reality is genuine. Holding non-yielding gold against a 4-5% yield environment is a meaningful trade-off. Gold is a volatility hedge and tail-risk hedge, not an income asset or a guaranteed linear beneficiary of every rate move. Sizing it appropriately requires acknowledging that cost.
- Institutional adoption: gold has central bank validation; Bitcoin does not at comparable scale
- Volatility profile: gold is materially less volatile than Bitcoin on every measured timeframe
- Income generation: neither asset generates yield (gold yield structures remain niche)
- Portfolio role: gold functions as a core hedge; Bitcoin is better treated as a speculative satellite
Bitcoin was priced at roughly $77,000 at the time of writing, having gained more than 22% across the prior seven days. It plays a comparable narrative role to gold (non-sovereign, limited supply, outside the traditional financial system) but with materially higher volatility and regulatory uncertainty.
Mark Skousen has argued that if the Treasury market were to face a genuine crisis of demand, with buyers absent from bond auctions, investors would likely seek refuge primarily in gold and, to a smaller degree, in Bitcoin. Within that extreme tail-risk scenario, Skousen has suggested gold could conceivably trade as high as $17,000 per ounce. This is explicitly a stress-scenario extreme, not a price target or base-case prediction.
The central-bank buying trend is the signal that matters most here. You are not speculating on a fringe scenario. You are following an institutional path that the world’s most conservative reserve managers have been walking for years.
The structural link between sovereign debt and gold allocation has been formalised by institutions including the ECB, BlackRock Investment Institute, and Goldman Sachs, each of which has explicitly connected rising government debt burdens in the US, UK, and eurozone to a durable reduction in the safe-haven and diversification value of government bonds, validating the central bank reserve shift away from Treasuries.
Seven moves for a portfolio built for a higher-rate-for-longer environment
These are not predictions. They are portfolio hygiene appropriate to the risk distribution the data currently describes, regardless of whether the 8% stress scenario materialises.
- Reduce unhedged long-duration nominal bond exposure. Unless you are explicitly liability-matching, long Treasuries and long corporates carry elevated mark-to-market risk in a structurally higher-rate environment.
- Audit portfolio-wide sovereign risk. Check not just direct Treasury holdings but exposure embedded in bond funds, balanced funds, and target-date vehicles. The hidden duration is where concentration builds unnoticed.
- Incorporate measured allocations to inflation-linked assets. Treasury Inflation-Protected Securities (TIPS), real-asset equities in energy and infrastructure, and select commodities offer structural inflation hedging.
- Add selective gold exposure with a clear understanding of opportunity cost. Gold is a tail-risk hedge, not an income asset. In a 4-5% yield world, non-yielding gold demands deliberate sizing.
- Treat Bitcoin as a speculative satellite, if used at all. Its volatility and regulatory risk profile mean it belongs as a small complement to core holdings, not a primary hedge.
- Run scenario analyses for 30-year yields at 6%, 7%, and 8%. Quantify the impact across bonds, equities, credit, and real estate holdings to understand actual downside exposure before a stress event occurs.
- Recognise that the risk is a process, not a single date. Gradual shifts in auction dynamics, fiscal policy, and geopolitical conditions change the distribution of outcomes long before any crisis headline appears. Markets reprice gradually before they reprice sharply. Early positioning is the structural advantage available to investors who have done the audit.
Separating the certain from the uncertain as yields move higher
Some of what lies ahead is genuinely unknown. How far yields move, how fast, whether Vermeulen’s technical breakout completes or stalls, and how geopolitical conditions evolve over the next twelve months are all variables no model can resolve with precision.
What is not uncertain is the structural architecture underneath. The $7 trillion annual refinancing requirement does not disappear. Fiscal deterioration is compounding, not stabilising. The Fed’s room to intervene aggressively is constrained by inflation conditions that have not resolved. Adrian Day’s position that any real resolution depends on governments restoring fiscal discipline, a development for which there is currently no evidence, describes the structural baseline, not a forecast.
If yields continue to rise, the cross-asset implications follow directly:
- Equities: lower valuation multiples as discount rates increase, with particular pressure on leveraged and long-duration growth models
- Credit: wider spreads and rising refinancing risk for weaker issuers, tightening conditions for leveraged activity
- Real estate: higher capitalisation rates reducing fair values, especially in rate-sensitive segments like commercial office
The question you face is not whether to predict the exact yield trajectory. It is whether your portfolio is stress-tested and positioned for a range of outcomes that the fiscal arithmetic, the technical signal, and the geopolitical constraint all suggest are plausible. The 30-year yield sits at 5.25% today. The data tells you the structural pressure is upward. The time to audit is before the repricing, not after.
This article is for informational purposes only and should not be considered financial advice. Investors should conduct their own research and consult with financial professionals before making investment decisions. Past performance does not guarantee future results. Financial projections referenced in this article are subject to market conditions and various risk factors. Stress-scenario figures, including yield targets and hypothetical asset prices, are speculative illustrations and subject to change based on market developments.
—