
National Australia Bank reported higher profits today, and its shares fell 5.3% anyway.
In bank earnings, the headline profit figure is rarely the number that matters most to professional investors. The market’s reaction to NAB’s Q3 FY26 results reflects a judgment about what the profit was built on, and what the forward indicators are signalling about credit quality and lending growth.
Here is what the numbers behind the numbers actually tell you, so you know exactly what the market was reacting to and which specific metrics to watch in the quarters ahead.
NAB’s Q3 profit rose, so why did investors sell?
The surface-level result looked fine. Cash earnings of $1.83 billion were 2% ahead of the first-half quarterly average and 5% higher than the same period a year earlier. On the statutory measure, net profit of $1.81 billion came in 32% above the first-half quarterly average and 4% above Q3 FY25.
But the mechanism behind that profit lift is the problem.
- Cash earnings: $1.83 billion (up 2% vs H1 quarterly average; up 5% vs Q3 FY25)
- Statutory net profit: $1.81 billion (up 32% vs H1 quarterly average; up 4% year-on-year)
- Credit impairment charges: $299 million (down 15% vs H1 quarterly average)
Lower credit impairment charges were responsible for almost all of the improvement, with revenue and lending volumes contributing little. Core underlying profit barely moved on the prior quarter. That means the headline growth is a credit-cost story, not a business momentum story.
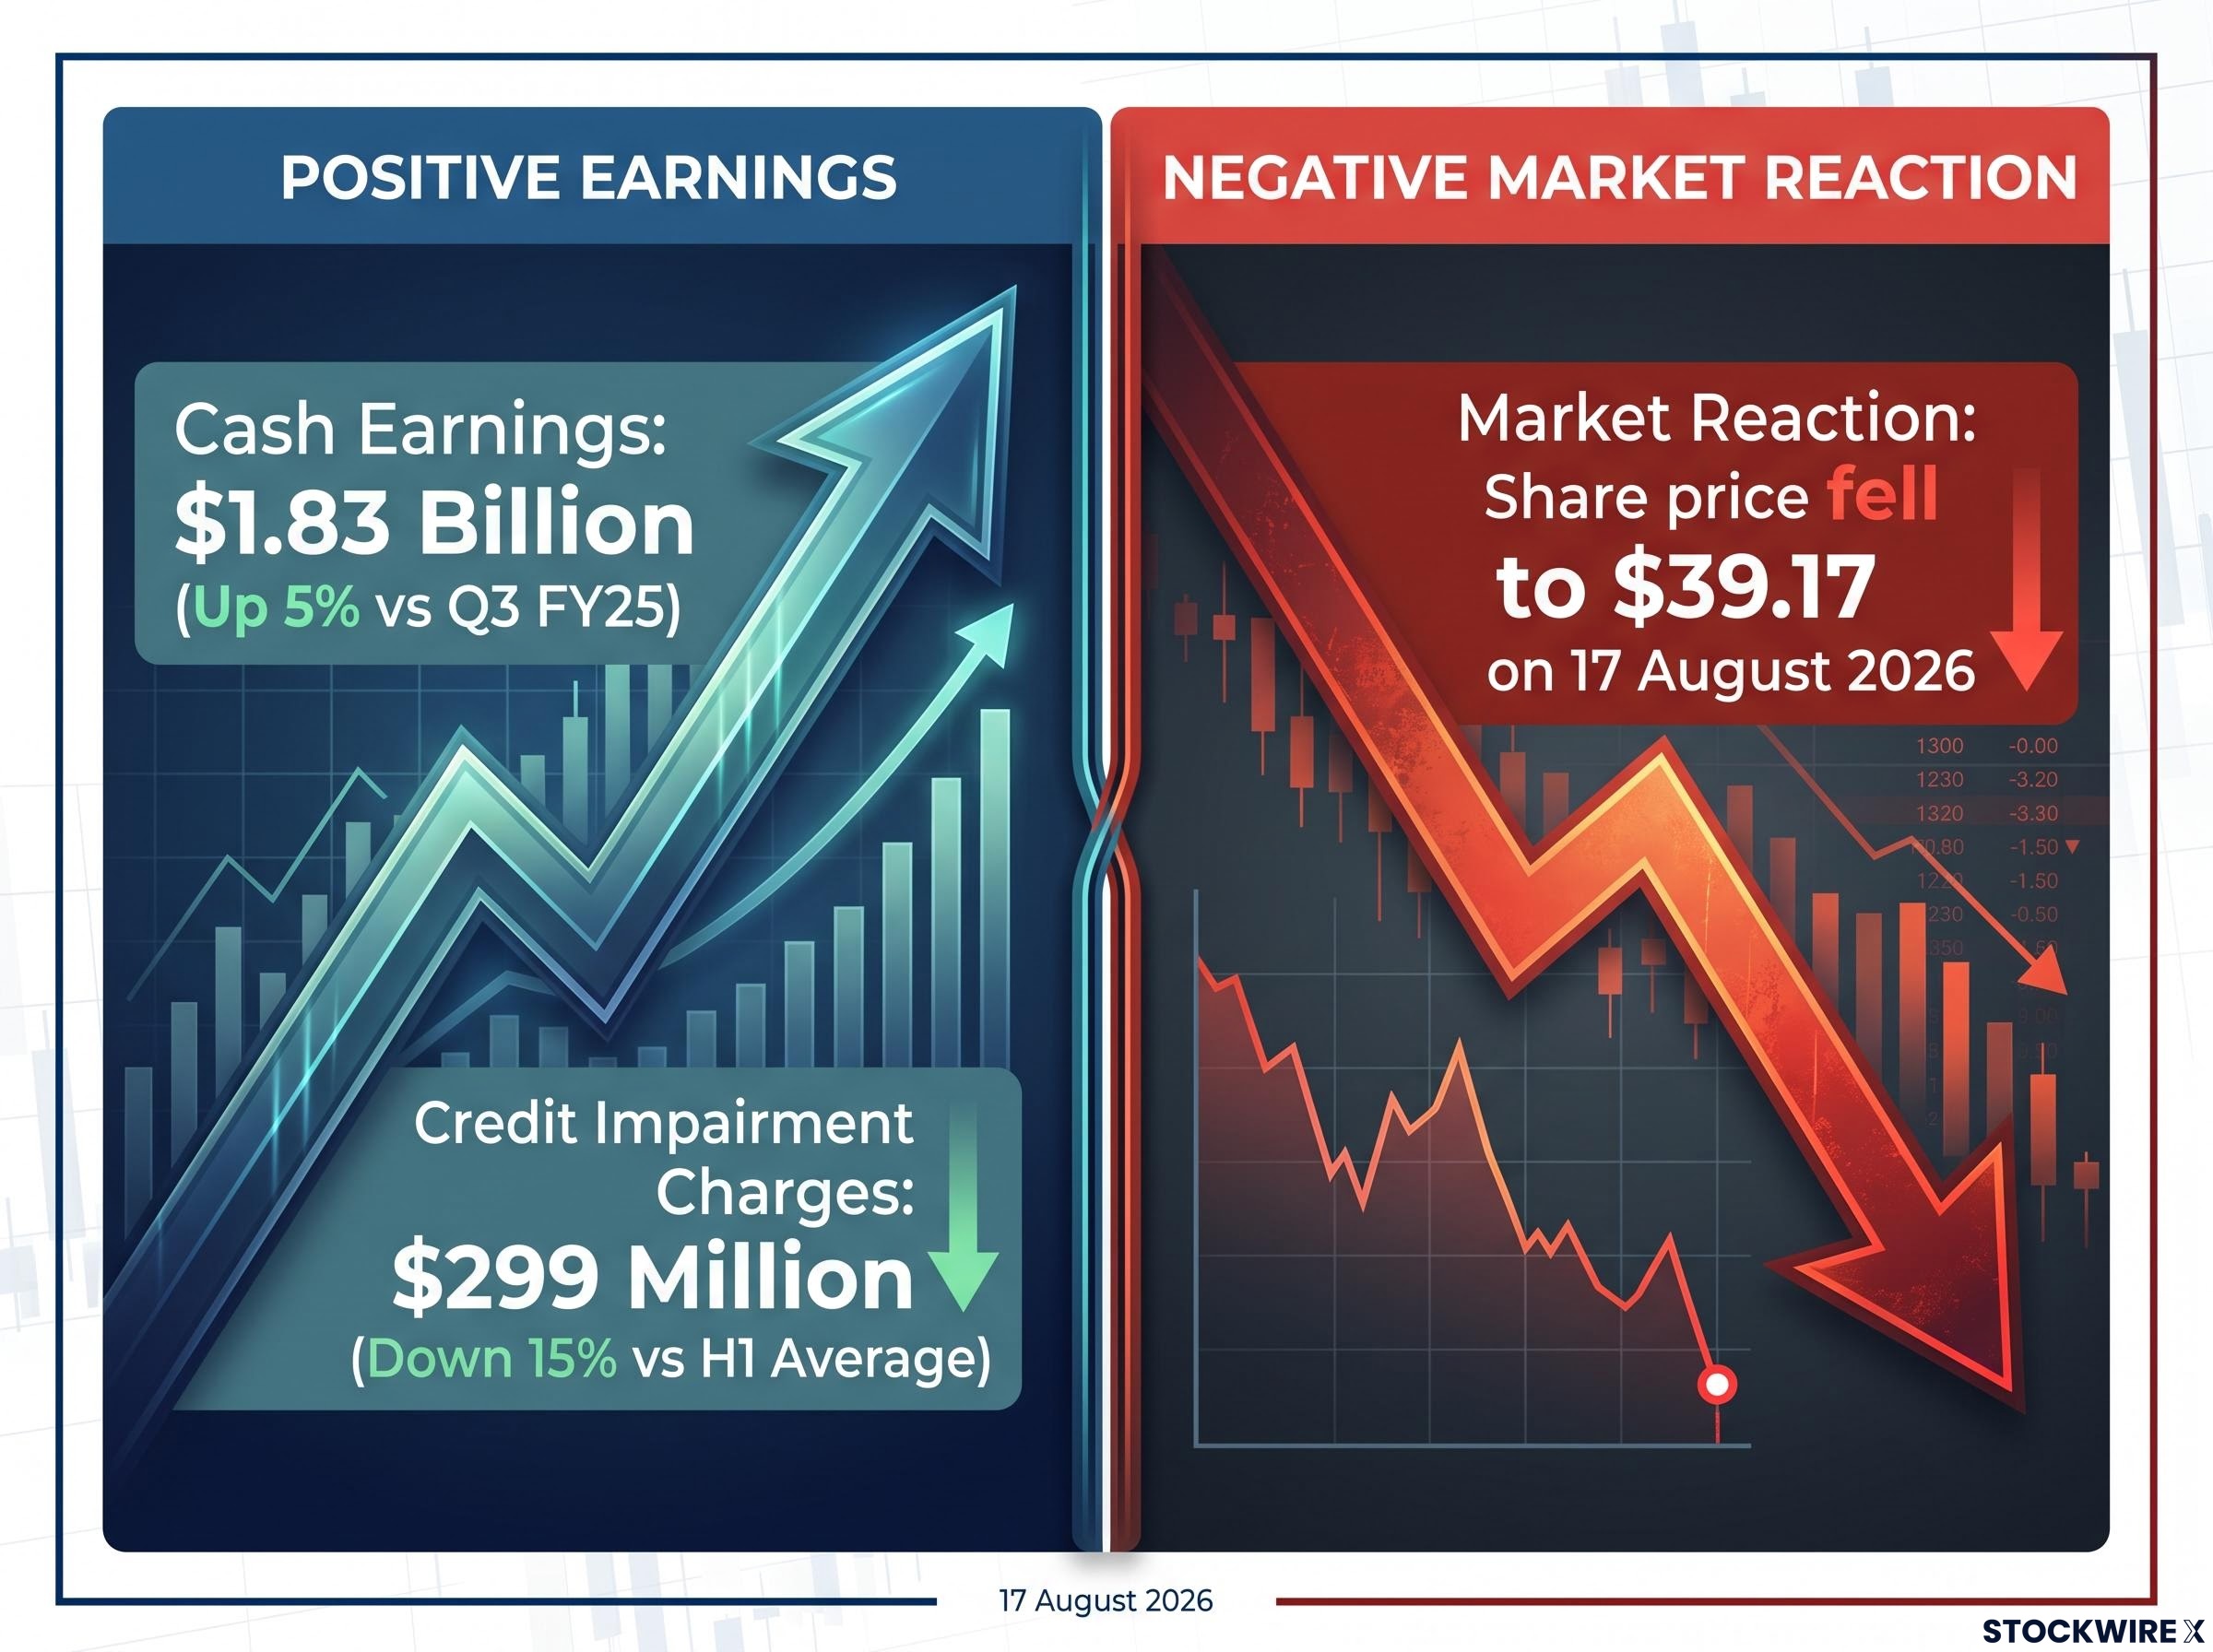
-5.3% to $39.17 on 17 August 2026, despite cash earnings rising 5% year-on-year
A profit lift built on lower bad-debt charges is less durable than one driven by actual lending growth or margin expansion. That distinction is precisely why the market sold the stock on a day the headline numbers looked acceptable.
The severity of the sell-off also reflects the sector valuation premium that Australian bank shares carried into August reporting season, where expensive multiples compress the tolerance for any result that fails to confirm the forward earnings trajectory implied by current prices.
When big ASX news breaks, our subscribers know first
What the collective provisions are quietly signalling
If the earnings composition raised questions, the balance sheet raised alarm bells.
Collective provisions are a forward-looking indicator, distinct from specific impairments against loans already identified as troubled. They represent management’s judgment about potential future losses across the broader loan book. When a bank increases its collective provisions, it is telling the market it sees more risk building in the pipeline, even if actual defaults have not yet materialised.
The mechanics of reading an ASX bank stock result extend well beyond the profit line; collective provisions, net interest margin direction, and capital adequacy each carry distinct informational content that the headline cash earnings figure routinely obscures.
The Q3 number was the centrepiece of the negative reaction.
| Metric | Q2 FY26 | Q3 FY26 | Change |
|---|---|---|---|
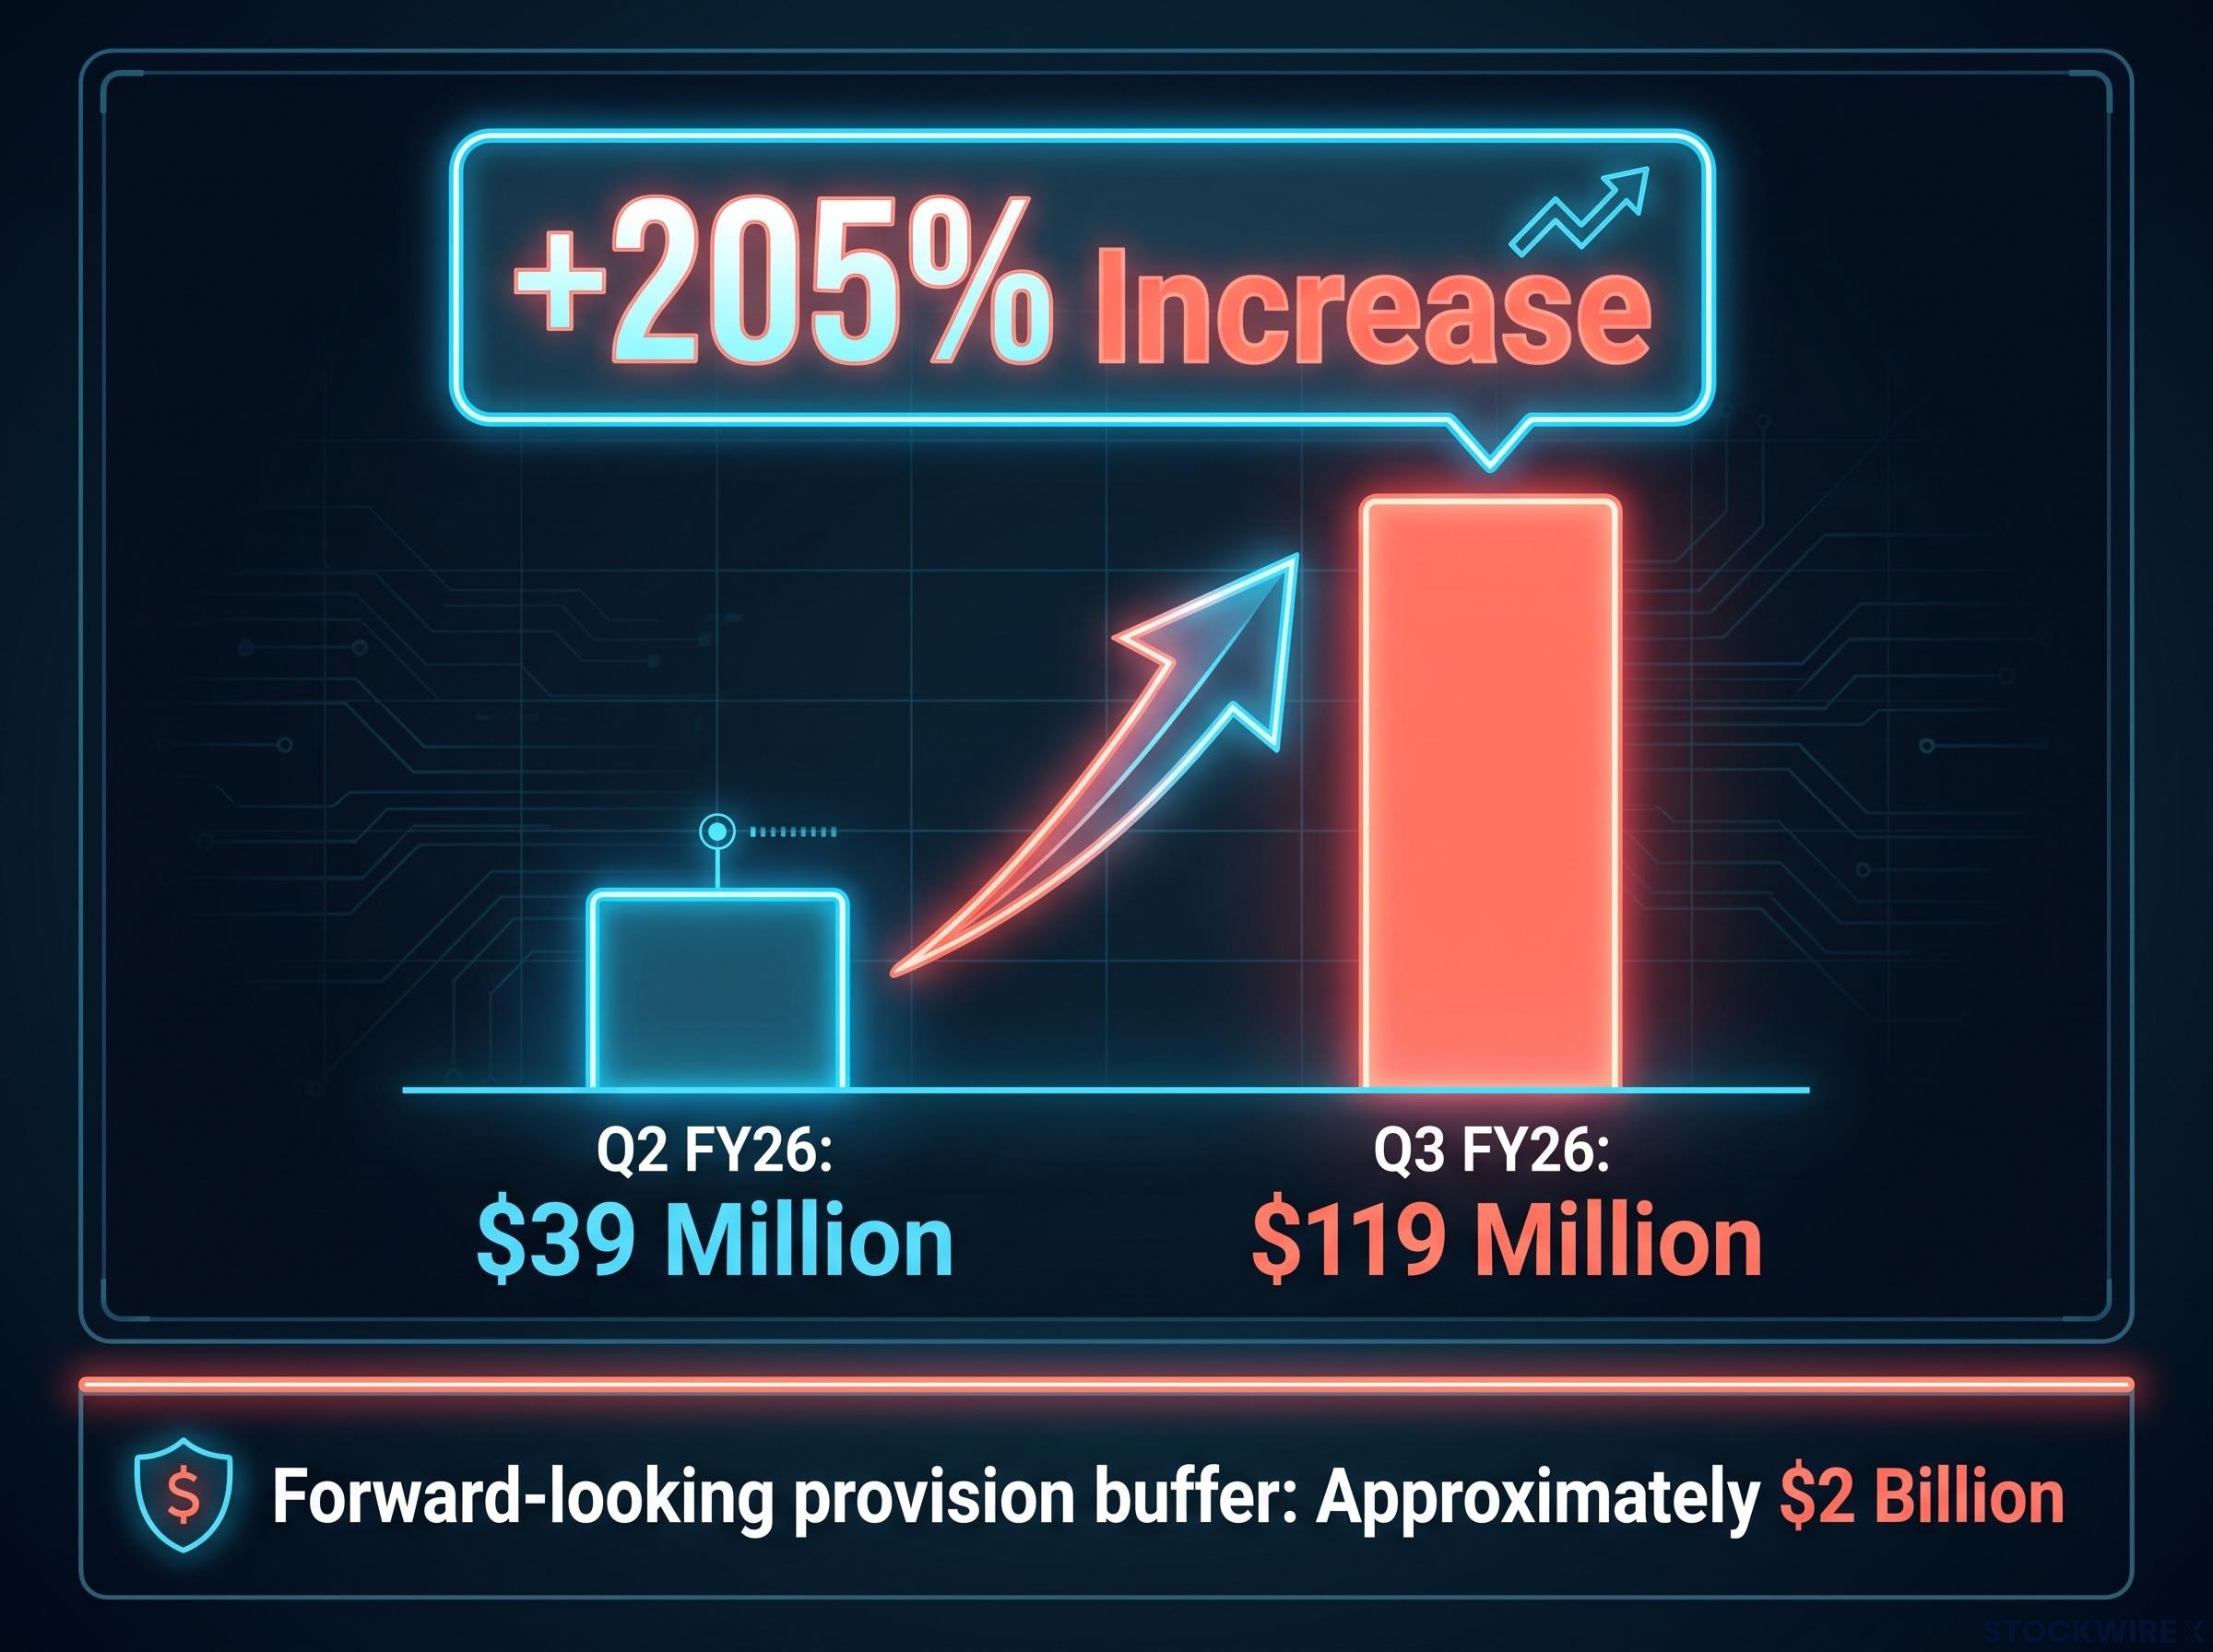
| Collective provision charge | $39 million | $119 million | +205% |
| Collective provisions / credit RWA | Not separately stated | 1.36% | — |
| Forward-looking provision buffer | — | Approximately $2 billion | — |
NAB attributed the larger collective provision charge to expansion in business lending volumes and a weakening in asset quality within the performing loan book. CEO Andrew Irvine reinforced the point with cautious language about the near-term environment and restrictive interest rate settings.
Why collective provisions matter more than the profit line right now
Collective provisions are a management judgment about future loan losses, not actual losses yet recorded. They sit apart from specific impairment charges, which relate to loans already identified as at risk of default.
The direction of travel matters as much as the absolute level. A collective provision charge that more than triples in a single quarter tells you that NAB’s own management sees meaningfully more credit risk building in the pipeline. That signal arrived before any wave of actual defaults has shown up in the numbers.
The mortgage pipeline is shrinking, and that matters for future earnings
The credit quality story is one pressure. The growth story is another, and it is coming from NAB’s most consumer-facing business.
Home loan application volumes dropped 15% in the June quarter relative to the March quarter
That 15% decline is a forward-looking revenue indicator, not a current-quarter revenue item. According to available data, the value of those applications was approximately 9% lower as well, underscoring that weaker demand was broad-based rather than concentrated in smaller loans.
The ABS lending indicators for the June Quarter confirm a broad softening in new home loan commitments across owner-occupier and investor segments, providing independent corroboration that the demand weakness visible in NAB’s mortgage pipeline reflects a market-wide trend rather than a bank-specific issue.
Three specific headwinds drove the decline:
- Elevated borrowing costs curtailing the capacity of prospective buyers to service new loans
- Budget-season property tax measures weighing on housing demand
- Cost-of-living pressures weighing on borrower confidence
Business lending provided a partial offset. The group’s business lending book expanded by 2% over the quarter, with the Business and Private Bank division contributing 4% growth. The net interest margin registered 1.79%, sitting 2 basis points below the first-half average.
But the mortgage pipeline is where the dual pressure becomes visible. The existing book may deteriorate while the incoming pipeline is also weakening. A 15% drop in mortgage applications tells you that NAB’s core consumer growth engine is slowing, and that the revenue contribution from new lending is likely to shrink in coming quarters.
Capital strength provides a buffer, but does not change the narrative
One genuine positive deserves acknowledgment. NAB’s capital position strengthened during the quarter, and that matters for dividend sustainability and the bank’s capacity to absorb future credit losses.
| Metric | March 2026 | August 2026 (Q3 FY26) | Change |
|---|---|---|---|
| CET1 ratio (Level 2) | 11.65% | 11.93% | +28 bps |
| Headroom above 11.25% target | 40 bps | 68 bps | +28 bps |
| Deposit growth (quarterly) | — | +2% | — |
The Common Equity Tier 1 (CET1) ratio, a measure of a bank’s core capital as a proportion of its risk-weighted assets, advanced because the pace of earnings generation outstripped growth in risk-weighted assets. The bank’s deposit book also expanded by 2% across the quarter.
A CET1 ratio sitting 68 basis points above NAB’s own target means the bank has meaningful room to absorb losses before dividends or capital adequacy become concerns. But capital strength is a resilience story, not a counter-argument to the credit and growth concerns raised in earlier sections. It does not resolve the forward-looking questions that drove today’s sell-off.
What the four metrics every bank analyst watched in this result
Professional investors tracked four interconnected signals in this result, and together they explain the sell-off more coherently than the profit number alone.
- Earnings quality: The headline profit improvement was built on a fall in bad-debt charges rather than any genuine expansion in revenues or underlying business activity. With core profit essentially unchanged on the prior quarter, the reported figure overstates the strength of the underlying franchise.
- Collective provisions: The quarterly charge jumped from $39 million in Q2 to $119 million in Q3, a move that reflects NAB’s own internal assessment that the risk profile of its loan book is deteriorating ahead of any observable default wave.
- Mortgage pipeline: A 15% application volume decline points to slower future lending growth in a core profit engine.
- Macro headwinds: Restrictive RBA rates, federal budget property tax changes, and geopolitical tensions were cited by CEO Andrew Irvine as creating customer uncertainty across both retail and business books.
When all four signals move in a concerning direction simultaneously, market participants will often sell even a nominally positive profit result. That is exactly what happened on 17 August 2026. This framework is directly transferable to future bank earnings seasons; the same four signals apply when you are evaluating CBA, ANZ, or Westpac results.
The pattern visible in this result echoes the May 2026 reporting season, when the Big Four shed between 7% and 14% after collective provision builds and NIM misses reset sector sentiment, establishing a market that has since remained highly sensitive to any forward-looking credit quality signal.
What changes from here, and what to keep watching
Today’s 5.3% decline reflects a risk repricing, not a confirmed deterioration. The resolution depends on whether the next one to two quarters of data confirm or contradict the signals embedded in this result.
Three specific developments will determine whether the cautious read holds:
- RBA interest rate trajectory: How long rates remain restrictive directly affects borrower capacity and mortgage demand. Any movement toward easing would relieve pressure on both the application pipeline and asset quality.
- Next quarter’s collective provision charge: A further increase would confirm the trend and likely trigger additional selling. A stabilisation would challenge it.
- September quarter mortgage application data: Does the 15% decline stabilise, or deepen further?
CEO Andrew Irvine described the medium-term outlook as constructive despite near-term caution. The market is waiting to see whether the data supports that view.
The share price reaction is a pricing-in of risk, not a verdict. The evidence to confirm or challenge that repricing arrives with the next set of quarterly numbers.
For readers wanting to see the same analytical framework applied to a comparable result, our full explainer on CBA’s May 2026 sell-off dissects how a collective provision build triggered a 10% single-session decline despite a profit increase, with broker price target implications worked through in detail.
This article is for informational purposes only and should not be considered financial advice. Investors should conduct their own research and consult with financial professionals before making investment decisions.