Most investors see a Middle East headline and reach for the same assumption: conflict in the Gulf means a stronger US Dollar. It is an intuition that feels right, and for decades it was. But ING strategists Francesco Pesole, Frantisek Taborsky, and Chris Turner have argued that the clearest currency expressions of Gulf-region risk have migrated elsewhere entirely, into relative-value pairs that most retail investors never check.
The timing matters. US-Iran tensions remain unresolved, Strait of Hormuz risk continues to surface in analyst commentary, and the old playbook, where oil spikes and the Dollar rallies in lockstep, keeps shaping how people interpret the moves they see on screen. Two structural forces have quietly rewritten that playbook: the transformation of the US energy position and a prolonged cycle of headline fatigue among traders who have watched Gulf scares come and go without lasting supply disruption.
Here is what changes after you read this. The next time a Gulf headline crosses your screen, you will know which currency pairs to watch first, which to discount, and why the move you see in EUR/USD may not be where the real action is. More importantly, you will understand the logic well enough to apply it to any future episode, not just the current one.
The assumption most investors make about Middle East risk and the Dollar
The intuition has a real foundation. For decades, Gulf tensions pushed oil prices higher. Oil was denominated in US Dollars, so global buyers needed more Dollars to purchase it. That reinforced the currency’s safe-haven status during every energy crisis from the 1970s oil embargo through the 2000s Iraq War premium.
The relationship held most cleanly when the US was a net energy importer, structurally vulnerable to the same supply shocks it was pricing. A Gulf disruption meant higher costs for American consumers and businesses, but the Dollar still strengthened because global demand for the currency to settle oil trades overwhelmed the domestic drag.
OPEC’s structural decline from controlling over 50% of global crude output to roughly 27-28% after the UAE exit is a parallel force reinforcing the same theme: the market architecture that made Gulf tension reliably bullish for oil, and reflexively bullish for the Dollar, no longer operates as it did in the 1970s.
That vulnerability has changed. The shale boom and the build-out of US liquefied natural gas (LNG) exports, where natural gas is cooled and shipped internationally, have repositioned the US as a net energy exporter in key categories. The country is no longer a clear loser from higher oil and gas prices. According to ING strategists, the threshold for oil price moves to re-establish a meaningful, direct link with the Dollar is now considerably elevated, and the influence of Gulf developments tends to register more clearly in G10 relative-value pairs than in broad USD crosses.
ING strategists describe the threshold for oil price movements to rebuild a meaningful, direct relationship with the US Dollar as “quite elevated.”
Using the Dollar as your primary proxy for Middle East risk exposure is now a blunt instrument. It can mislead you on both the direction and the magnitude of what is actually happening in energy-linked currencies, which matters when you are trying to interpret or position around your own FX exposure.
When big ASX news breaks, our subscribers know first
Why the US energy transformation changed the FX equation
When oil rises on Middle East conflict, two effects hit the Dollar at the same time:
- Risk-off safe-haven buying. Investors sell equities and high-beta currencies (those more sensitive to global growth) and rotate into perceived safe havens, including USD. This is Dollar-positive.
- Improved terms of trade for the US as a net energy exporter. Higher oil and gas prices support US energy-sector profits, capital expenditure, and trade balances. This is also Dollar-supportive, but less urgently so than the damage higher energy prices inflict on large importers in the euro area and Asia.
These two forces partially cancel each other’s signal. Higher oil is simultaneously negative for major importers, which can weaken their currencies even when the Dollar’s own response is modest. The result is apparent USD strength that is often importer weakness in disguise. The net FX signal from a Gulf-driven oil spike is smaller and less directional than it used to be.
When “another Middle East flare-up” stops moving markets
The structural shift has a behavioural complement. Repeated cycles of Gulf-related scares that did not produce lasting supply disruption have conditioned traders to discount incremental news. Middle East tensions have started to lose their grip on markets, with both crude and USD coming under pressure when investors reassess the likelihood of prolonged disruption.
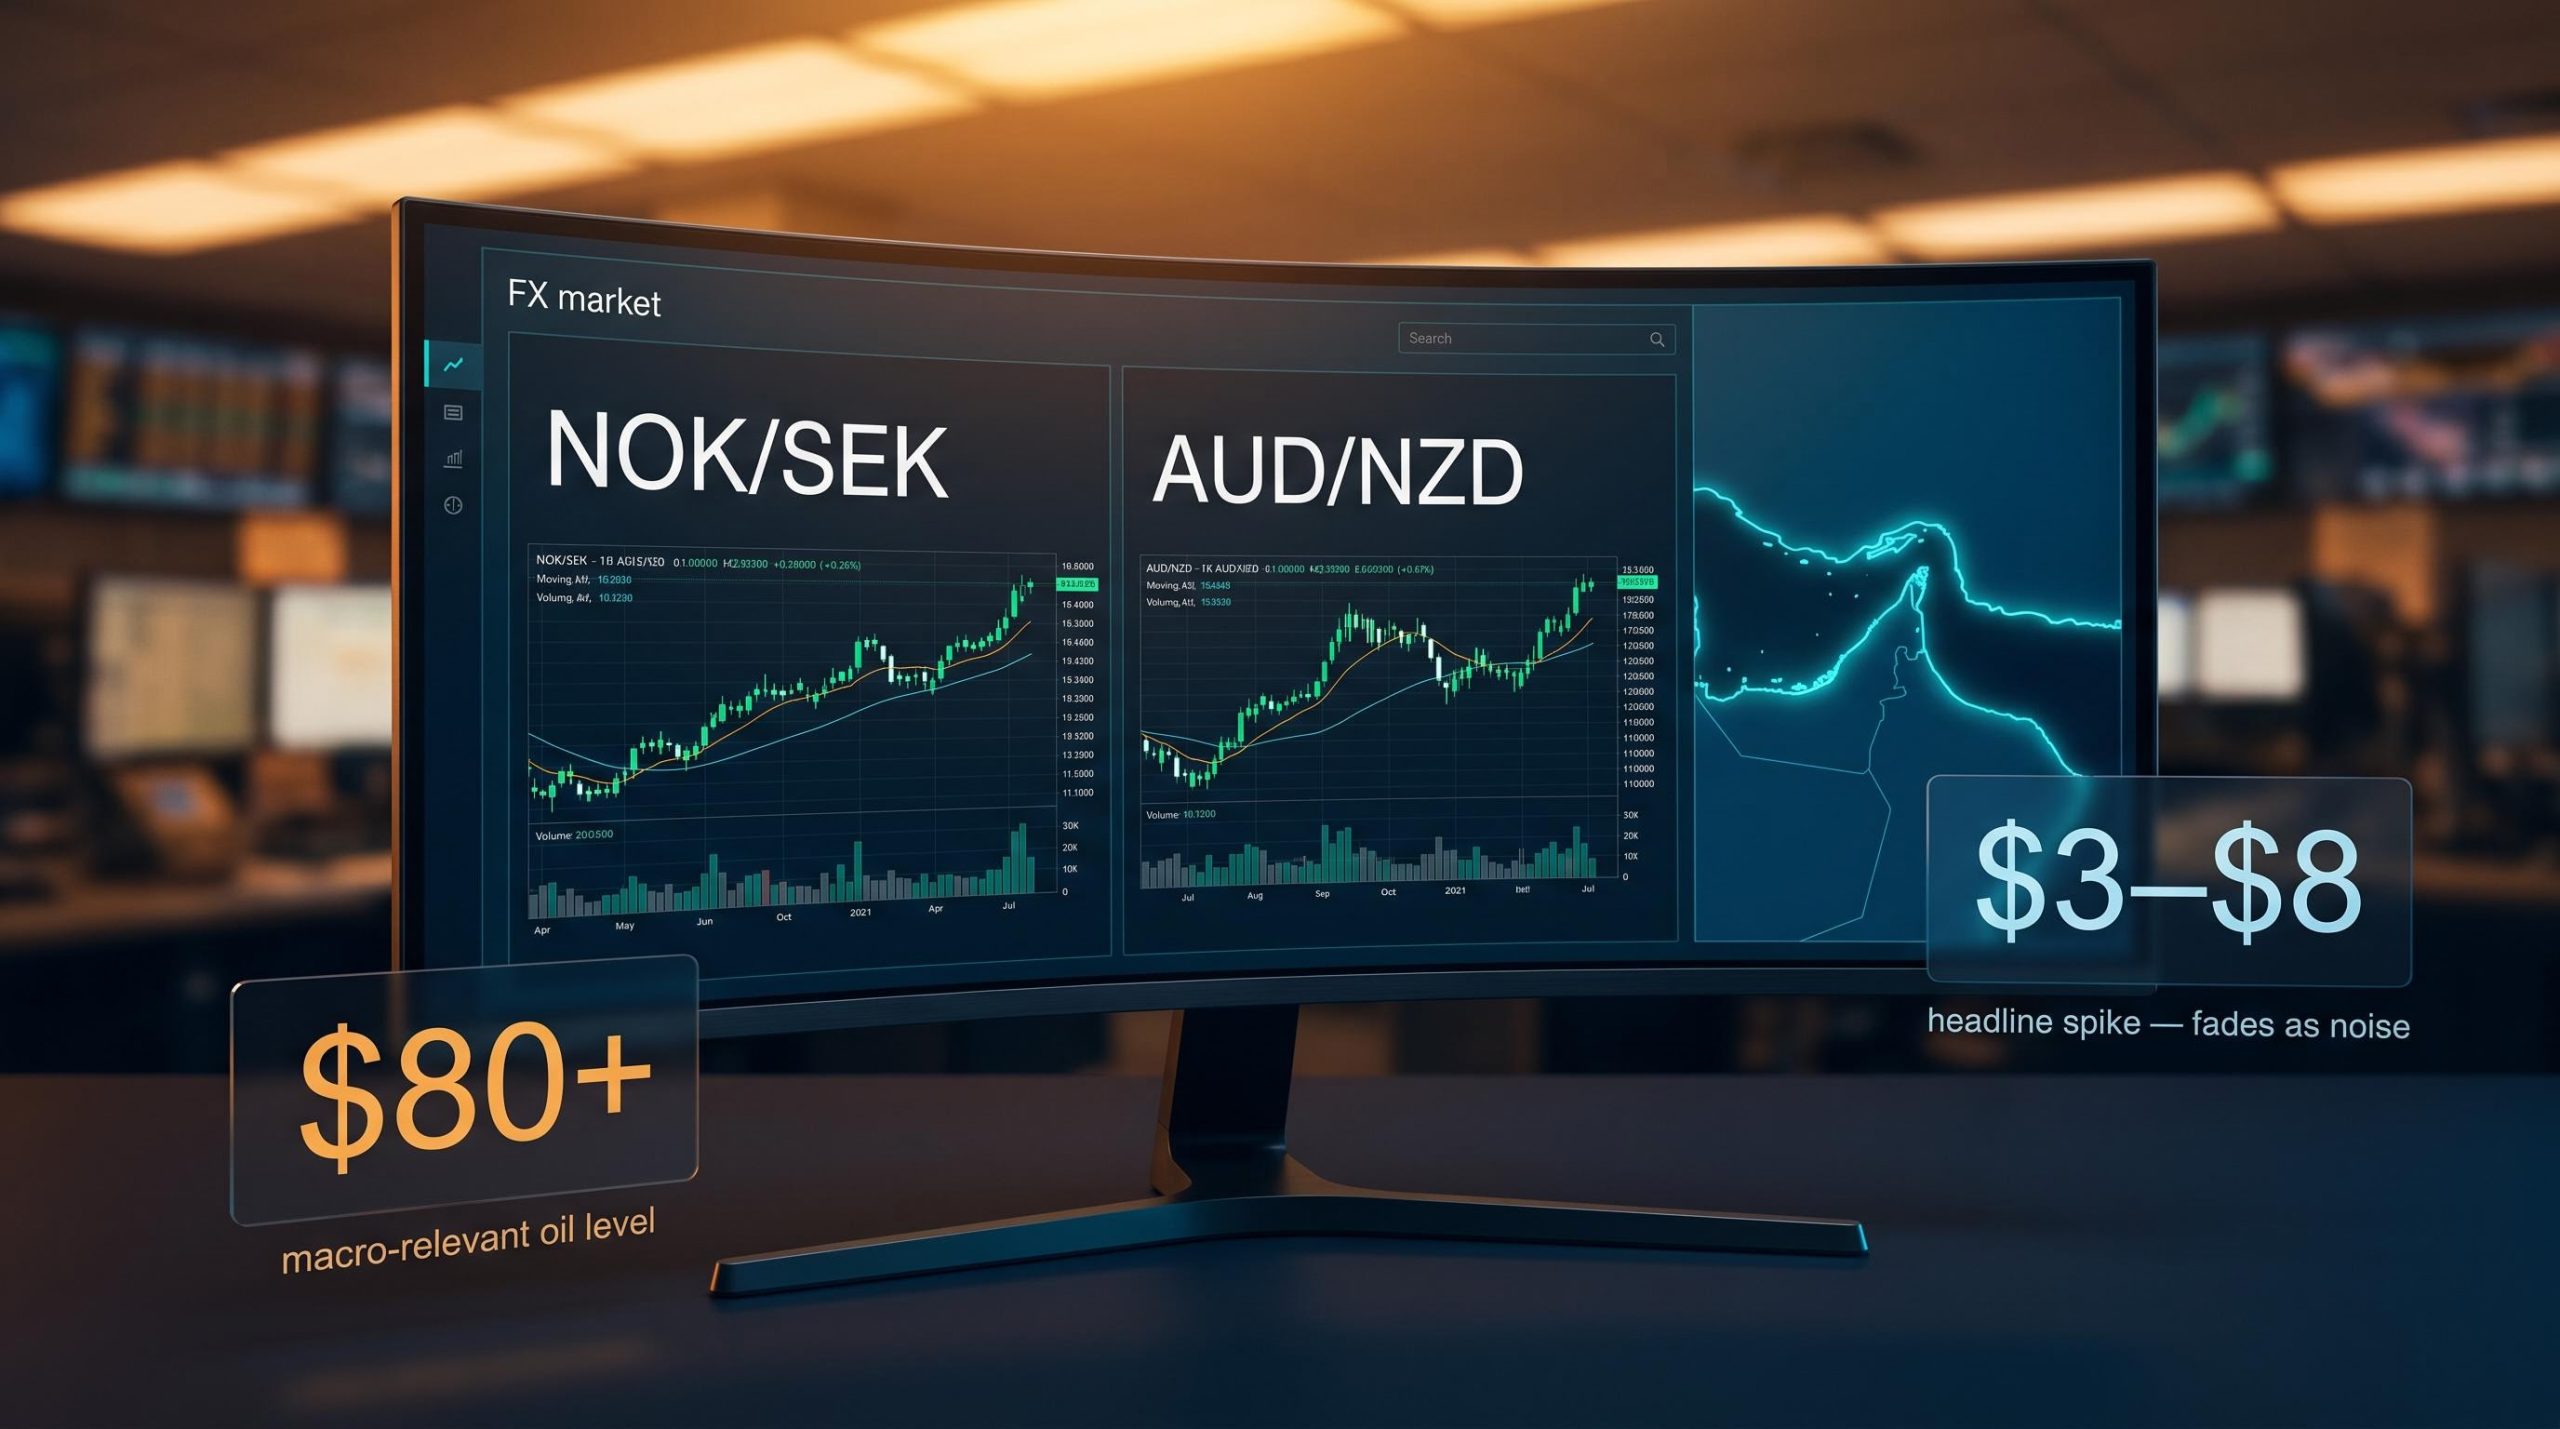
Smaller oil moves of $3-$8 around a conflict headline frequently reverse once fears ease, and FX markets treat them as noise rather than regime-changing signals. ING analysis indicates that only larger, sustained oil moves materially change the macro outlook and reliably strengthen the Dollar. The threshold for sustained trader response is evidence of credible physical supply impact, not diplomatic deterioration alone.
The practical implication for you: a $5 Brent spike on a Gulf headline should not, by itself, trigger a significant FX repositioning. You need to assess whether the move has the size and staying power to cross the macro-relevance threshold before it tells you anything useful about currencies.
The two channels that actually transmit Gulf risk into FX
If the simple “oil up, Dollar up” trade has weakened, what actually moves currencies when Gulf tensions escalate? Two distinct transmission channels do the work, and distinguishing between them tells you how long a move is likely to last and where it will show up most clearly.
The risk-sentiment channel operates through investor behaviour. Conflict risk drives selling in equities and high-beta currencies and buying in safe havens: USD, Swiss franc (CHF), and Japanese yen (JPY). This produces broad emerging-market and Asia FX weakness that is sentiment-driven rather than oil-driven. Asia FX (Indian rupee, Indonesian rupiah, Thai baht, Korean won) tends to weaken against USD when Middle East conflict pushes risk appetite lower.
The energy price shock channel operates through economics. A supply disruption premium, the extra cost markets add to prices when they expect supply to be restricted, raises oil and LNG prices. That improves terms of trade (the ratio between export prices and import prices) for net energy exporters and worsens them for importers, flowing through to relative currency strength and weakness.
These two channels can produce similar-looking FX outcomes. USD up, emerging-market currencies down. But the mechanism underneath matters for how you read it. Risk-sentiment moves tend to be faster and shorter-lived; they reverse when headlines calm. Energy-price-shock moves tied to genuine supply disruption can persist for weeks, producing more durable relative-value trades in exporter-versus-importer pairs.
The Hormuz risk premium has proven more durable than headline-driven reversals suggest: VLCC daily hire rates tracking around $110,000 per day and a two-year IEA supply-chain recovery timeline both indicate that the energy price shock channel can remain active long after diplomatic signals calm sentiment-driven FX moves.
ING strategists specifically flagged the Strait of Hormuz as the most consequential supply chokepoint to monitor, the point where the energy price shock channel becomes most relevant. The euro and yen fall against USD when both channels reinforce each other: safe-haven demand pulling capital into the Dollar while energy import concerns simultaneously pressure EUR and JPY.
EIA data on Strait of Hormuz oil flows puts the stakes in concrete terms: in the first half of 2025, roughly 20.9 million barrels per day passed through the strait, representing approximately 20% of global petroleum liquids consumption, which is why a credible physical threat to that chokepoint triggers a qualitatively different FX response than diplomatic posturing alone.
| Attribute | Risk-sentiment channel | Energy price shock channel |
|---|---|---|
| Trigger | Escalation headlines, diplomatic breakdown | Physical supply threat, infrastructure damage |
| Primary FX beneficiaries | USD, CHF, JPY | NOK, CAD, AUD (energy exporters) |
| Primary FX losers | EM currencies, high-beta G10 (SEK, NZD) | EUR, JPY, Asia FX (energy importers) |
| Typical duration | Days to weeks; reverses when sentiment stabilises | Weeks to months; persists while supply is disrupted |
Diagnosing which channel is dominant tells you whether the move you are watching is likely to fade or persist, and whether the trade is in USD crosses or in the relative-value pairs covered next.
The pairs where energy geopolitics actually show up: NOK/SEK and AUD/NZD
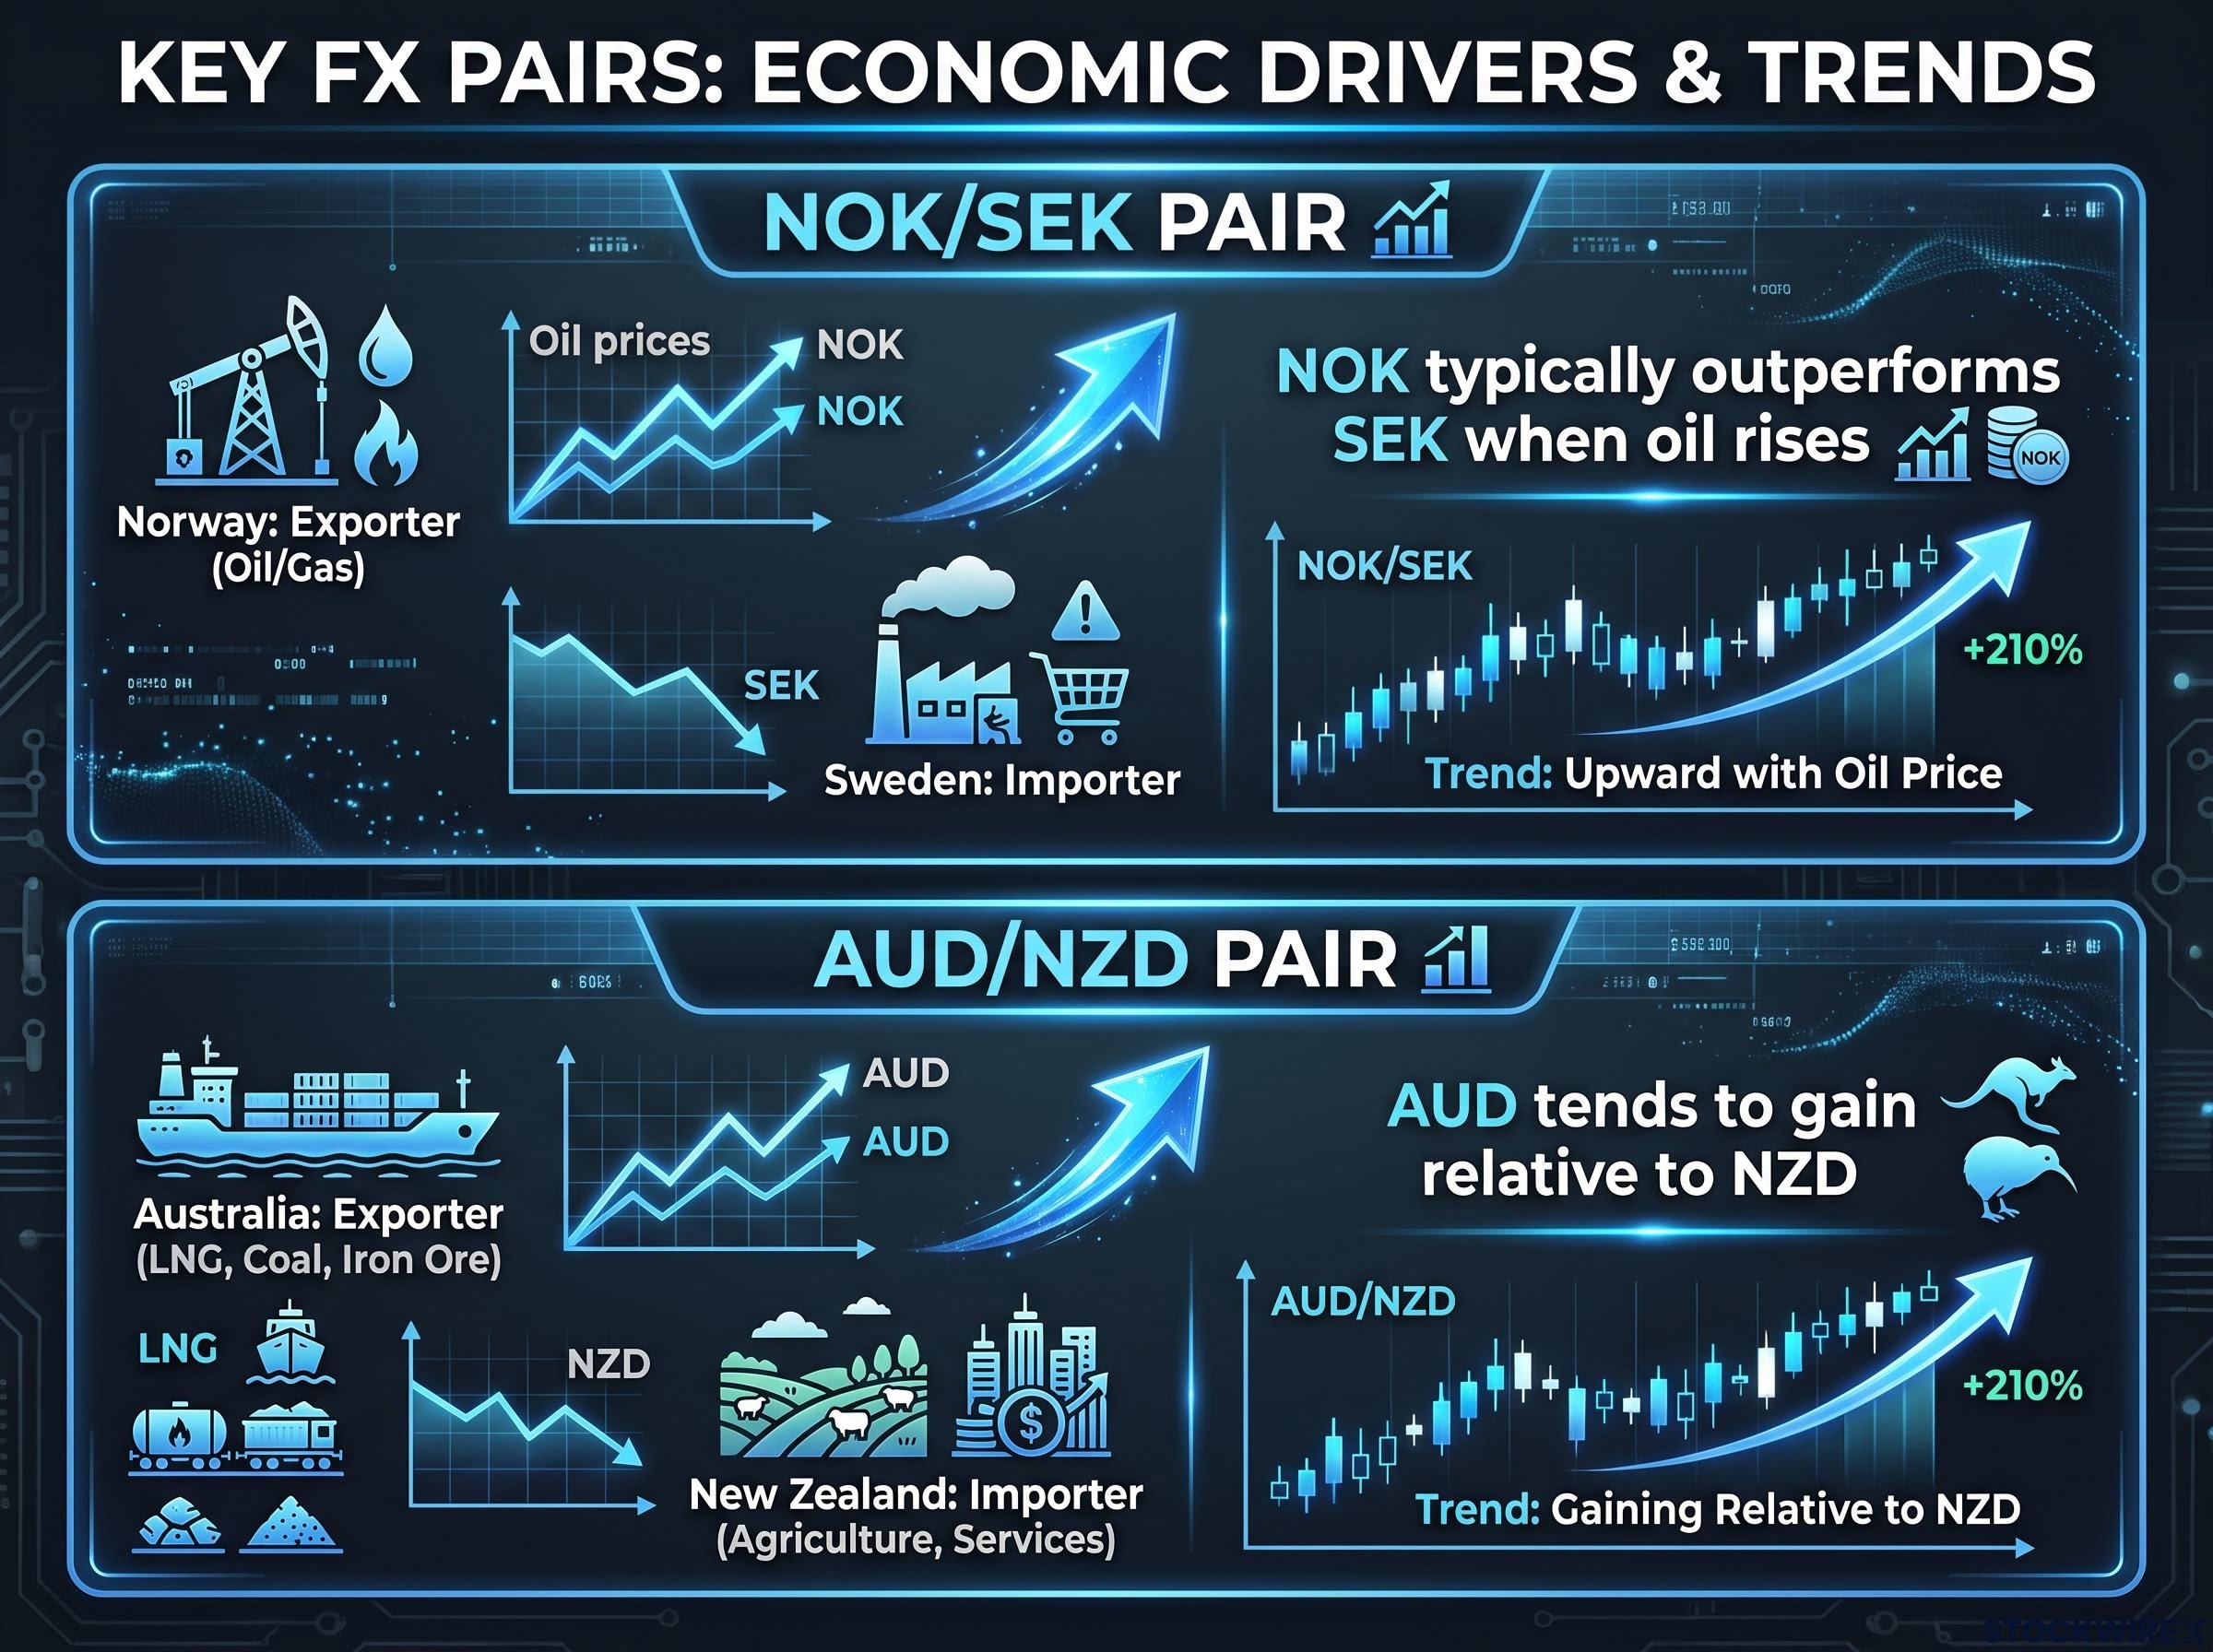
ING strategists have singled out NOK/SEK and AUD/NZD as the pairs where energy market dynamics remain most consistently reflected. These pairs are analytically useful because they strip out the confounding safe-haven dynamic that complicates USD crosses, isolating the energy transmission more cleanly.
NOK/SEK: Scandinavia’s built-in energy trade
Norway is a major exporter of oil and gas to Europe. When Brent and LNG prices rise, Norway’s external balances and fiscal position improve. Sweden is an energy importer; higher energy prices raise its import costs and consumer inflation, pressuring growth and the krona.
The pair isolates the energy terms-of-trade differential between two institutionally similar, geographically proximate economies. Everything else, governance quality, monetary policy frameworks, regional risk, is roughly comparable. What differs is the energy exposure.
- Exporter currency: NOK (Norwegian krone)
- Importer currency: SEK (Swedish krona)
- Key commodity linkage: North Sea oil and European natural gas
- Direction when oil rises on Gulf tensions: NOK typically outperforms SEK; NOK/SEK rises
When tensions ease and oil falls, the move typically retraces. That symmetry is part of what makes the pair a cleaner signal than USD crosses, where safe-haven flows, interest rate differentials, and reserve-currency effects blur the energy story.
AUD/NZD: The Asia-Pacific energy and commodity differential
Australia is a large exporter of LNG, coal, and iron ore. Its LNG and coal exports are especially sensitive to global energy and shipping risks connected to Middle Eastern dynamics, including disruptions to tanker routes. New Zealand’s exports are weighted toward agriculture and services, giving it less direct leverage to energy shocks.
- Exporter currency: AUD (Australian dollar)
- Importer currency: NZD (New Zealand dollar)
- Key commodity linkage: LNG, thermal coal, and bulk commodity shipping routes
- Direction when oil rises on Gulf tensions: AUD tends to gain relative to NZD
The Canadian dollar (CAD) also rallies alongside USD when Middle East tension lifts oil prices, with high-beta currencies like SEK and NZD among the underperformers. But for your purposes, AUD/NZD and NOK/SEK offer something EUR/USD cannot: a direct read on whether the energy market is actually repricing supply risk, without the noise of reserve-currency effects and broad safe-haven flows contaminating the signal.
Institutional thinking on NOK and AUD positioning aligns with this framework: UBS formally recommended the Norwegian krone, Australian dollar, and New Zealand dollar as preferred non-dollar holdings in June 2026, citing the same energy export dynamics and carry characteristics that make these currencies structurally responsive to Gulf-driven commodity moves.
A practical decision sequence for reading Middle East FX headlines
The framework above becomes most useful when you convert it into a repeatable mental process. Here is a four-step sequence you can run the next time a Gulf headline appears:
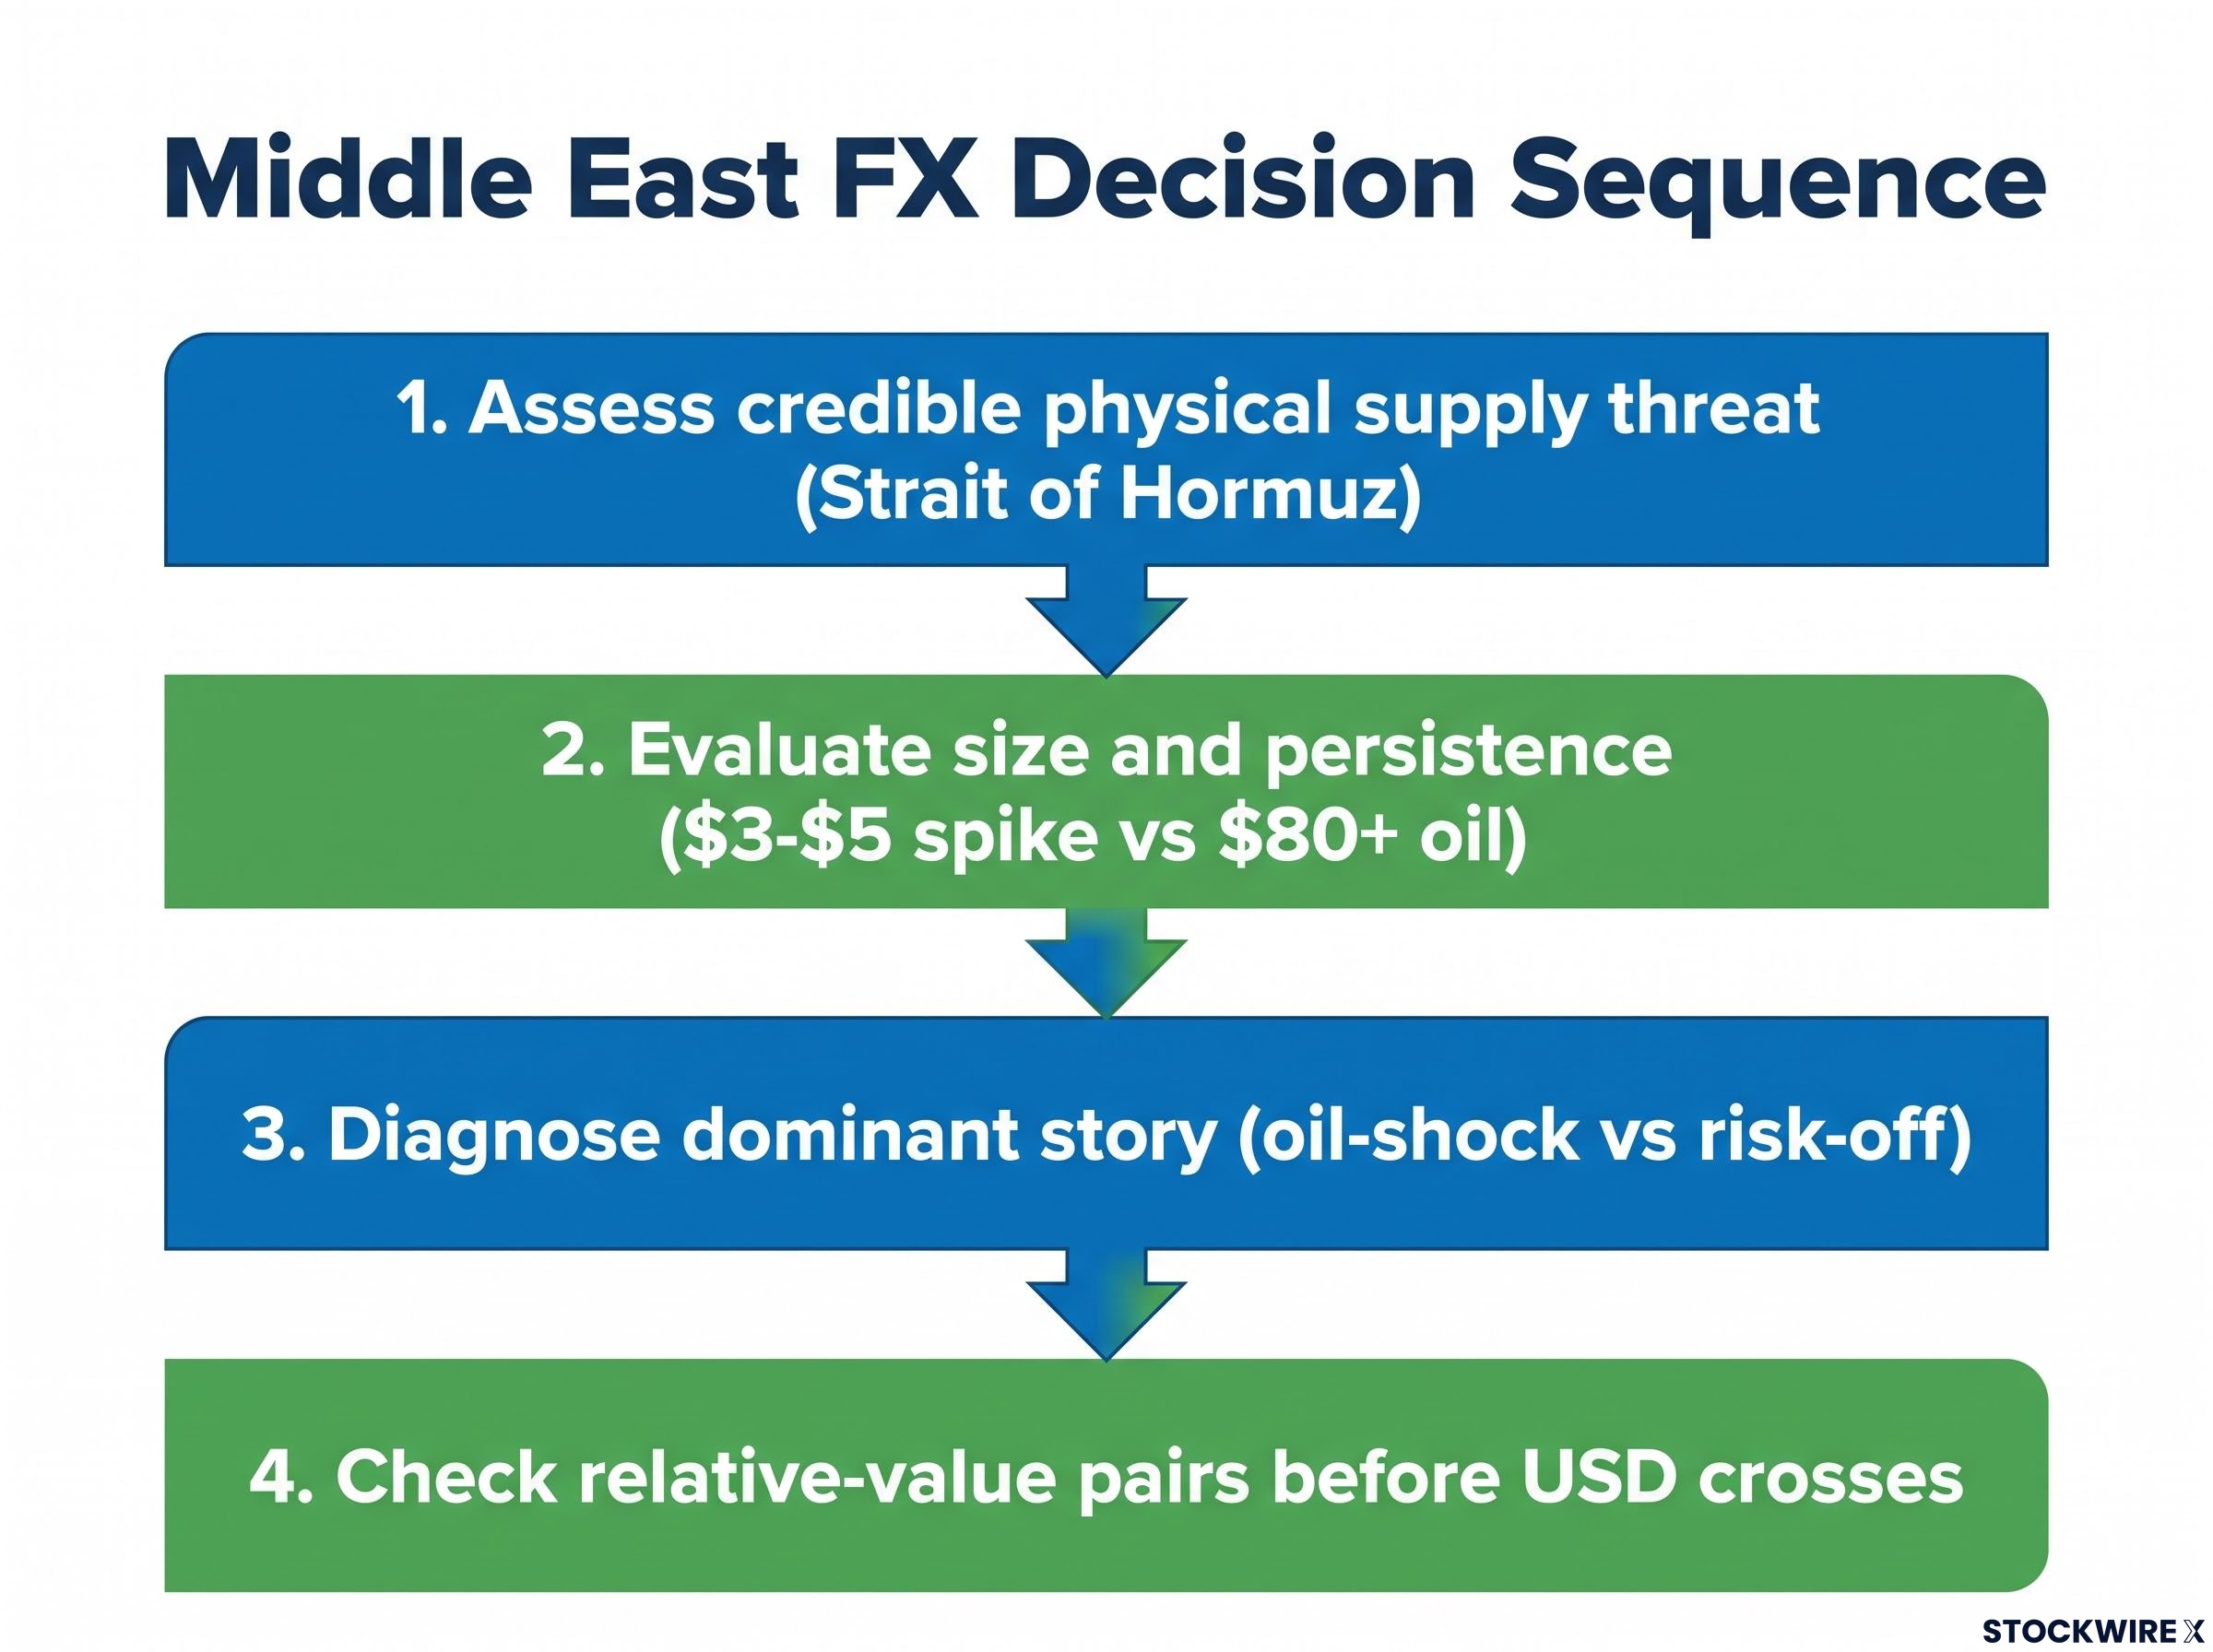
- Assess whether the headline represents a credible, sustained threat to physical supply. A diplomatic spat or a round of rhetoric is analytically different from confirmed infrastructure damage or a direct threat to shipping lanes. Markets respond most strongly when the Strait of Hormuz or major production infrastructure is directly at risk, not when diplomatic deterioration alone drives the news.
- Evaluate the size and persistence of the energy price move. A $3-$5 one-day spike that fades within a session is analytically different from sustained elevation above a macro-relevant threshold. ING analysis references $80+ oil as an example of a level that signals a material macro shock rather than a transient headline event. If the move does not have staying power, FX markets are likely to treat it as noise.
- Diagnose whether the dominant story is oil-shock or broad risk-off. If the move is oil-shock-dominant, your attention belongs on exporter-importer pairs: NOK/SEK, AUD/NZD, USD versus Asia FX. If the move is risk-off-dominant, expect broader safe-haven strength in USD, CHF, and JPY, with wider emerging-market FX and equity weakness.
- Check relative-value pairs before USD crosses. For most moderate supply scares, the clearest and most tradeable signal appears in exporter-versus-importer pairs rather than in EUR/USD or the DXY index alone. USD crosses blend too many forces to give you a clean read on what the energy market is actually doing.
The first-step filter matters most: the Strait of Hormuz is the relevant chokepoint. Headlines about diplomatic posturing carry a different FX weight than confirmed threats to physical shipping through the strait.
ING strategists have indicated that US-Iran talks appear to have stalled without resolution. That context makes this framework immediately applicable. The first question to ask when the next headline breaks determines which currency pairs are worth watching and which are likely to produce noise rather than signal.
What the structural shifts mean for how you read the next Gulf headline
The US’s position as a durable crude and LNG exporter is not reversing. The shale infrastructure is built, the export terminals are operational, and the economic incentives that sustain production remain intact. That means the simple historical USD-oil relationship is unlikely to fully revert, making the relative-value pair framework a long-term analytical lens rather than a temporary adjustment for the current crisis.
Two additional structural variables will shape how these dynamics evolve:
- European and Asian import diversification. As these economies build out renewables and diversify away from imported hydrocarbons, the FX sensitivity of EUR and JPY to oil shocks may gradually decline, further shifting where Gulf risk shows up in currency markets.
- GCC capital flow sensitivity. Evidence from Gulf Cooperation Council markets suggests that regional volatility is more sensitive to geopolitical risk itself than to oil-volatility alone, meaning geopolitics can drive capital flows independently of commodity price moves.
- US energy export position. Any sustained change in US production policy, export capacity, or domestic energy mix would alter the terms-of-trade dynamic that currently dampens the Dollar’s oil sensitivity.
For readers wanting to trace how sustained triple-digit oil feeds through to consumer prices, monetary policy, and fiscal balances across different economies, our full explainer on oil-driven inflation and central bank responses examines the three-stage transmission chain and the fiscal bind facing oil-importing governments in real time.
ING’s analysis points to a clear structural conclusion: the influence of Gulf-region events registers more clearly in relative-value currency pairs than in broad USD crosses. The investor who monitors NOK/SEK and AUD/NZD alongside crude prices has a more sensitive and more structurally grounded signal than the investor watching DXY alone.
That analytical upgrade is not specific to the current US-Iran moment. It is the correct framework for any future Gulf-region episode, because the structural changes that produced it, America’s energy transformation, prolonged headline fatigue, and the migration of the clearest signals into exporter-versus-importer pairs, are durable.
This article is for informational purposes only and should not be considered financial advice. Investors should conduct their own research and consult with financial professionals before making investment decisions. Currency markets are complex, and geopolitically driven relationships can change quickly; any positioning should reflect individual risk tolerance, time horizon, and independent research.