On 7 October 2026, the S&P 500 and Nasdaq sat roughly 0.2% below fresh record highs. Over the same stretch, headlines warned of an AI bubble, expensive oil, Federal Reserve rate hikes and regional wars. If fear is everywhere, why isn’t the damage? The answer depends on whether the next drop turns out to be a bear market or a correction.
The label matters because it shapes what you do next. Treat a brief correction as a bear market and you may sell near the bottom. Treat a real bear market as a correction and you may sit through deep, lasting losses.
This explainer builds on a Fisher Investments editorial published yesterday, 9 October 2026. Its framework is the firm’s opinion, not settled fact, and other institutions see things differently.
You will come away with a practical test for telling the two apart and an honest view of how 2026’s biggest worries measure up against it.
What separates a bear market from a correction?
Most investors learn a single number: fall 20% and you are in a bear market. That line is useful, but it hides the more important difference.
A correction is a brief decline of roughly -10% to -20%, usually driven by sentiment, meaning how investors feel rather than how companies are performing. A bear market is a lengthy decline of -20% or worse, driven by fundamentals such as earnings, credit and economic growth. Bear markets usually last a long time, though there are exceptions. The COVID bear in 2020 was unusually short.
When you ask why stock prices move, sentiment is only one lever; supply and demand, earnings surprises and geopolitical shocks all push prices around, which is why a sentiment-led correction can look so convincing in its first weeks.
| Feature | Correction | Bear market |
|---|---|---|
| Size | Roughly -10% to -20% | -20% or worse |
| Typical duration | Brief and sharp | Usually lengthy (COVID was an exception) |
| Main driver | Sentiment | Fundamentals |
| Typical triggers | Scary headlines, crowded trades, high valuations | Recession, credit stress, structural shocks |
According to Fisher Investments’ editorial staff, corrections are routine and even healthy in bull markets because they rebuild the “wall of worry,” the scepticism that keeps optimism from overheating.
What typically triggers a correction
Corrections tend to follow frightening but temporary headlines: a geopolitical flare-up, a short-lived oil spike or a weather disaster. They can also come from positioning, such as investors unwinding a crowded trade or taking profits after a rally. High starting valuations make markets jumpier when surprises hit.
The difficulty is that corrections can begin right from a market peak. In real time, the first weeks of a correction can look identical to the start of a bear.
What typically drives a bear market
Bear markets more commonly trace to deeper damage:
- A major fall in expected earnings, often from a recession or severe profit downturn
- Credit stress that forces companies and investors to cut borrowing (deleveraging)
- Shocks that structurally change the economic outlook, such as systemic banking crises or pandemics
So when stocks drop, the useful question is not “how far has it fallen?” but “what is causing it?” The cause gives you a much better read on whether the damage is likely to be brief or lasting.
When big ASX news breaks, our subscribers know first
Two paths to a bear market: fading euphoria and the unpriced shock
If fundamentals drive bear markets, how do they actually start? History offers two quite different stories.
The wall: euphoria that runs out of road
In the late 1990s, investors grew broadly euphoric about internet stocks. Weakening fundamentals were waved away until results began to disappoint. Stocks then slid gradually, and then sharply, through the 2000-2002 dot-com bust.
Nobody had to see a crisis coming. Optimism simply exhausted itself.
The wallop: the shock nobody priced
The 2007-2009 financial crisis and the 2020 pandemic shutdown followed a different script. Each began with a sizeable, barely noticed blow that erased trillions of dollars of economic output and pushed the world into recession.
Wallop-driven bears often fall gradually rather than collapsing at once. They also cut bull markets short before euphoria has time to build.
Then there is 2022. Aggressive rate hikes to fight inflation repriced duration risk (how sensitive an asset’s value is to interest rates over time) and hit growth and tech stocks hard. Whether that counts as a bear market or a deep correction varies by index and analyst.
Bear market recovery time depends heavily on the cause: the dot-com bust took roughly 7 years to regain its prior high on a price-only basis, while the deeper 2008 crash took about 5.5 years, so the wall and the wallop carry different timelines.
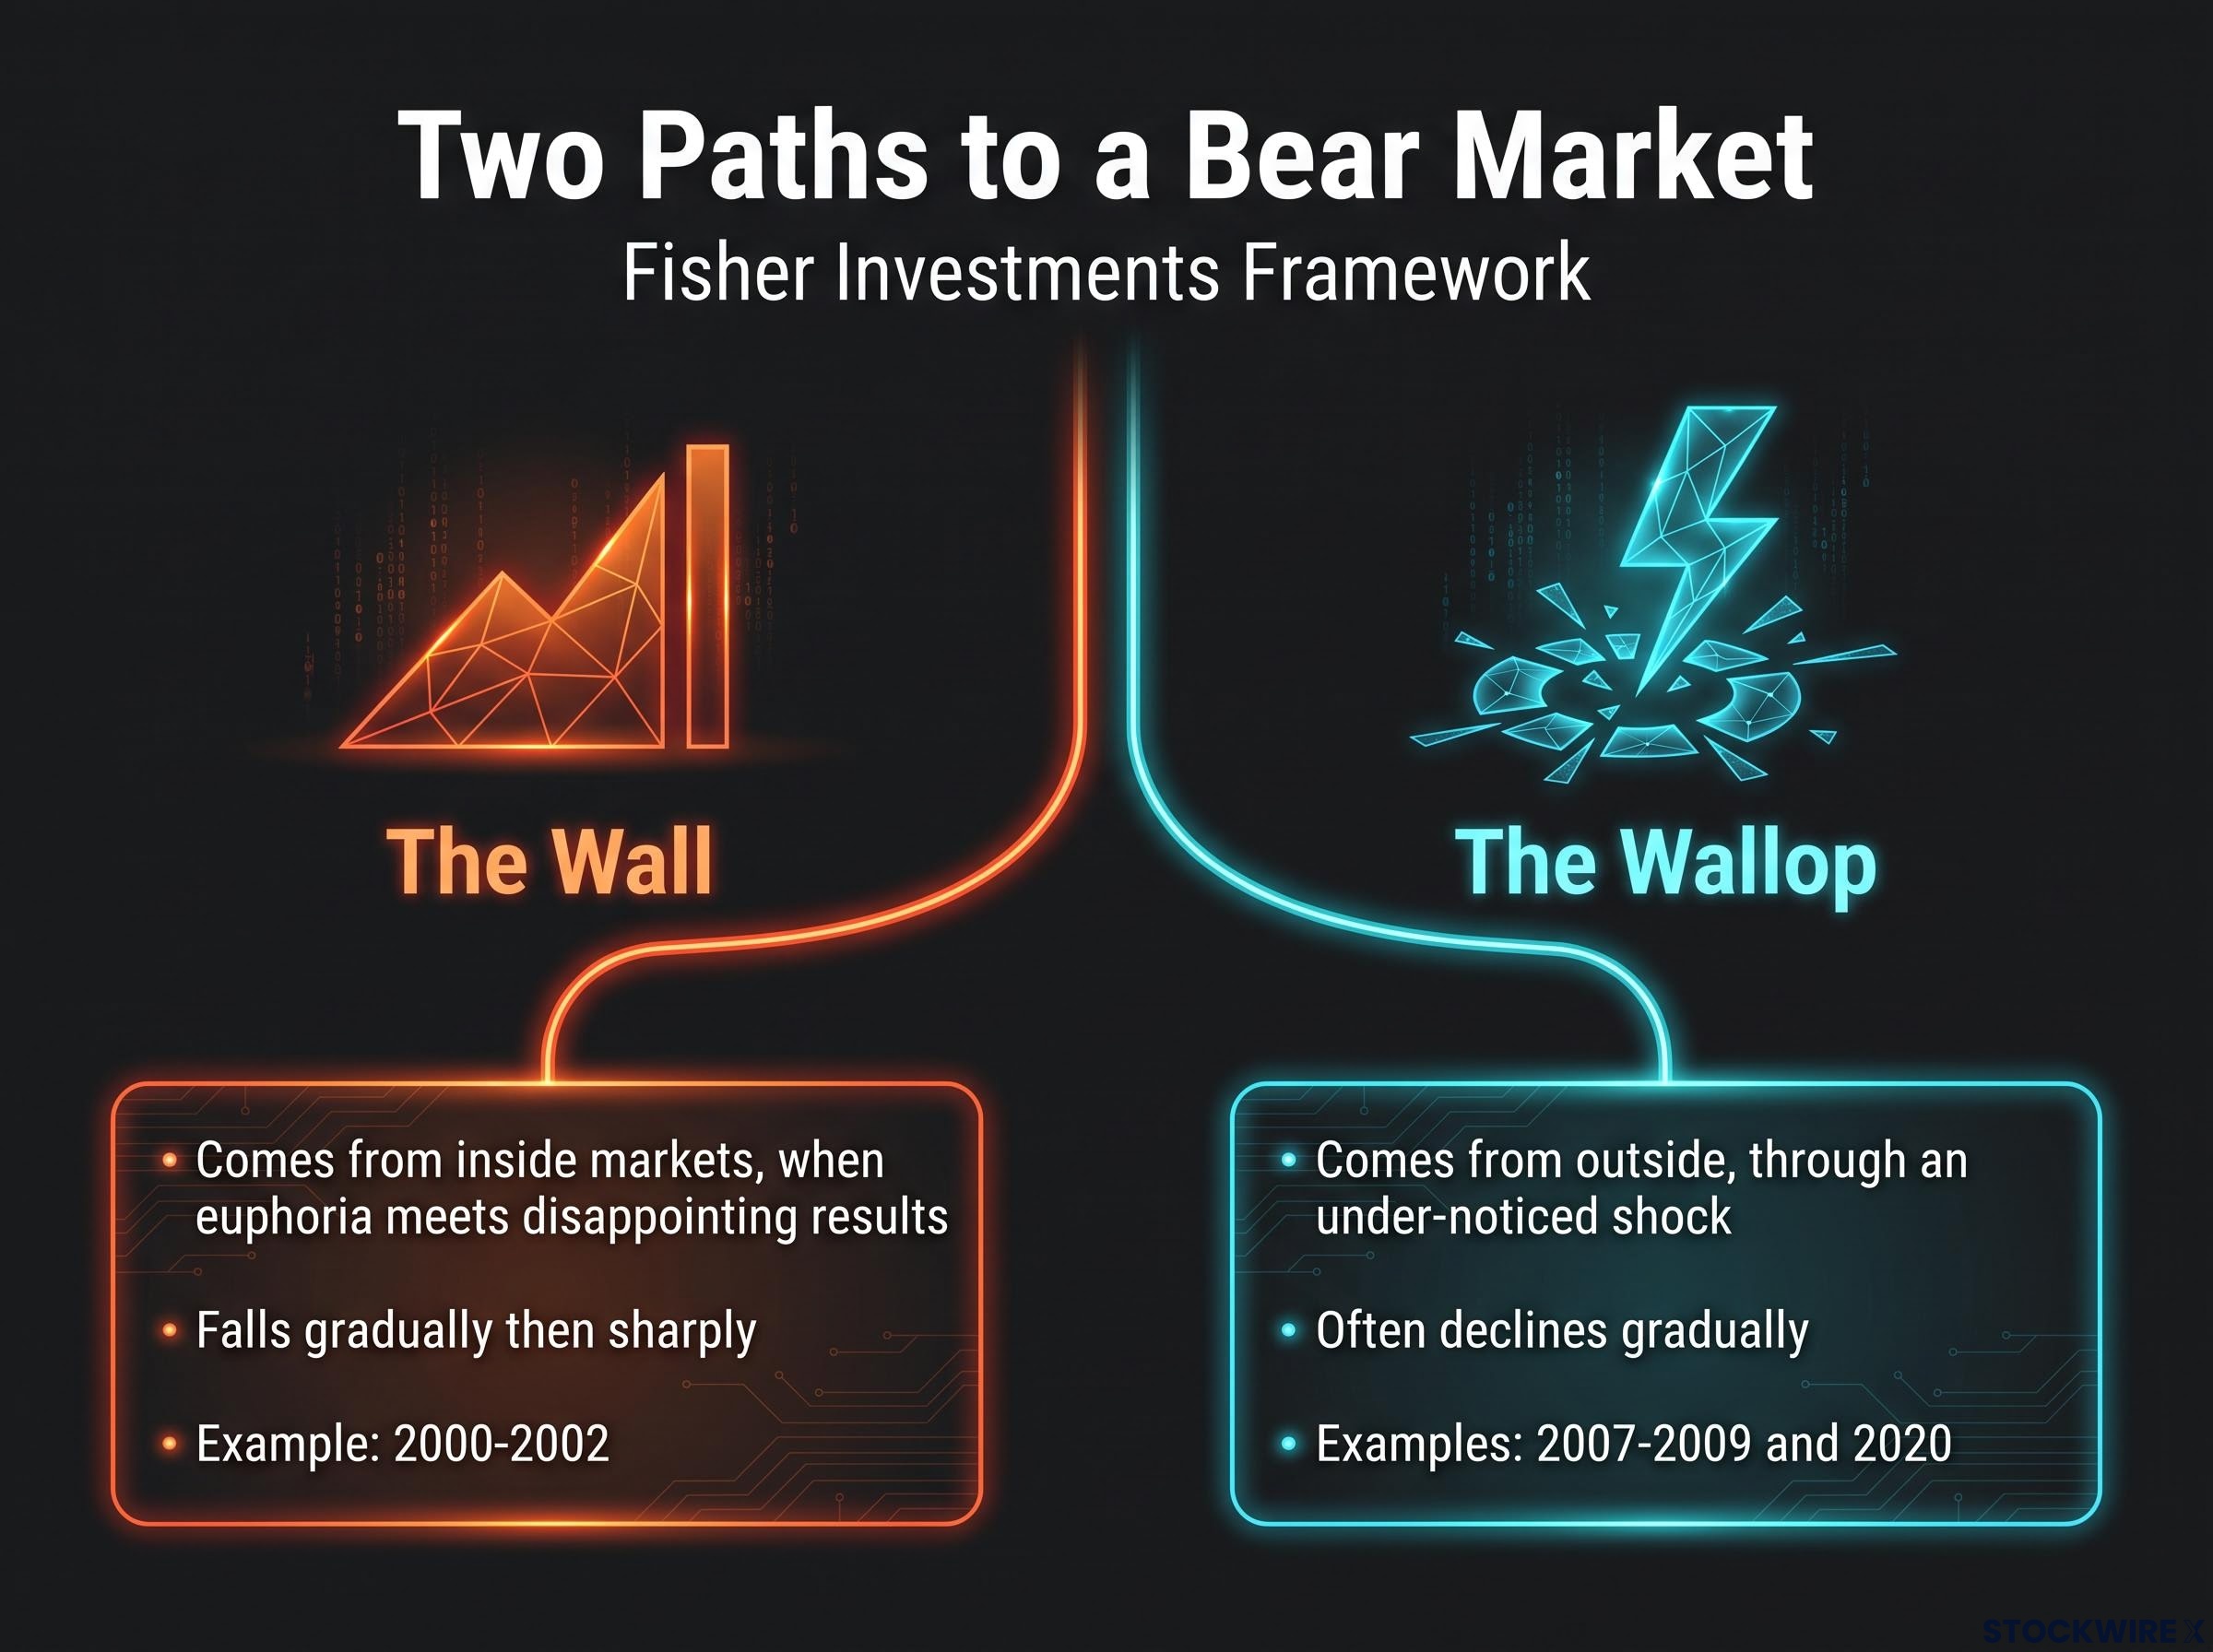
Fisher Investments calls these two paths the wall and the wallop. Its opinion is that they differ in these ways:
- The wall: comes from inside markets, when euphoria meets disappointing results; falls gradually then sharply; example 2000-2002
- The wallop: comes from outside, through an under-noticed shock; often declines gradually; examples 2007-2009 and 2020
The framework’s core point: Bear markets trace either to optimism turning into pessimism or to a large shock investors failed to price in. They do not trace to well-publicised worries investors have had time to absorb.
That gives you a two-question screen for any new scare. Is sentiment genuinely euphoric? Is this shock truly unexpected? If the answer to both is no, the headlines everyone is already discussing make poor bear-market candidates.
Testing 2026’s biggest fears against both bear market paths
Run today’s worries through that screen and the reassuring reading comes first. The counterarguments deserve equal attention.
Is AI a 2000-style bubble?
Fisher’s opinion is that euphoria remains only nascent. Sentiment is mixed, bubble warnings are common, weak IPOs (initial public offerings, a company’s first sale of shares to the public) have stalled and recession warnings have risen. In 2000, unprofitable IPOs surged and Fed hikes inverted the yield curve, meaning short-term rates rose above long-term rates. Today, the firm says, the curve has steepened.
Valuations support part of that case. Tech trades at roughly 21x-25x forward earnings, versus roughly 58x-70x at the 2000 peak. A forward P/E (price-to-earnings ratio) compares a share price with expected profits; sources differ on exact figures because they define tech differently. Ben Carlson of Ritholtz Wealth notes US tech has risen about 65% since the start of 2025 while its forward P/E fell from about 29x to 22x, because earnings grew faster than prices.
Goldman Sachs: “This is an earnings story, not a multiple expansion one.”
Not everyone agrees, and the disagreement is serious:
| Camp | Who | Core argument | Key figure |
|---|---|---|---|
| Bubble risk | Ray Dalio, ECB, Baringa, BofA survey respondents | AI pricing is stretched; borrowing and rising rates add risk | Baringa: up to 1,370% sales growth needed to reach the 3.6x sales norm |
| Earnings boom with risks | Goldman Sachs, Lombard Odier | Earnings justify prices, but sustaining growth is hard | Goldman S&P 500 targets: 8,000 and 8,300 |
| Not a bubble | BlackRock iShares, Fidelity | Valuations sit far below dot-com extremes and rest on visible earnings | Tech near 21x earnings vs nearly 70x in 2000 |
The central dispute is whether AI-driven earnings growth can last.
Could familiar fears still become triggers?
Fisher argues that high oil, inflation investors have already looked past, Fed hikes, regional wars and extreme weather lack real shock power. It points to past feared wallops, including Chinese hard-landing worries, Brexit and the eurozone debt crisis, that never became global bears.
Broader 2026 commentary flags ways known risks could still bite. Investors may be extrapolating AI profit growth of about 50% indefinitely. Dalio warns that leverage combined with rate hikes is a vulnerability. The top 10 S&P 500 companies make up 41% of market capitalisation and 34% of profits, roughly double their mid-1990s share, while about 40% of constituents are down for the year. Headline fatigue can also convince you a risk is fully priced while conditions quietly worsen. These market figures were reported but not independently confirmed, and no current readings for the fed funds rate, inflation, oil or the yield-curve spread were available.
The upshot: today’s loudest fears look more like corrections-in-waiting than wallops, but concentration and earnings-extrapolation risk mean the wall scenario deserves monitoring rather than dismissal.
AI concentration risk is the quieter version of the wall scenario: the Magnificent Seven make up roughly 32% of the S&P 500, so a broad index fund holder carries a sizeable AI bet whether or not they chose it.
The cost of dodging a bear market you may have misjudged
Stepping aside feels sensible. Sell before the fall, buy back lower, and avoid the pain.
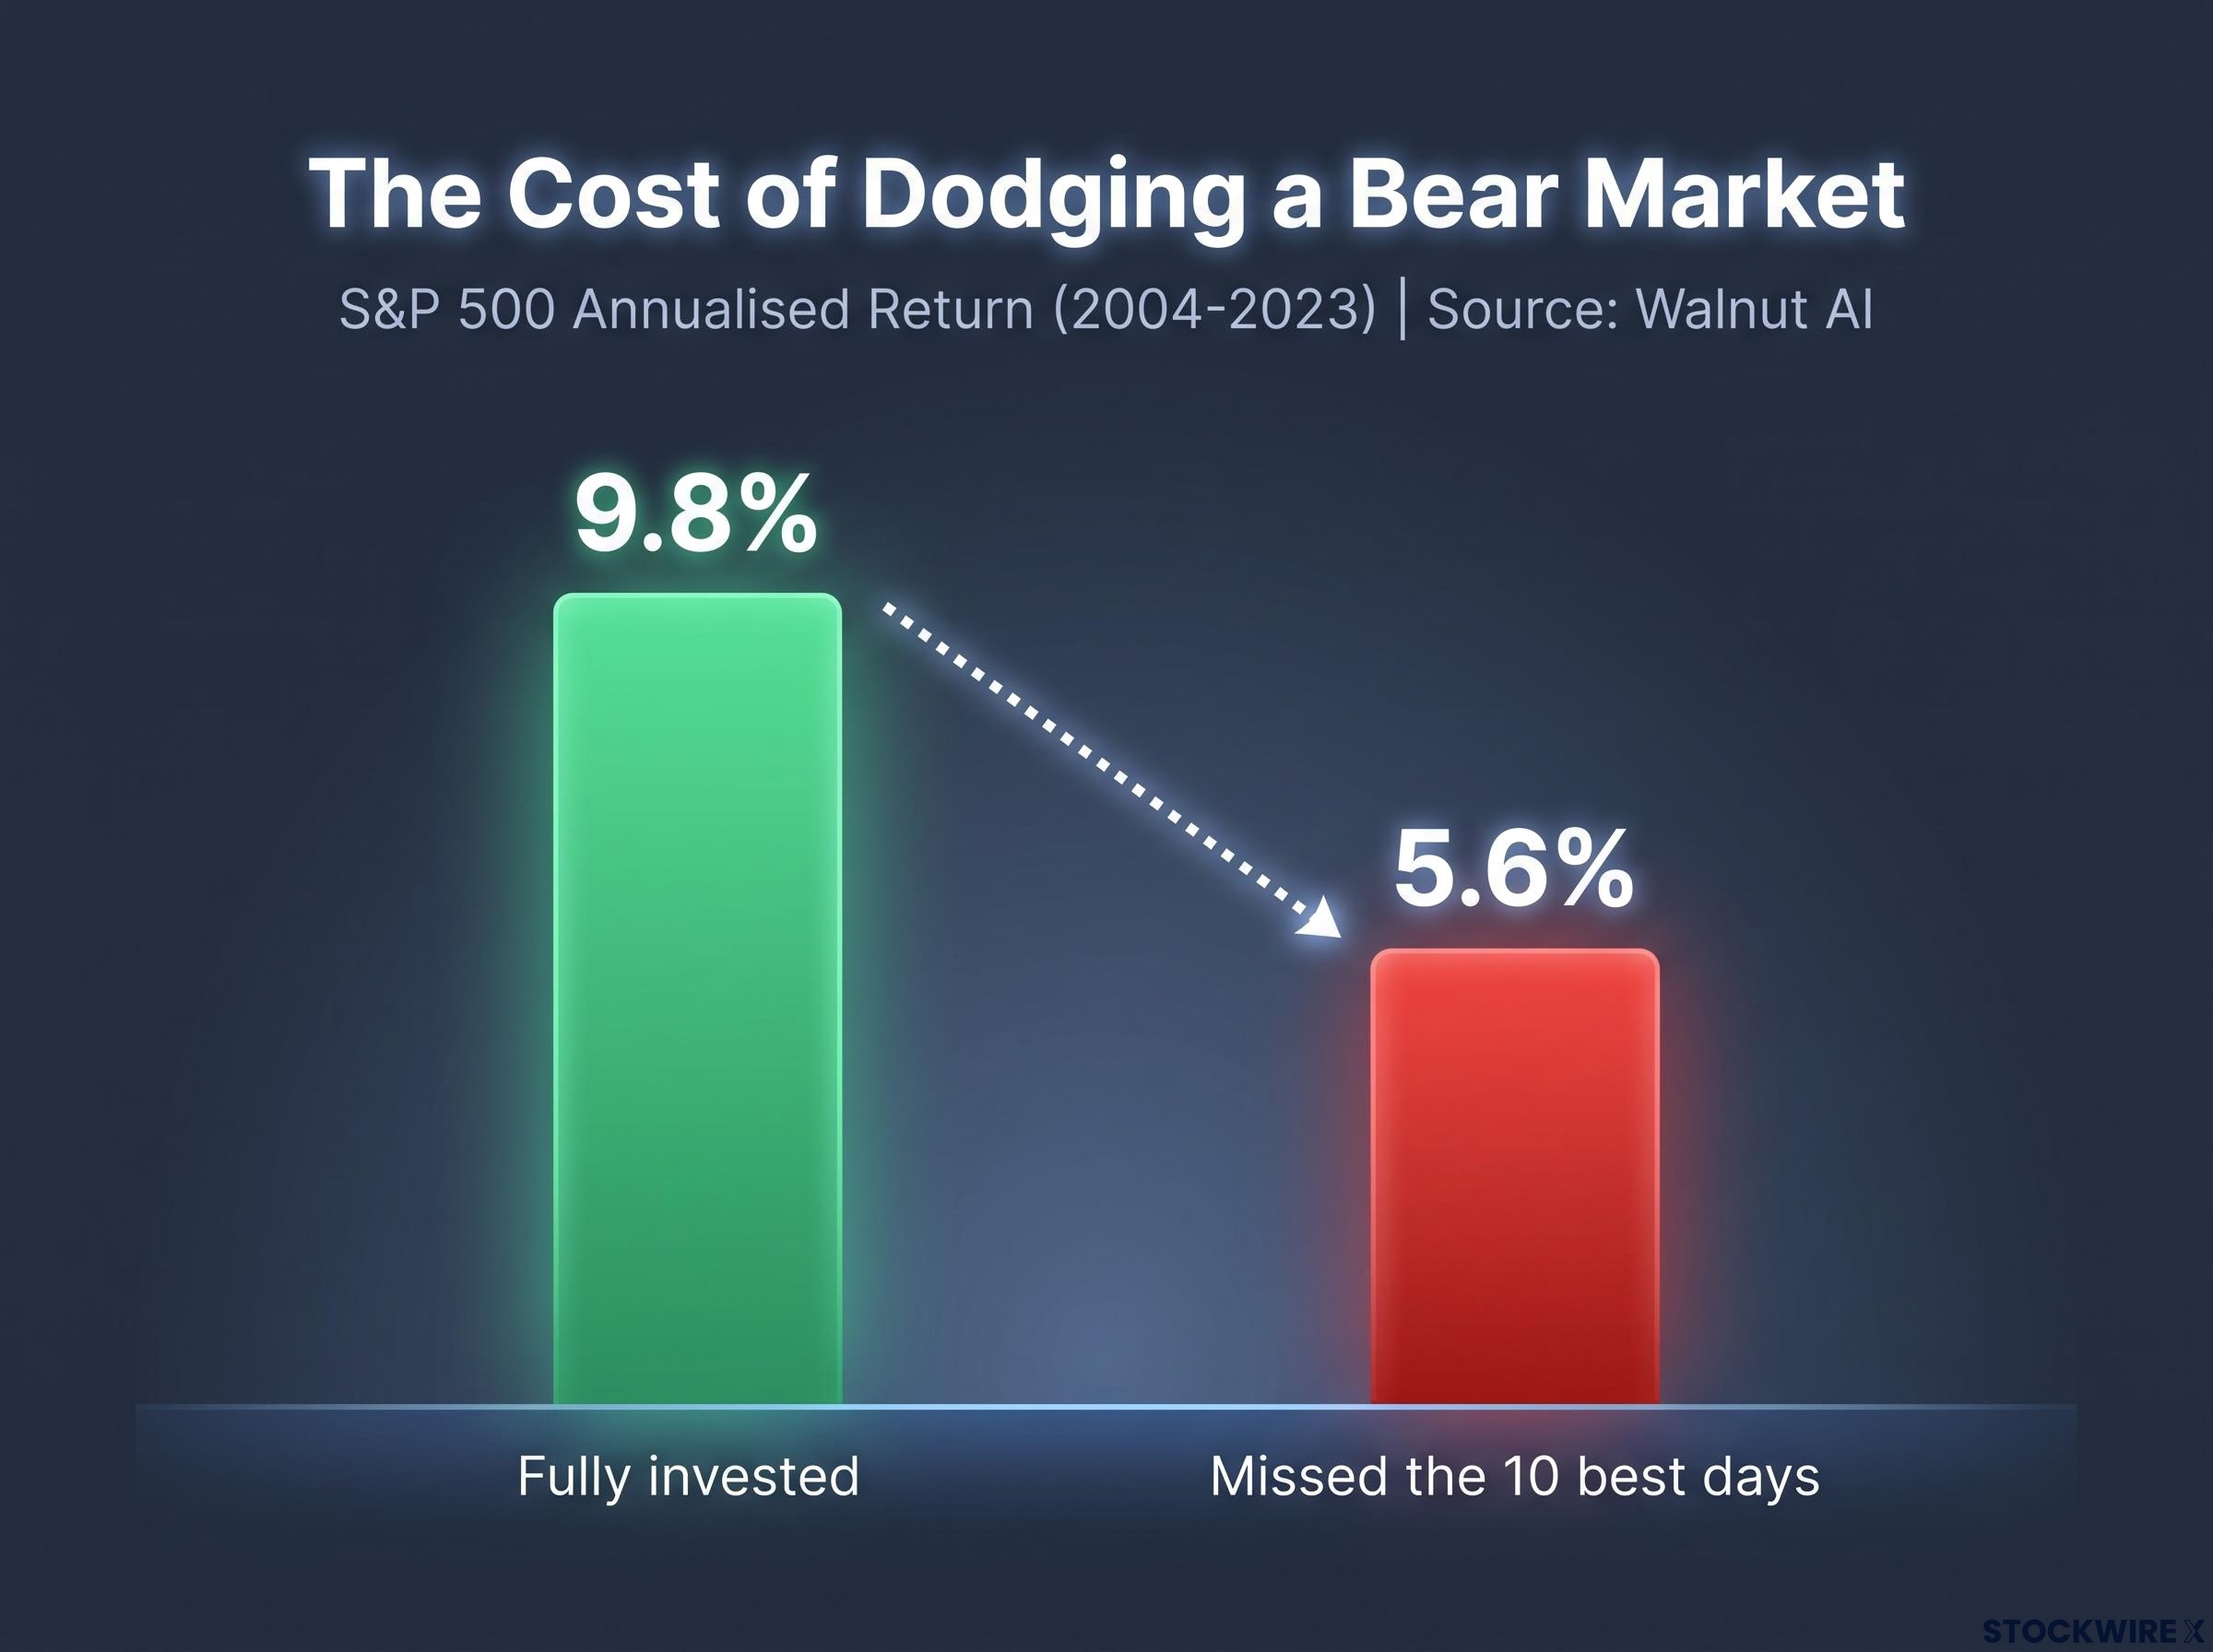
The arithmetic is less forgiving. A Walnut AI Investor Behavior Gap analysis of S&P 500 data from 2004 to 2023 (reported, not independently confirmed, and not a recent window) found:
| Scenario | Annualised return (2004-2023) |
|---|---|
| Fully invested | 9.8% |
| Missed the 10 best days | 5.6% |
Those best days often cluster around bear-market bottoms and early recoveries, exactly when exiting feels safest. The bull market that began on 9 October 2002 ran for five years, and the March 2020 rebound arrived before the news improved. Waiting for clarity usually means buying back after much of the recovery.
Three biases push you towards those mistakes:
- Loss aversion: losses hurt more than equal gains feel good
- Recency bias: recent events feel like the permanent trend
- Herding: following what everyone else is doing
Fisher’s view is that sidestepping a bear requires a well-reasoned call few others hold, and that being wrong forfeits gains and risks long-term goals. The firm does not argue bear markets never happen. The lesson for you is that a mistimed exit can cost more than sitting through a decline, so any decision to reduce risk should be deliberate, not a reaction to headlines.
Reading the next drop: a practical test for what you are seeing
When stocks next fall, start with cause. A sentiment-driven, headline-led drop points towards a correction. Euphoria followed by disappointing results, or a large shock nobody expected, points towards a bear market.
Three signals are worth watching:
- Whether euphoria spreads beyond AI into broader markets
- Whether AI companies keep delivering on lofty earnings expectations
- Whether credit or leverage stress starts to build
Fisher’s framework is opinion, sitting between the more cautious views of Dalio, the ECB and Baringa and the more optimistic stances of BlackRock and Fidelity. Weigh it alongside your own goals, timeframe and tolerance for risk. Then apply the test before you act.
For readers wanting a quantitative cautionary view, our detailed coverage of BCA’s bear market model explains why a valuation z-score of -0.69 sits close to its -1 warning threshold.
This article is for informational purposes only and should not be considered financial advice. Investors should conduct their own research and consult with financial professionals before making investment decisions. Past performance does not guarantee future results. Financial projections are subject to market conditions and various risk factors. Forward-looking statements are speculative and subject to change based on market developments and company performance.
—