
The S&P 500 trades at more than 40 times its average earnings over the past decade, a level reached only around 1929 and 2000. On a different measure, it sits at about 19 times next year’s expected profits, which is above average but nowhere near a mania. Both readings describe the same index on the same day, so is the S&P 500 expensive or not?
The answer matters because the index has roughly doubled in four years. A handful of AI-linked mega-caps now make up about a third of it, and the 10-year Treasury yield has climbed to roughly 5.3%.
If you hold an index fund, you hold that concentration and that valuation. Trusting a single headline number can leave you either needlessly alarmed or quietly overexposed.
Here you will learn how to read each valuation measure and see why they disagree. You will also get a way to hold a balanced view without trying to call the top.
Why do valuation measures give such different answers?
Pull up any market data screen and you might see three numbers side by side. CAPE reads about 41, the trailing P/E about 26 and the forward P/E about 19. They look like three analysts arguing, but they are really three cameras pointed at the same index from different points in time.
The three time lenses
A price-to-earnings (P/E) ratio is the share price divided by earnings per share. It tells you how many dollars you pay for each dollar of company profit. The difference between the three measures is which profits go into the bottom of that fraction.
Each of these valuation metrics fixes a different blind spot in the plain P/E, which is why you see CAPE, trailing and forward readings quoted side by side and why no single one should be trusted alone.
The cyclically adjusted P/E (CAPE), also called the Shiller P/E, divides the price by the average inflation-adjusted earnings of the past 10 years. If an index trades at 4,000 and its decade-average earnings are 100, its CAPE is 40. This smooths out booms and busts, but it gives little weight to recent profits. During fast earnings growth, CAPE can make stocks look more expensive than they are.
The trailing P/E uses only the last 12 months of reported earnings. It reflects the present but swings wildly. When profits collapsed in 2008, the ratio spiked even as prices fell.
The forward P/E uses analysts’ consensus forecasts for the next 12 months. It looks ahead, so it is only as good as those forecasts.
| Measure | Earnings basis | Latest reading | Long-run reference |
|---|---|---|---|
| CAPE | 10-year average, inflation-adjusted | 40.9-41.2 (Sept-Oct 2026) | Average 17.4-17.8; dot-com peak 44.2 (Dec 1999) |
| Trailing P/E | Last 12 months reported | 25.7-26.3 (late Sept/early Oct 2026) | Well below dot-com peak |
| Forward P/E | Next 12 months forecast | 19.0-19.3 (late Sept 2026, FactSet-based) | About 16x long-term; about 18x 10-year |
The two long-run forward averages likely reflect different look-back windows. Either way, today’s reading sits above them.
So when you see a headline saying “the market trades at X times earnings”, ask which earnings window it uses. That choice largely decides whether the number sounds alarming or calm.
The two adjusted lenses: PEG and ERP
Two further measures adjust for context. The price/earnings-to-growth (PEG) ratio divides the P/E by expected earnings growth. A reading above 1 is generally seen as expensive, while one below 1 is seen as cheaper.
The equity risk premium (ERP) is the extra return stocks offer over government bonds. One simple version subtracts the 10-year Treasury yield from the earnings yield. PEG adjusts for growth, and ERP adjusts for what you could earn in bonds instead.
When big ASX news breaks, our subscribers know first
Is the S&P 500 expensive against its own history?
Line each measure up against its own past and a split verdict emerges.
- CAPE: about 41, within reach of the 44.2 dot-com record and more than double its long-run average.
- Trailing P/E: about 26, elevated but well under dot-com peak levels.
- Forward P/E: about 19x, above its long-term average yet well below the dot-com peak of roughly 25x.
One measure looks like 1999. The other two look rich but not extreme.
The biggest difference from 2000 is profits. S&P 500 earnings rose nearly 30% in Q3, the third straight quarter above 25% year over year, against a 25-year average growth rate of 6.4%. Today’s leaders have real earnings behind their prices.
Where the debate lands Commentators broadly describe the market as “richly valued” and driven by growth, rather than an unambiguous bubble.
You should not dismiss CAPE, though. It was built specifically to look through stretches of unsustainable growth, and much of the current earnings surge is tied to the AI buildout, which is unlikely to last indefinitely.
The gap between CAPE and the forward P/E is effectively the market’s growth assumption. If you are comfortable with these valuations, you are really saying you are comfortable that this growth continues.
What do PEG and the equity risk premium add to the picture?
Two measures say expensive. The next two complicate that verdict, and they pull in opposite directions.
PEG: pricing in the growth
The S&P 500’s forward PEG stands at 0.69, the lowest in decades. That would ordinarily signal a bargain.
The reason is the denominator. Analysts’ consensus five-year earnings growth estimate has surged over two years to 27.3%, fast enough to make even a 19x multiple look modest. Estimates for 2026 EPS growth vary widely: about 17% in mid-2026 reporting and about 32% in September-October data.
Forecast revenue growth is only 15.6%, well below those earnings expectations. A low PEG is only as trustworthy as the growth forecast behind it.
ERP: what stocks pay you for the risk
Here is how the simple version works:
- Take the earnings yield, which is 1 divided by the P/E. At 19x forward, that is roughly 5.3%.
- Subtract the 10-year Treasury yield.
- Read the gap. That is your extra reward for owning shares instead of bonds.
Using this approach, the forward ERP is about 4%. Professor Aswath Damodaran of NYU’s Stern School of Business puts the implied ERP at 3.70% on a trailing cash yield basis or about 4.20% on an adjusted payout basis as at 1 October 2026. That is measured over a 10-year yield of 5.29%, up from about 4.18% earlier in 2026.
The premium is not as low as at the dot-com peak, but it is the lowest in some time. The squeeze came from bonds, not stocks.
Higher yields can also draw capital away from equities, which matters for AI firms that rely on investor funding. A thin ERP means you have less margin for error if yields stay elevated or earnings disappoint.
For readers wanting the bond-side story, our full explainer on the equity risk premium shows how surging real yields squeezed the margin of safety for stocks.
How does the S&P 500 compare with mid caps, small caps and international stocks?
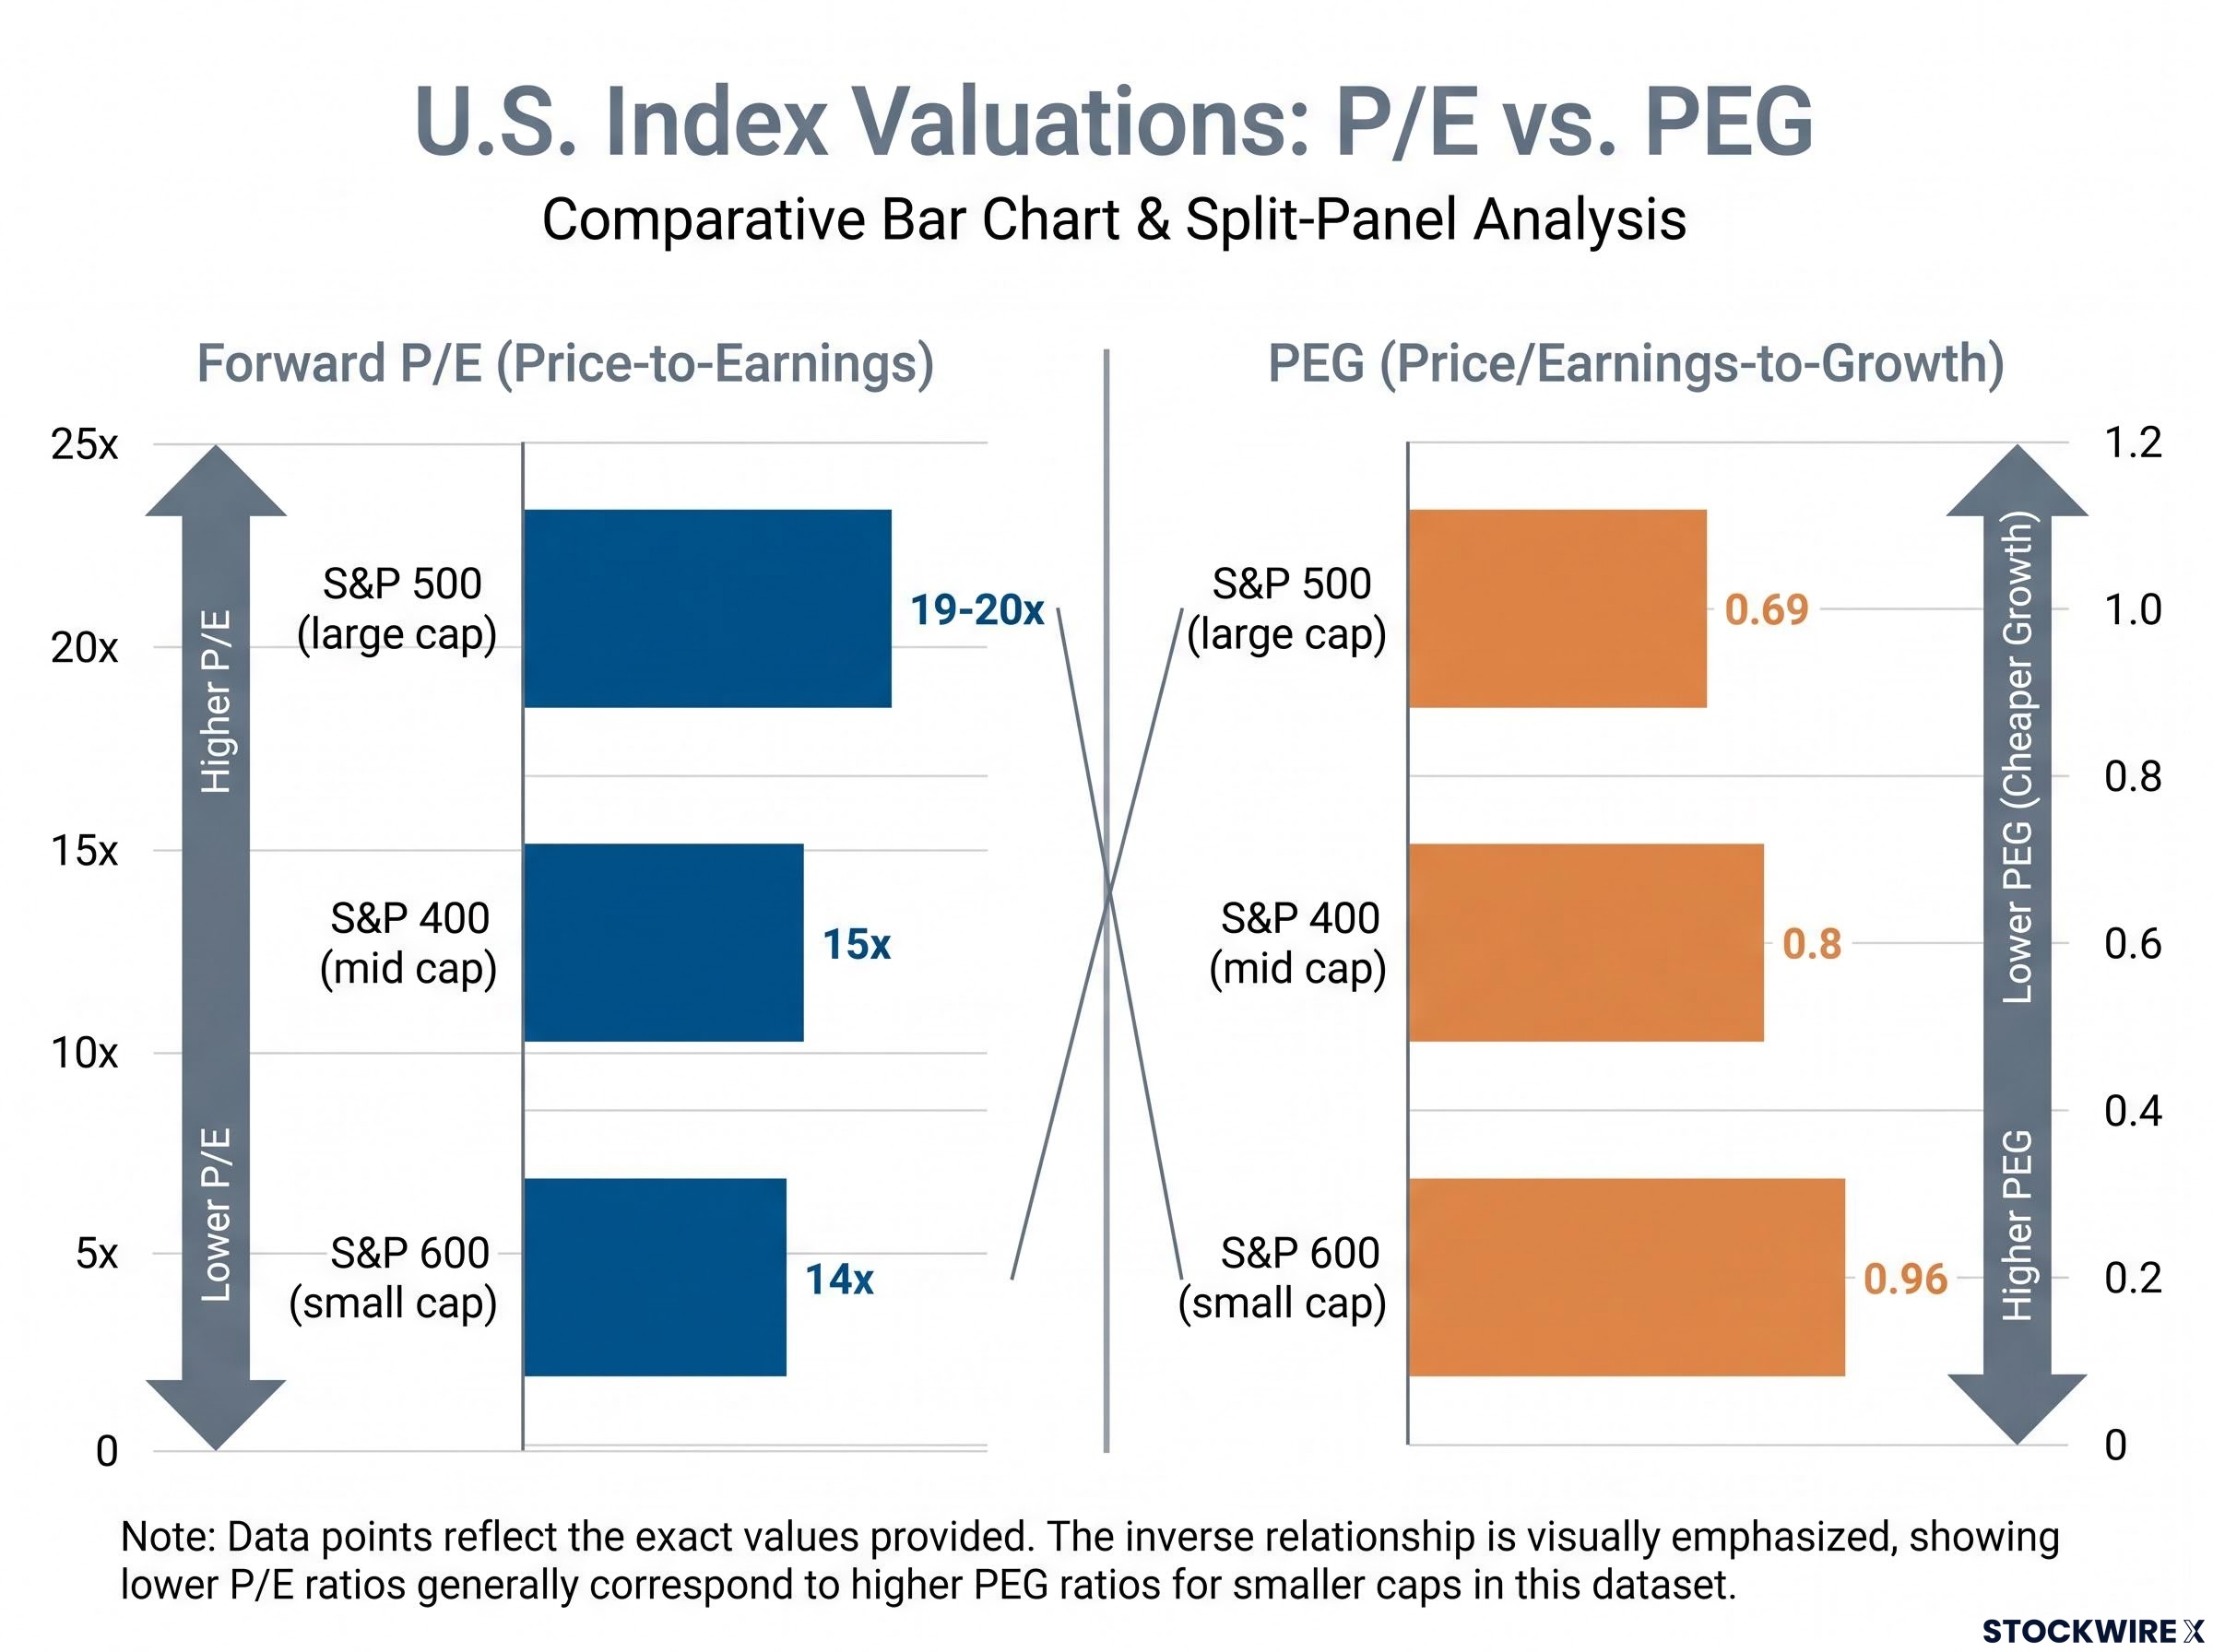
“Expensive” only means something next to an alternative. Here is how the main benchmarks stack up.
| Index | Forward P/E | PEG | Notes |
|---|---|---|---|
| S&P 500 (large cap) | 19-20x | 0.69 | Highest multiple, lowest PEG |
| S&P 400 (mid cap) | 15x | 0.8 | Lower multiple, slower expected growth |
| S&P 600 (small cap) | 14x | 0.96 | Cheapest U.S. multiple, highest PEG |
| MSCI ACWI ex-US | 12.5-12.65x | n/a | Trailing P/E 16.63x (30 Sep 2026) |
Every alternative trades on a lower forward multiple. But flip to PEG and the S&P 500 screens as the cheapest U.S. index, so a lower P/E does not automatically mean better value.
The MSCI ACWI ex-US index covers 22 developed and 24 emerging markets, about 85% of non-U.S. equities. Its earnings estimates have been rising. Some 2026 snapshots show about 25% year-over-year growth versus about 23% for the U.S., which is broadly similar growth at a sizeable discount.
FactSet data from late September 2026 adds more proxies:
- MSCI EAFE (developed markets ex-U.S.): about 14.8x forward
- MSCI Emerging Markets: about 9.9x forward
- Russell 2000: about 23.2x forward. This has a different construction and sector mix from the S&P 600, so it does not contradict the S&P 600’s 14x.
Cheaper multiples elsewhere come with different sectors, currencies and risks. The comparison shows you where valuation is lower, not where returns are guaranteed to be higher.
What could make these valuations misleading?
Every figure so far depends on inputs that deserve scrutiny. Three threads stand out.
Forecasts that run hot
Yardeni Research’s “squiggles” chart tracks how analyst estimates evolve, and it shows them shifting substantially and running too optimistic in good times. Expected earnings growth also appears to rely heavily on cost savings, which can only go so far. With revenue growth forecast at 15.6%, the gap has to be closed somewhere.
One-third of the index in seven names
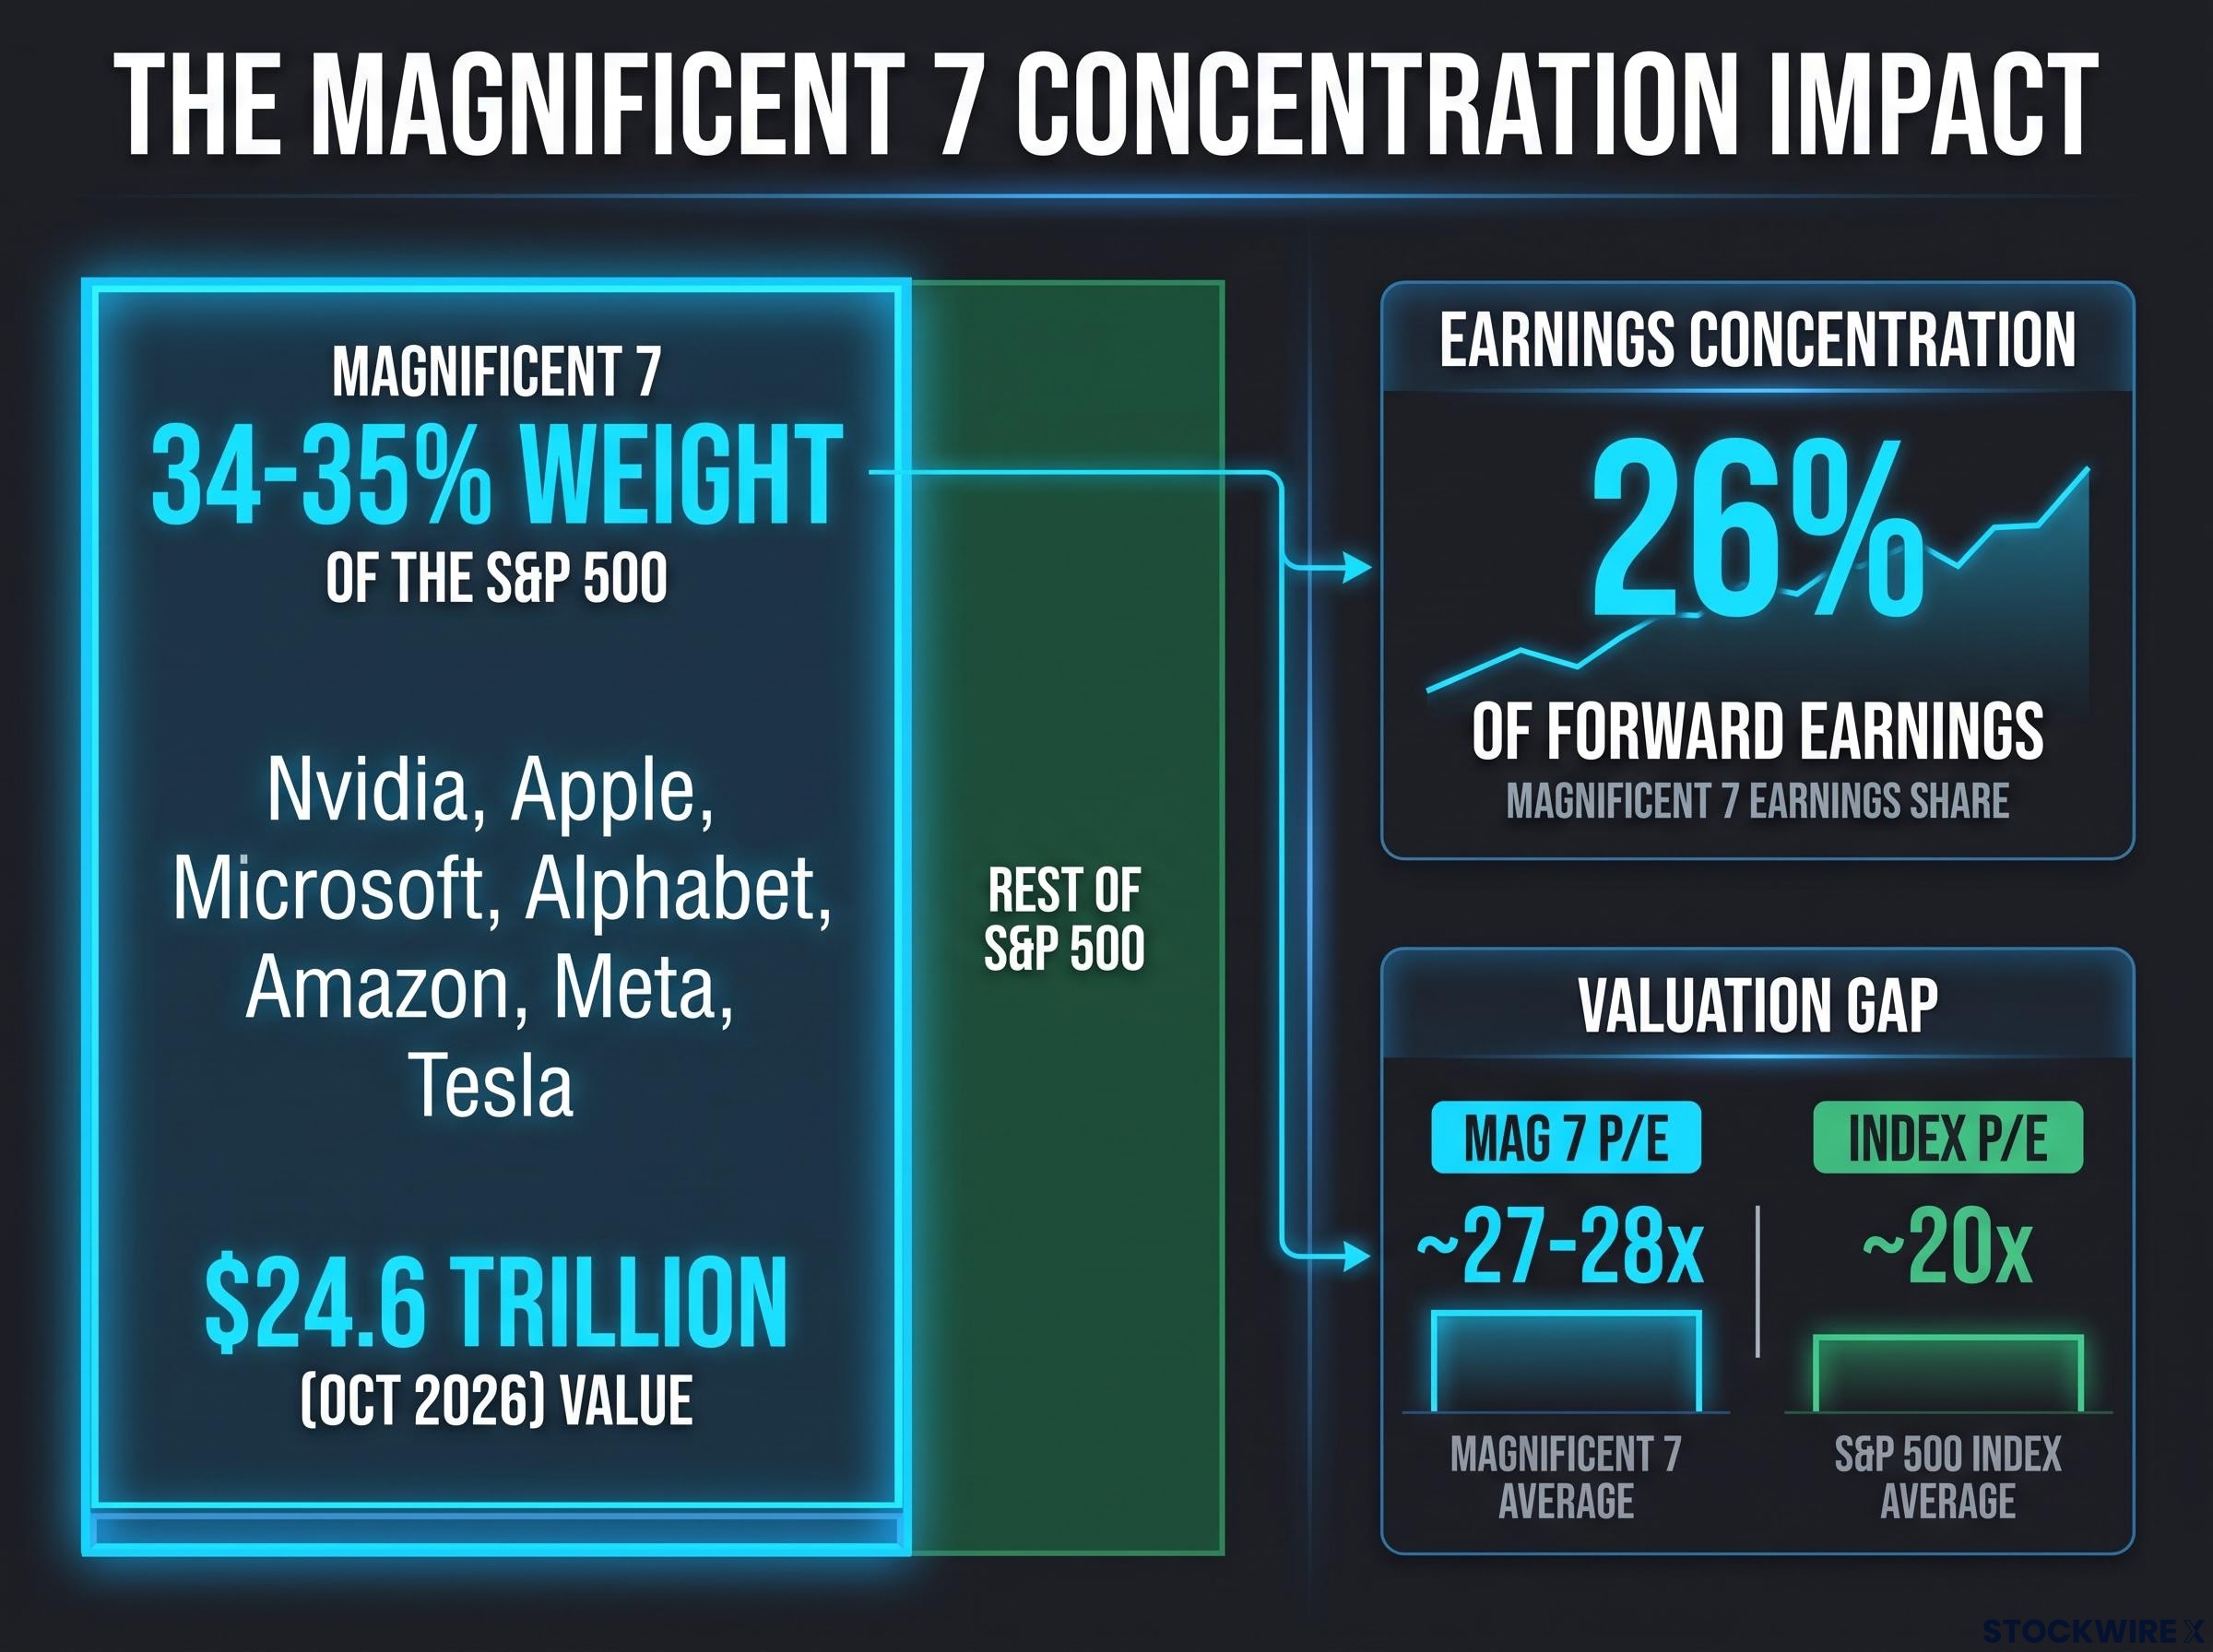
The Magnificent 7 (Nvidia, Apple, Microsoft, Alphabet, Amazon, Meta and Tesla) make up roughly 34-35% of the S&P 500, about $24.6 trillion, as of October 2026. The top 10 holdings account for roughly 38-41%, depending on source and date. The group’s average P/E was about 27-28x in September, against roughly 20x for the index.
Index fund concentration means that holding a cap-weighted fund and holding a handful of mega-caps are increasingly the same decision, and owning both a total market fund and an S&P 500 fund may not add real diversification.
On the group’s valuations Schwab has been reported as saying that none of the Magnificent Seven could likely be called “cheap” (unverified).
These seven companies are expected to contribute about 26% of forward earnings in some analyses, which offsets part of the concentration risk. Buybacks also lift earnings per share, and heavy mega-cap weighting raises the aggregate multiple even when many constituents trade lower.
When AI spending is capitalised, not expensed
Goldman Sachs estimates about $800 billion of U.S. AI spending in 2026, possibly above $1 trillion in later years. Most of it is capitalised. That means it is recorded as an asset and depreciated over time, rather than deducted from profits immediately. If chips wear out faster than assumed, today’s reported earnings flatter true profitability.
Free cash flow (the cash left after capital spending) is the pressure point, according to unverified reports:
- Amazon is spending about $200 billion in 2026 capex, and its trailing free cash flow reportedly fell from $25.9 billion to $1.2 billion.
- Meta raised its 2026 capex guidance to $64-72 billion from $60-65 billion, with free cash flow reportedly dropping from $12.5 billion to $10.3 billion.
Unlisted OpenAI and Anthropic could skew valuations further if they list.
An index multiple is partly a statement about a few companies’ AI spending and earnings quality. Your own risk depends on how much of that bet you already hold through index funds.
How to hold a balanced view without trying to time the market
Valuation tells you a lot about likely long-run returns and very little about next month.
High starting valuations, such as a CAPE above 40, have historically been associated with lower subsequent 10-year real returns. Markets can still stay expensive for years. CAPE near 41 echoes 1929 and 2000, but it did not time either turn.
Used as a return forecast over a decade, CAPE has a respectable record; used as an exit signal, it has repeatedly told investors to leave long before bull markets ended, as it did after the 1996 warnings.
Here is how the two camps line up:
| Expensive case | Partly justified case |
|---|---|
| CAPE above 40, compared with 1929 and 2000 | High margins and AI-driven earnings growth |
| Forward P/E above its 10-year average | Lowest forward PEG in decades |
| Concentration in a handful of mega-caps | Earnings broadening beyond the Magnificent 7 |
Treasury yields, inflation and oil prices remain live rate risks for both camps. From there, a few principles hold up whichever side you find more convincing:
- Expect lower returns from high starting valuations, not a crash on cue.
- Treat valuation as a poor timing tool, because structural shifts can sustain high multiples.
- Diversify across size and region, with mid and small caps at about 14-15x forward and ex-U.S. equities at about 12.5-15x, while keeping core large-cap exposure.
- Keep discipline and focus on your time horizon.
None of these metrics captures AI’s potential upside, and every forward estimate is subject to revision. Past performance does not guarantee future results, and financial projections depend on market conditions and various risk factors.
The data should shape your return expectations and your appetite for concentration, not push you to exit or enter the market.
What the valuation data tells you, and what it cannot
The S&P 500 is expensive on long-run smoothed earnings and moderately above average on forward earnings. It is cheap only if you trust very high growth forecasts. The honest answer depends on which assumption you believe.
Three variables will decide which reading ages best: whether earnings growth holds up beyond AI-linked names, where the 10-year Treasury yield settles, and whether AI capex turns into real returns on capital.
Use valuation to calibrate your expectations and your diversification, not to time entries and exits.
This article is for informational purposes only and should not be considered financial advice. Investors should conduct their own research and consult with financial professionals before making investment decisions.