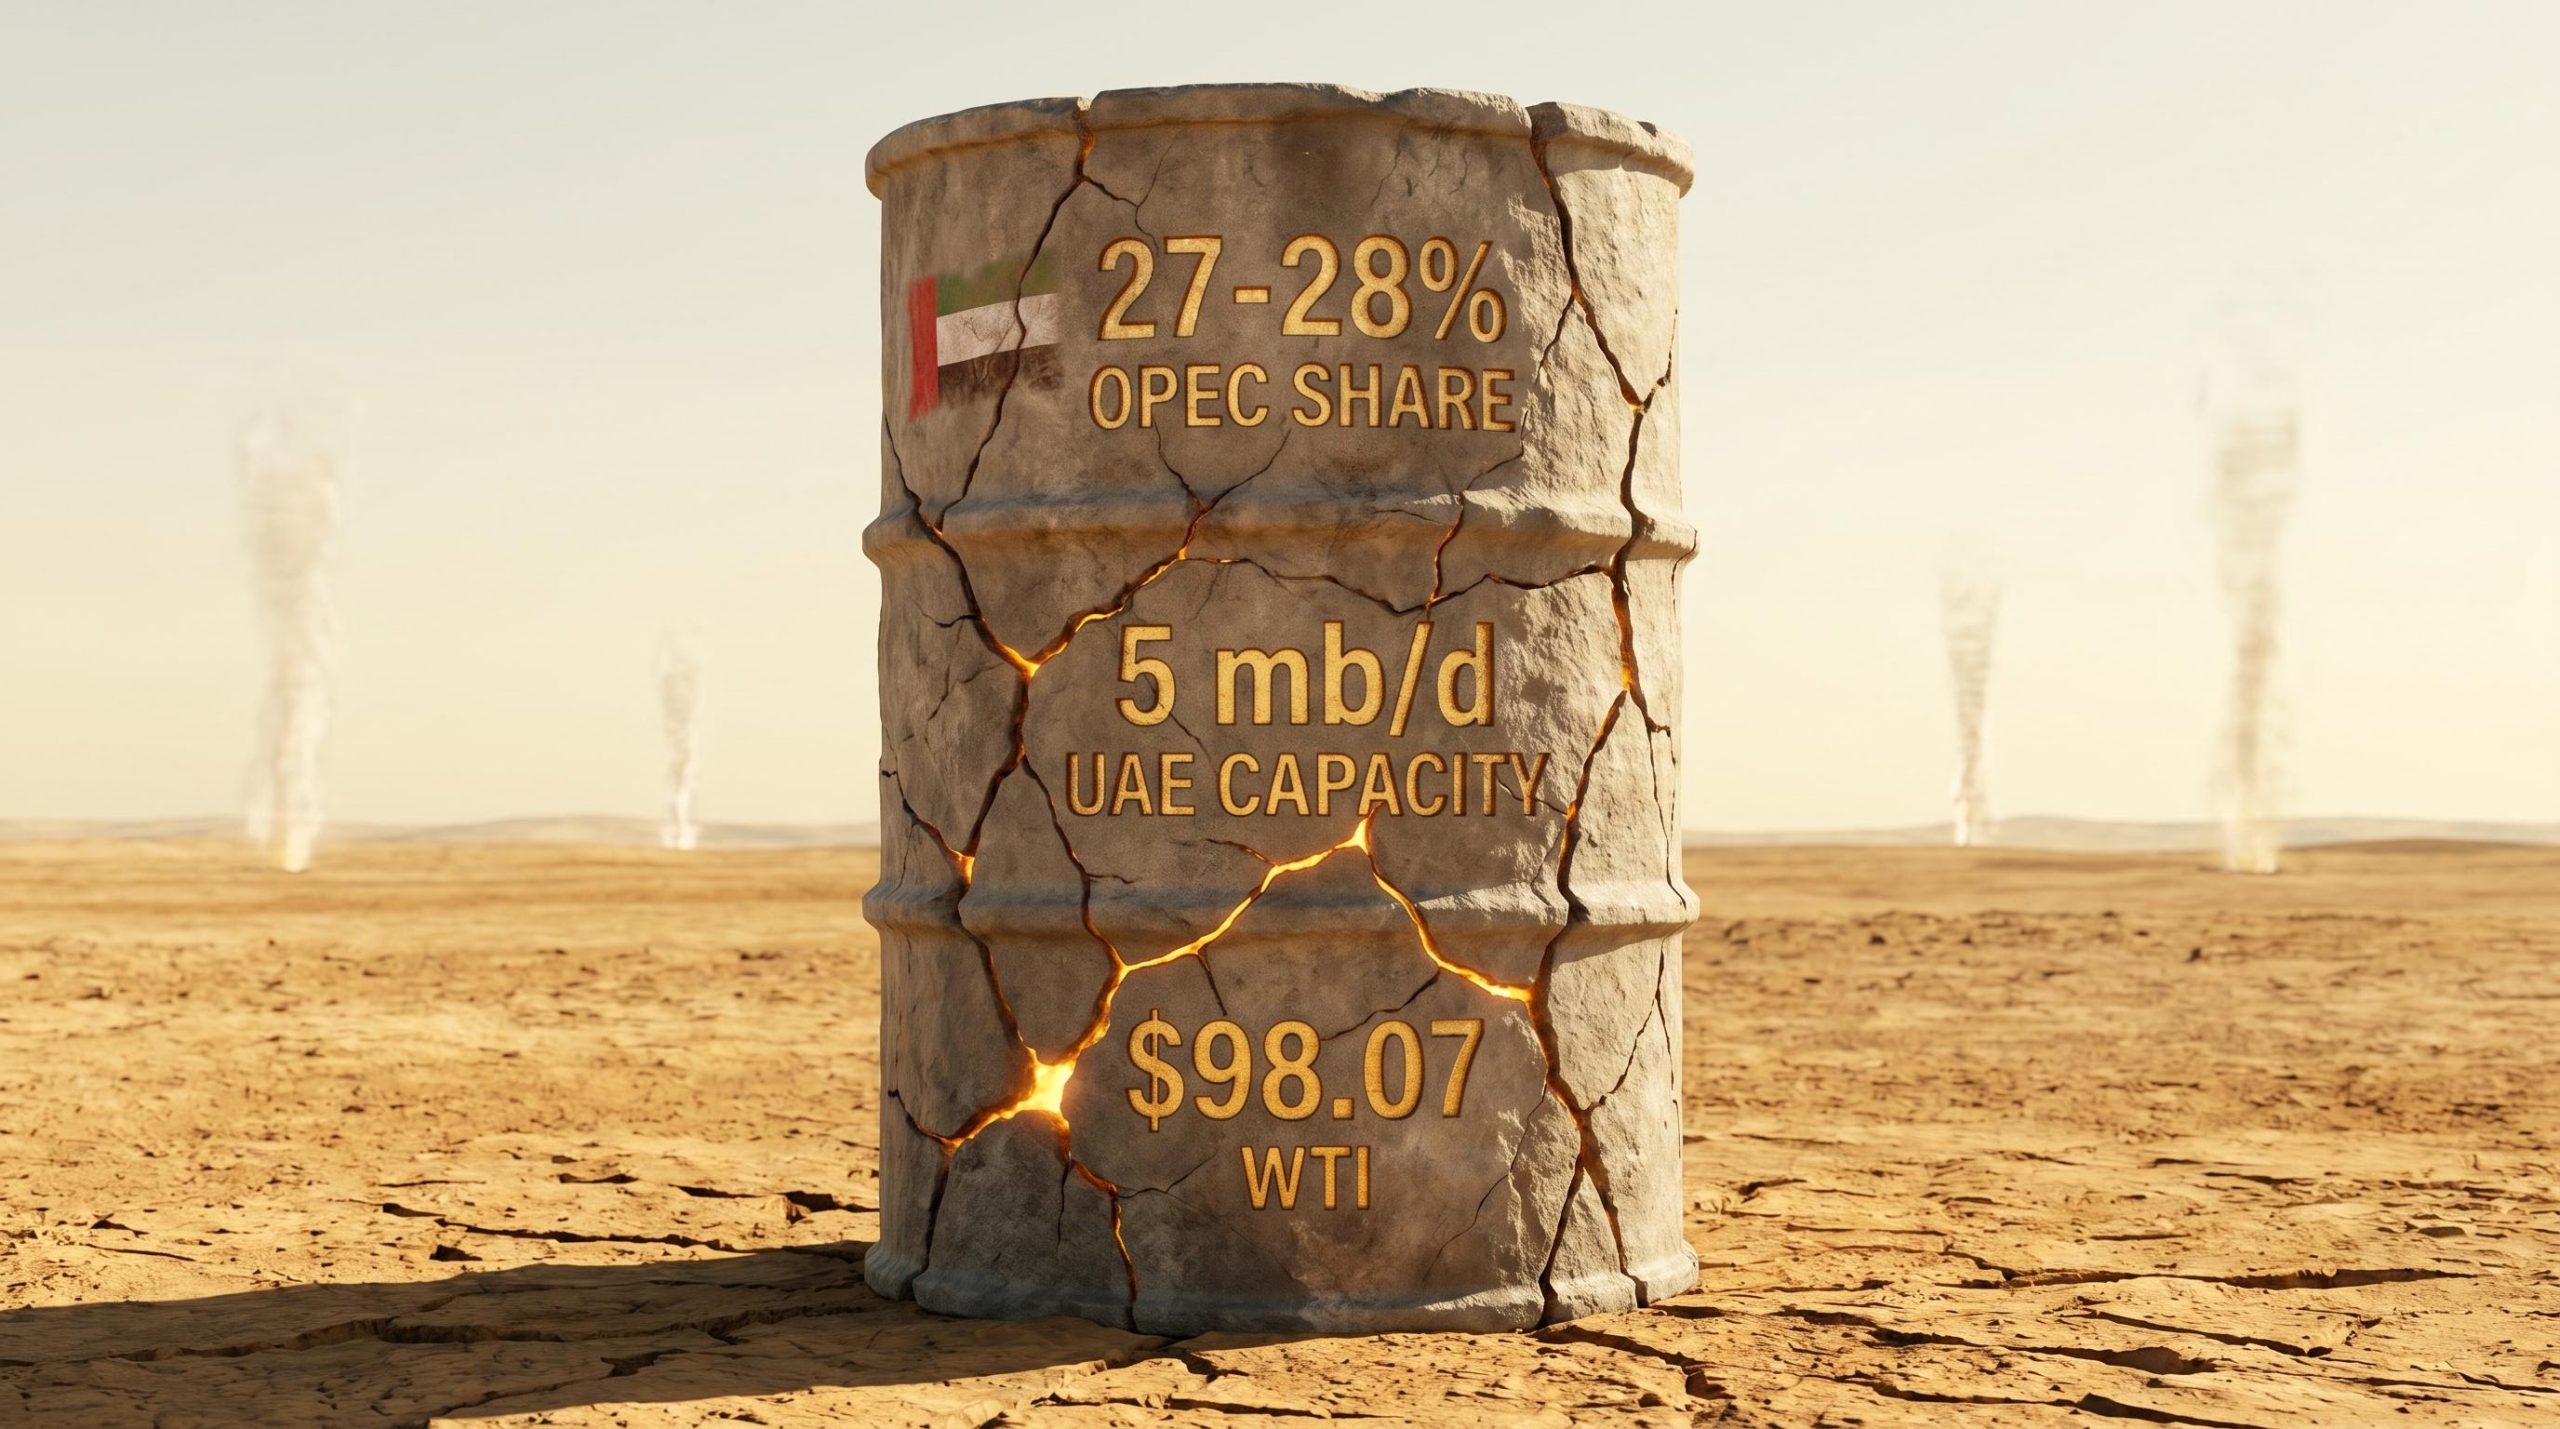
Oil prices fell on the news that OPEC lost its fourth-largest producer. That reaction tells you everything about how investors still misread this market.
On 1 May 2026, the UAE formally withdrew from both OPEC and OPEC+, ending a membership defined in its final years by unresolved quota disputes and strategic divergence. The move arrived against an already-disrupted backdrop: a US-Israeli military campaign against Iran has blockaded the Strait of Hormuz since late February, constraining output across the Persian Gulf and temporarily masking the full structural implications of the exit. The immediate investor response, focused on short-term supply arithmetic, risks missing the more important underlying story.
The Strait of Hormuz blockade removed approximately 13 million barrels per day from global supply in a single disruption, a scale the IEA described as having no modern parallel, and the absence of any confirmed mediator between Washington and Tehran left the supply constraint without a visible resolution timeline as of early May 2026.
This analysis explains why OPEC’s pricing power has been eroding structurally for decades, why the UAE’s exit is a symptom rather than a cause of that erosion, and why the framework most investors use to assess OPEC’s market influence is systematically miscalibrated.
The UAE’s exit: what the quota dispute reveals about OPEC’s internal contradictions
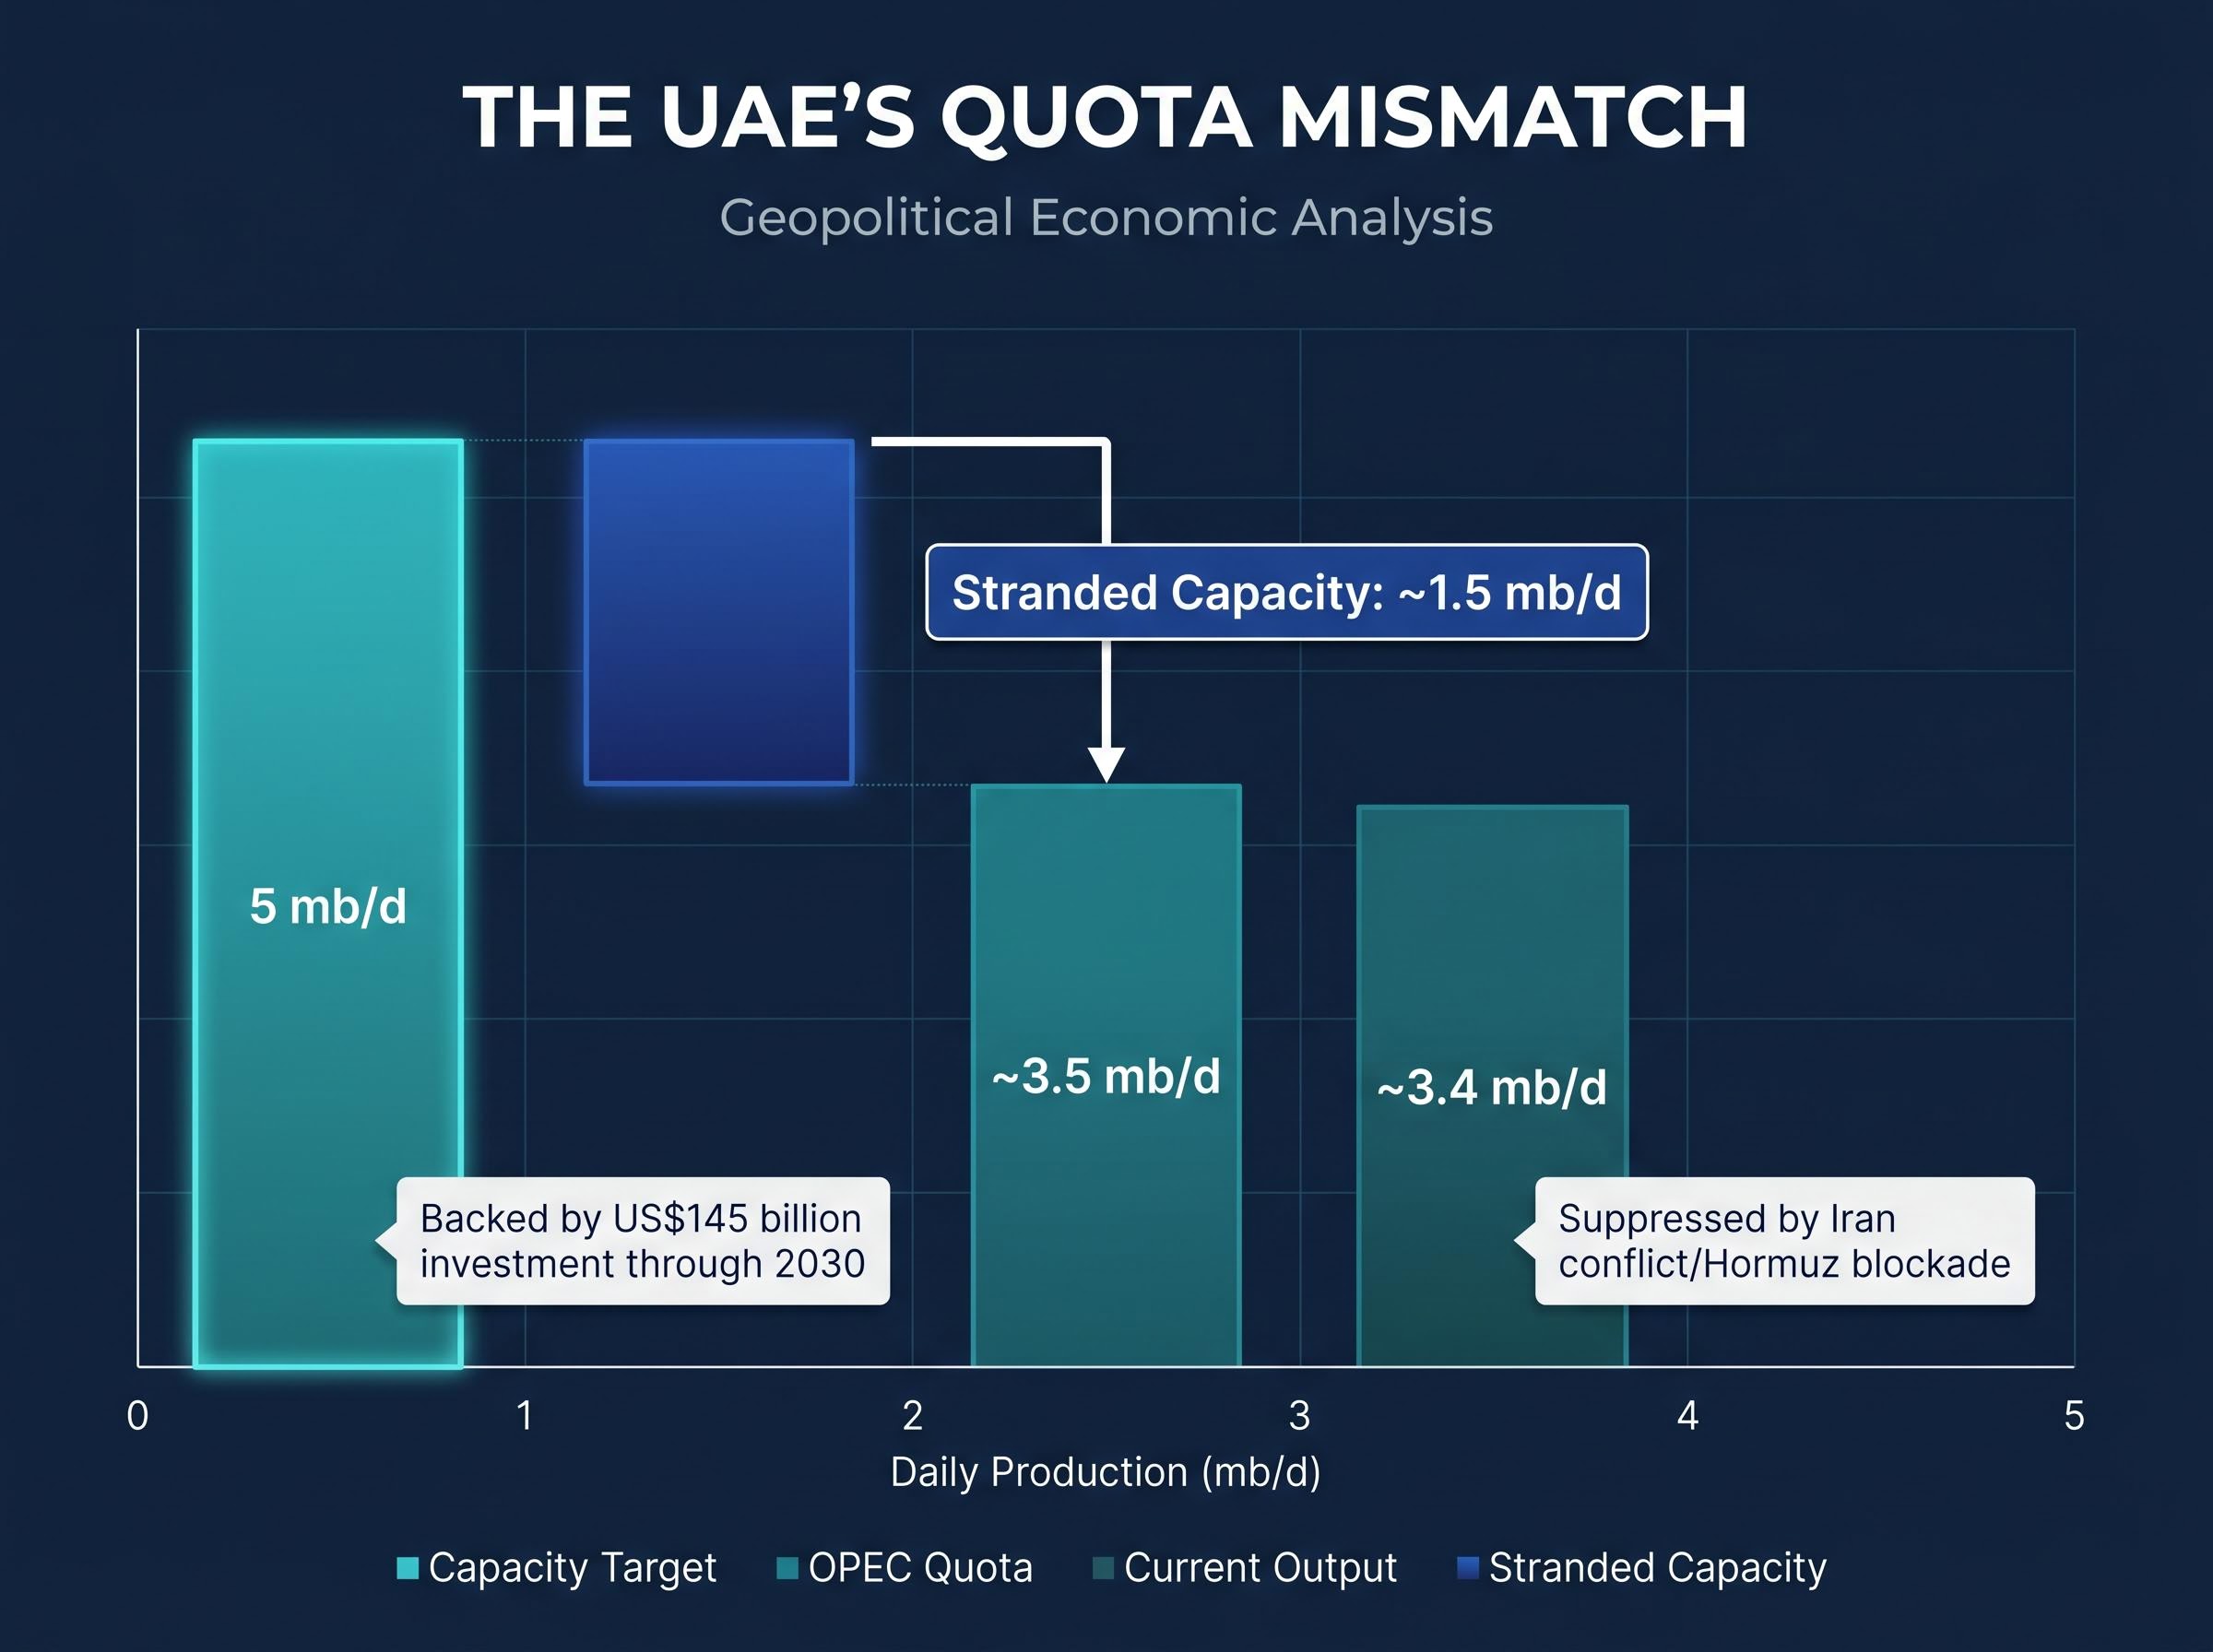
The grievance was straightforward. The UAE had expanded its production capacity toward 5 mb/d by investing US$145 billion in upstream oil development through 2030. OPEC assigned it a quota of approximately 3.5 mb/d. For years, the UAE sought to renegotiate. For years, the renegotiation failed.
The exit followed logically from three compounding pressures:
- Capacity-quota mismatch: The UAE’s production ambitions outgrew a quota framework designed for a smaller producer, leaving approximately 1.5 mb/d of developed capacity stranded under OPEC constraints
- Years of failed renegotiation: Internal diplomacy produced no meaningful quota adjustment, exhausting the case for continued membership
- Geopolitical timing: The Iran conflict and Strait of Hormuz blockade suppressed the UAE’s current output to approximately 3.4 mb/d, creating a window where the exit would not trigger an immediate supply shock
OPEC+’s response reinforced the pattern. On approximately 3 May 2026, the alliance agreed to increase output quotas by 188,000 bpd for June, a move widely characterised as a business-as-usual signal rather than a structural acknowledgement of what had just occurred.
Analysts warn that OPEC’s influence “could be further diminished if some of the remaining members such as Venezuela and Iraq demand a greater say or go the way of the UAE.” The quota tension that drove the UAE out is not unique to the UAE.
When big ASX news breaks, our subscribers know first
What OPEC’s market share numbers actually mean for pricing influence
The market share trajectory tells a story investors often compress into a single headline. It should be read as a sequence.
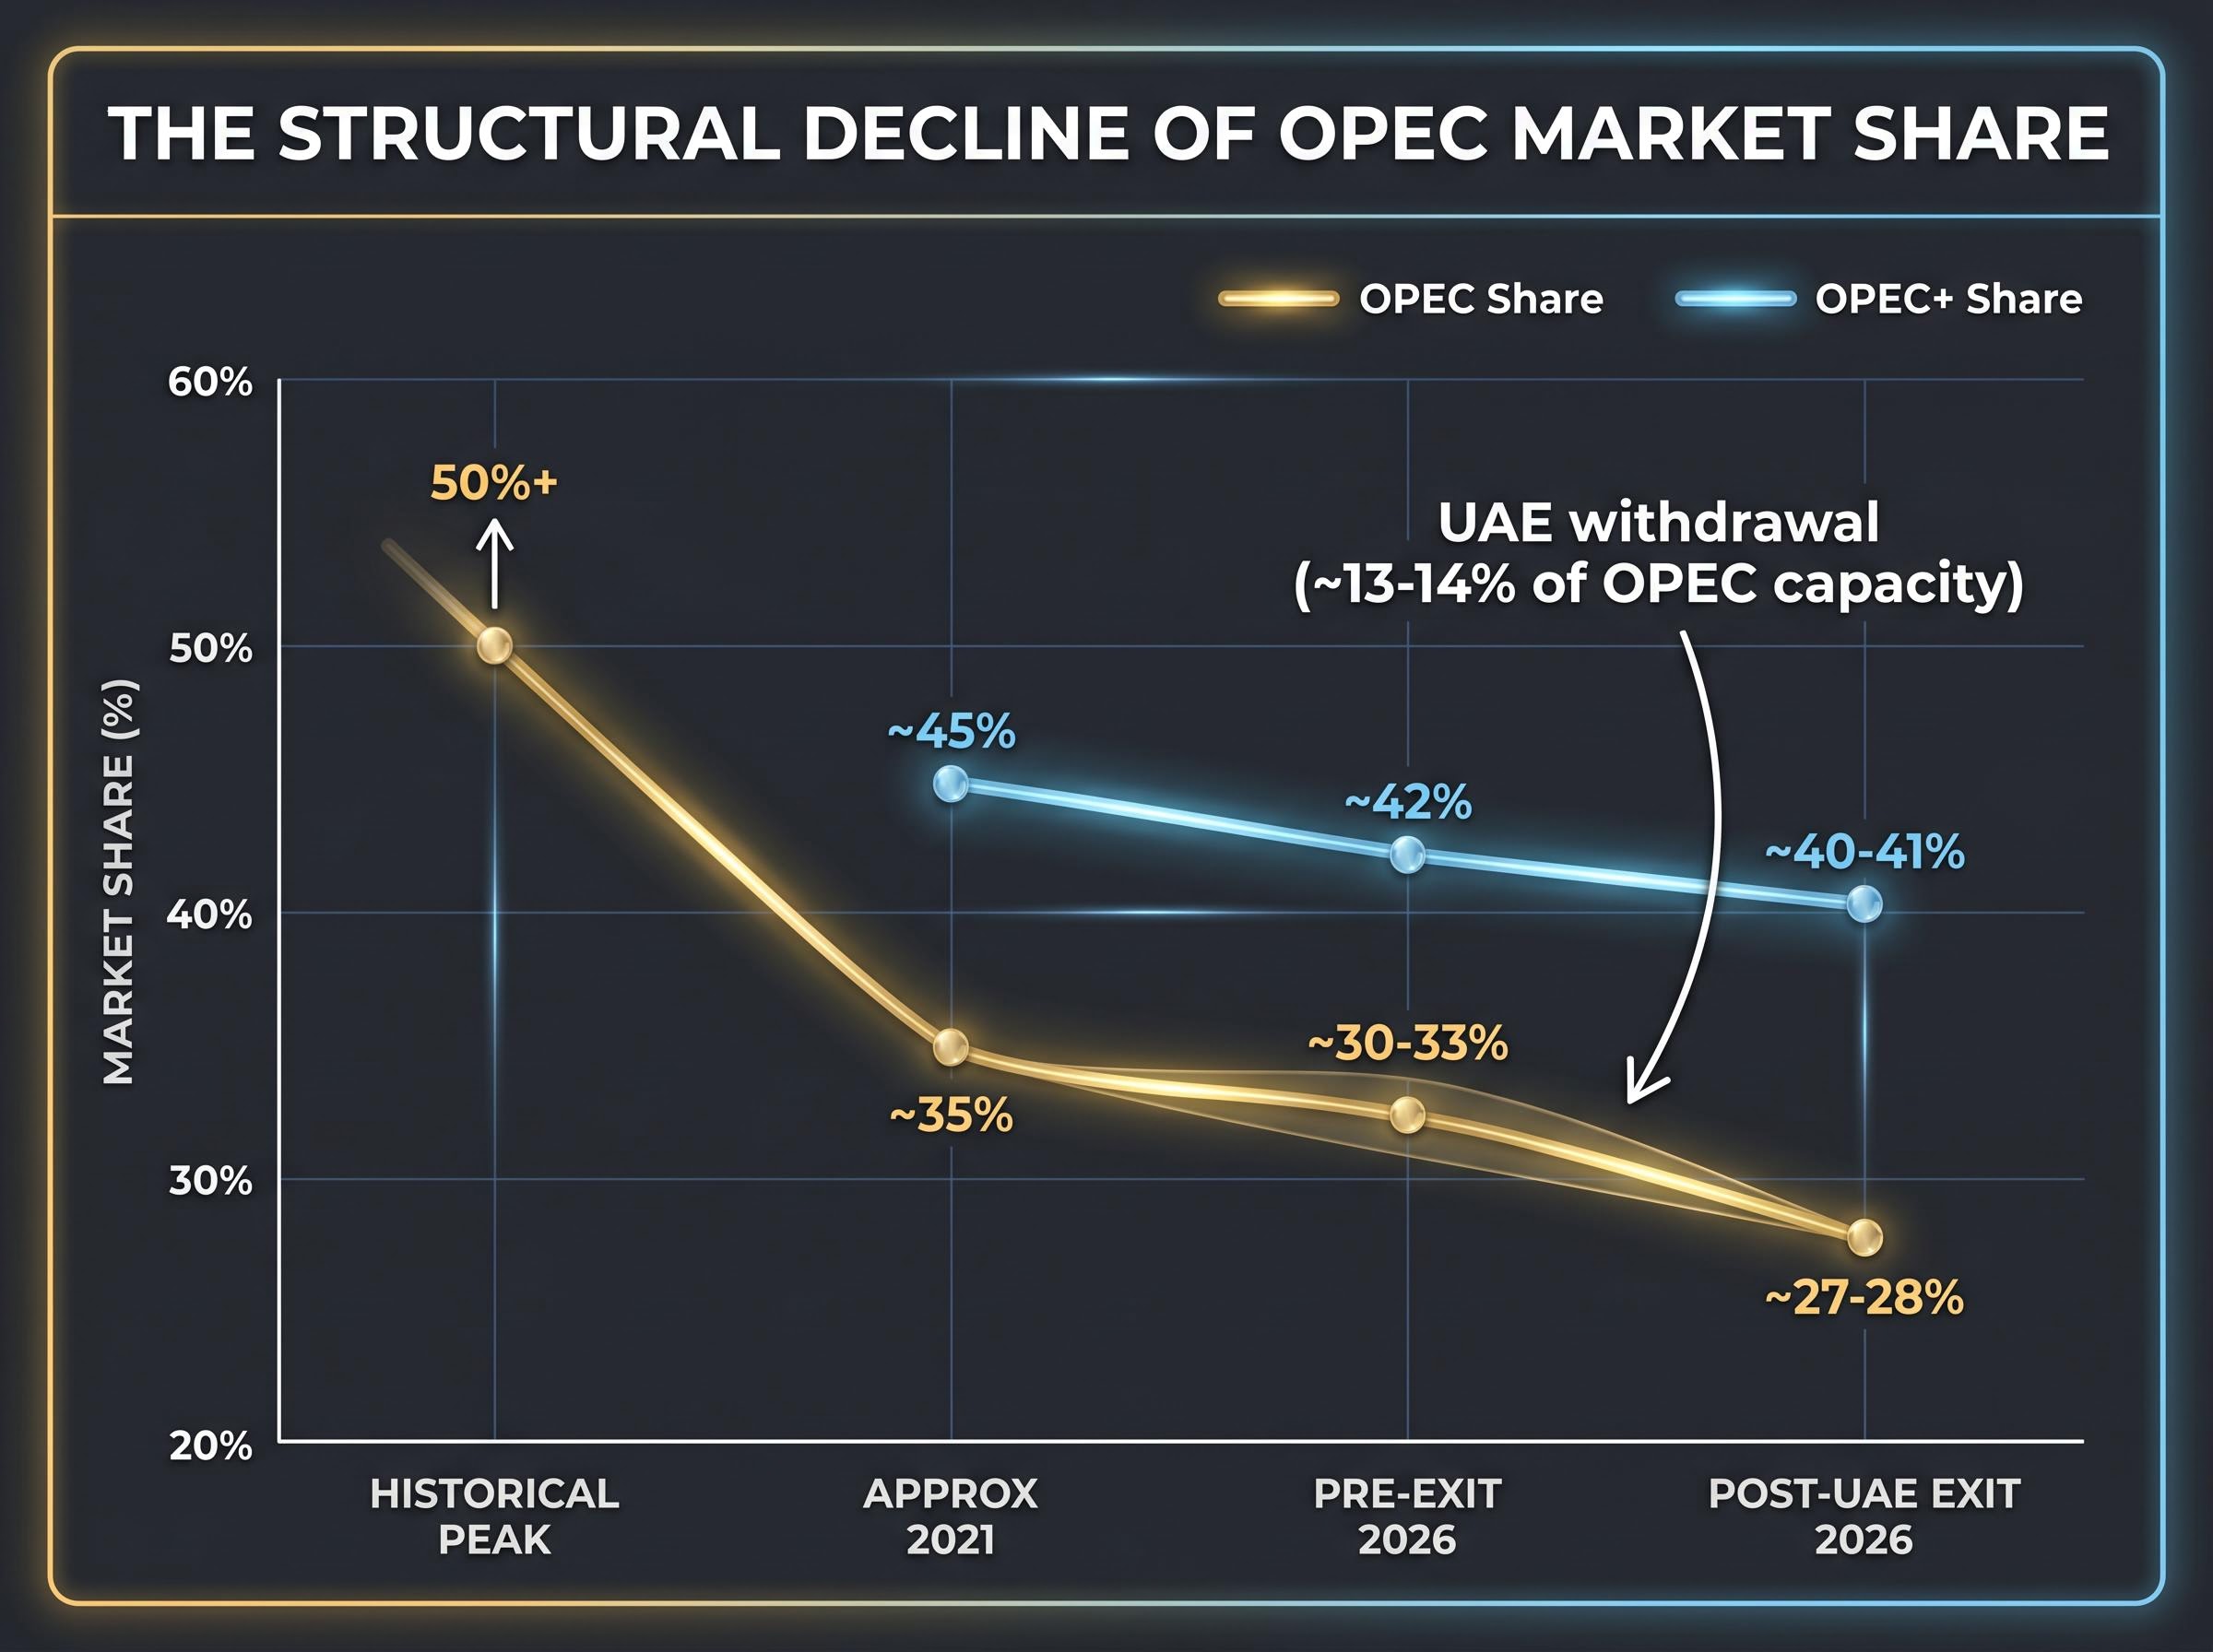
At its historical peak, OPEC controlled more than 50% of global crude production. By the mid-2020s, that share had narrowed to approximately 30-33%. Following the UAE’s departure, the figure sits at roughly 27-28%. Even the broader OPEC+ alliance, which includes Russia and associated producers, accounts for only about 40-41% of global supply.
| Period | OPEC Share | OPEC+ Share | Key Driver of Change |
|---|---|---|---|
| Historical peak | 50%+ | N/A | Pre-shale dominance of global supply |
| Approximately 2021 | ~35% | ~45% | US shale expansion; OPEC+ formation |
| Pre-exit 2026 | ~30-33% | ~42% | Continued non-OPEC growth |
| Post-UAE exit 2026 | ~27-28% | ~40-41% | UAE withdrawal (~13-14% of OPEC capacity) |
The numbers matter because of how OPEC’s pricing mechanism actually works. Wood Mackenzie Chairman and Chief Analyst Simon Flowers has articulated the distinction directly:
“OPEC does not set oil prices directly but influences them by adjusting supply. The exit of the UAE from OPEC reduces the volume of oil managed through coordinated quotas, narrowing the portion of the market through which the group can influence prices.”
That distinction, between setting prices and influencing marginal supply, is where most investor analysis goes wrong. OPEC’s leverage has always been indirect. As the share of global production under coordinated management shrinks from 50% to 27%, that indirect leverage narrows proportionally. The UAE exit is not a shock; it is one more data point in a decades-long compression.
The spare capacity implications of the UAE’s departure extend beyond the raw market share reduction; ADNOC’s 5 mb/d target represents a disproportionate share of OPEC’s crisis-response toolkit, meaning the cartel loses more pricing flexibility than the percentage-point shift in coordinated supply alone would suggest.
How US, Brazilian, and Guyanese supply fragmented the market OPEC once dominated
While OPEC’s coordinated share contracted, the supply that replaced it arrived from producers with no interest in quota frameworks.
The US Permian Basin expansion is the centrepiece. US crude oil production averaged 13.2 mb/d in 2025, with projections of approximately 13.5 mb/d for 2026. That positions the United States at roughly 20-22% of global crude output, making it the world’s primary swing producer and the single largest source of production growth outside any coordinated management system.
The EIA petroleum liquids supply forecasts for 2025-2026 document US crude production averaging 13.2 mb/d in 2025 and rising toward 13.5 mb/d in 2026, confirming that non-OPEC+ supply growth is the dominant structural force reshaping global production balances.
The four major non-OPEC supply contributors now shaping the market:
- United States (Permian Basin): 13.2-13.5 mb/d, approximately 20-22% of global output; the dominant non-OPEC swing producer
- Guyana (Stabroek Field): Expansion through 2026-2027 positions it as a significant supply disruptor outside any quota framework
- Brazil (pre-salt fields): Structural contributor to the non-OPEC supply base with continued deepwater development
- Canada (oil sands): Established long-cycle production adding steady non-OPEC volume
The next wave: Brazil, Canada, and Guyana
Guyana’s Stabroek Field expansion represents the most concentrated example of new supply arriving entirely outside OPEC’s reach. Brazil’s pre-salt programme and Canada’s oil sands operations add further structural volume. Specific current output figures for these three producers were unavailable at time of publication; the EIA International Energy Outlook provides the most current production data.
The combined effect is supply-side fragmentation that constrains OPEC’s ability to influence prices regardless of how well the remaining members coordinate internally. The cartel is no longer managing a majority of the market. It is competing within it.
How cognitive anchoring to past OPEC crises distorts modern market analysis
The 1973-1974 Arab oil embargo caused petrol rationing across Western nations and embedded OPEC’s reputation for pricing omnipotence into investor memory. That reference event still shapes how markets interpret OPEC headlines half a century later.
The structural conditions that made the embargo effective no longer exist. OPEC controlled more than half of global supply. Non-OPEC alternatives were limited. Economies were far more energy-intensive per unit of GDP. Today, OPEC controls roughly 27-28% of production, non-OPEC supply is diversified across multiple continents, and advanced economies have reduced their oil intensity significantly.
The contrast with the May 2026 UAE exit is instructive. On 6 May 2026, WTI crude traded at $98.07/bbl (down 4.11% from the prior day) and Brent crude at $106.38/bbl (down 3.17%). Prices declined. No spike materialised. No panic selling was observed.
The oil price and supply disconnect that opened on 6 May 2026, with WTI falling to $100.37 even as the Hormuz closure remained in effect and a Ukrainian drone strike took Russia’s 400,000 bpd Kirishi refinery offline simultaneously, illustrates precisely the near-term versus medium-term distinction this analysis urges investors to apply.
Fisher Investments has characterised the persistent investor tendency to overweight OPEC scenarios as a “false fear,” noting that markets consistently price in worst-case OPEC disruptions that subsequently fail to materialise. The pattern is rooted in cognitive anchoring to a structural environment that no longer exists.
Post-exit analyst consensus points to Brent averaging approximately $100-110/bbl in 2026, with downside risk to approximately $90/bbl by 2027 if oversupply materialises. A three-step framework can help investors evaluate future OPEC-related market reactions more accurately:
- Assess actual OPEC share of global coordinated supply at the time of the announcement, not the share from memory or historical association
- Evaluate near-term geopolitical constraints on whether announced supply changes can physically reach the market
- Separate symbolic announcements from production-volume reality, treating OPEC decisions as cohesion signals rather than price-determinative events
The demand dimension OPEC cannot manage: energy transition as the second structural force
OPEC’s quota coordination is a supply-management tool. It cannot address what is happening on the other side of the equation.
Renewable energy growth, electric vehicle adoption, and energy efficiency improvements represent structural demand headwinds that operate independently of any quota decision. Wood Mackenzie explicitly conditions the medium-term oversupply scenario, with Brent potentially falling toward $90/bbl by 2027, on demand growth slowing alongside non-OPEC supply expansion. The energy transition trajectory is the variable that determines which price scenario materialises.
Global equities offer a useful parallel. Markets declined roughly 9% during Q1 2026 following the onset of the Iran conflict, then recovered to record highs by April 2026. Equity investors are already looking through short-term oil disruption. The question is whether oil markets will follow the same pattern as structural demand shifts compound.
Investors wanting to model how the current disruption might affect equity portfolio returns will find our full explainer on oil shocks and S&P 500 returns, which examines every prior episode of Brent crossing $100 per barrel since 2008 and documents the S&P 500 underperformance patterns, institutional positioning recommendations from Goldman Sachs, Morgan Stanley, and JPMorgan, and the research evidence against reactive retail trading during geopolitical volatility.
| Timeframe | OPEC Pricing Influence | Oil Price Trajectory | Key Variable |
|---|---|---|---|
| Near-term (2026) | Reduced but geopolitically masked | Brent $100-110/bbl | Strait of Hormuz blockade duration |
| Medium-term (2027) | Materially weakened | Downside risk to ~$90/bbl | Non-OPEC supply ramp + UAE capacity |
| Long-term (2028+) | Structurally diminished | Contingent on demand trajectory | Energy transition pace and EV adoption |
Specific IEA World Energy Outlook 2025 demand scenarios and Bloomberg NEF long-term modelling were unavailable at time of publication. Readers seeking quantified long-term demand trajectories should consult those sources directly. Stranded asset risk for remaining OPEC production capacity is a concern noted across the analytical literature, though specific quantification remains limited.
The UAE’s exit is a deferred supply shock, not an immediate one
The near-term calm is real. Approximately 2 mb/d of UAE production remains offline due to the Strait of Hormuz blockade. The exit’s immediate supply impact is effectively suppressed by the same geopolitical disruption that provided the timing for it.
That calm is contingent, not structural. When the blockade lifts and the UAE ramps toward its 5 mb/d capacity target, OPEC permanently loses approximately 14% of its coordinated production capacity, according to Wood Mackenzie estimates. The medium-term inflection arrives at that point, not today.
The fragmentation risk extends beyond the UAE. If Venezuela and Iraq pursue similar renegotiations or exits, OPEC’s coordinated share of global supply could fall below levels at which quota management exerts meaningful price influence. Implied volatility in oil markets post-exit sits at 20-25% (medium confidence), reflecting uncertainty about exactly this scenario.
Three investor-actionable implications follow:
- Reweight OPEC announcements in price analysis: Treat monthly output decisions as cohesion indicators, not price-setting events
- Monitor Hormuz blockade resolution: This is the near-term trigger that activates the medium-term supply dynamics the market is currently discounting
- Watch Venezuela and Iraq for fragmentation signals: Similar quota grievances in either member would accelerate the structural erosion thesis
What to watch as the structural story unfolds
The Strait of Hormuz blockade resolution is the single most important near-term catalyst. Once the blockade lifts, the market will confront the full volume implications of the UAE’s exit for the first time.
OPEC compliance rates, tracked by Reuters, serve as the internal cohesion signal most worth monitoring. Falling compliance would indicate that remaining members are exceeding their quotas, further undermining the coordination mechanism that represents OPEC’s only pricing lever.
OPEC is no longer the story. It is a chapter in a larger one.
OPEC’s influence over oil prices has been in structural decline for decades. The UAE’s exit is a symptom of that decline, and the absence of a market spike confirms the gap between perceived and actual pricing power.
The framework this analysis establishes rests on three pillars: assess coordinated supply share (now approximately 27-28% and potentially falling further), evaluate non-OPEC growth (US, Brazil, Guyana, and Canada collectively reshaping the supply base), and weight demand trajectory alongside supply coordination (energy transition as the second structural force quota management cannot address).
The medium-term story is not about what OPEC decides at its next meeting. It is about whether non-OPEC supply growth and energy transition together make quota coordination increasingly irrelevant. Investors encountering the next OPEC headline should apply the near-term versus medium-term distinction before reacting.
The EIA International Energy Outlook and IEA Oil Market Reports provide the most current non-OPEC production data and demand scenario modelling for those seeking to build on this framework.
This article is for informational purposes only and should not be considered financial advice. Investors should conduct their own research and consult with financial professionals before making investment decisions. Post-exit analyst forecasts and price projections are subject to market conditions and various risk factors. Past performance does not guarantee future results.