
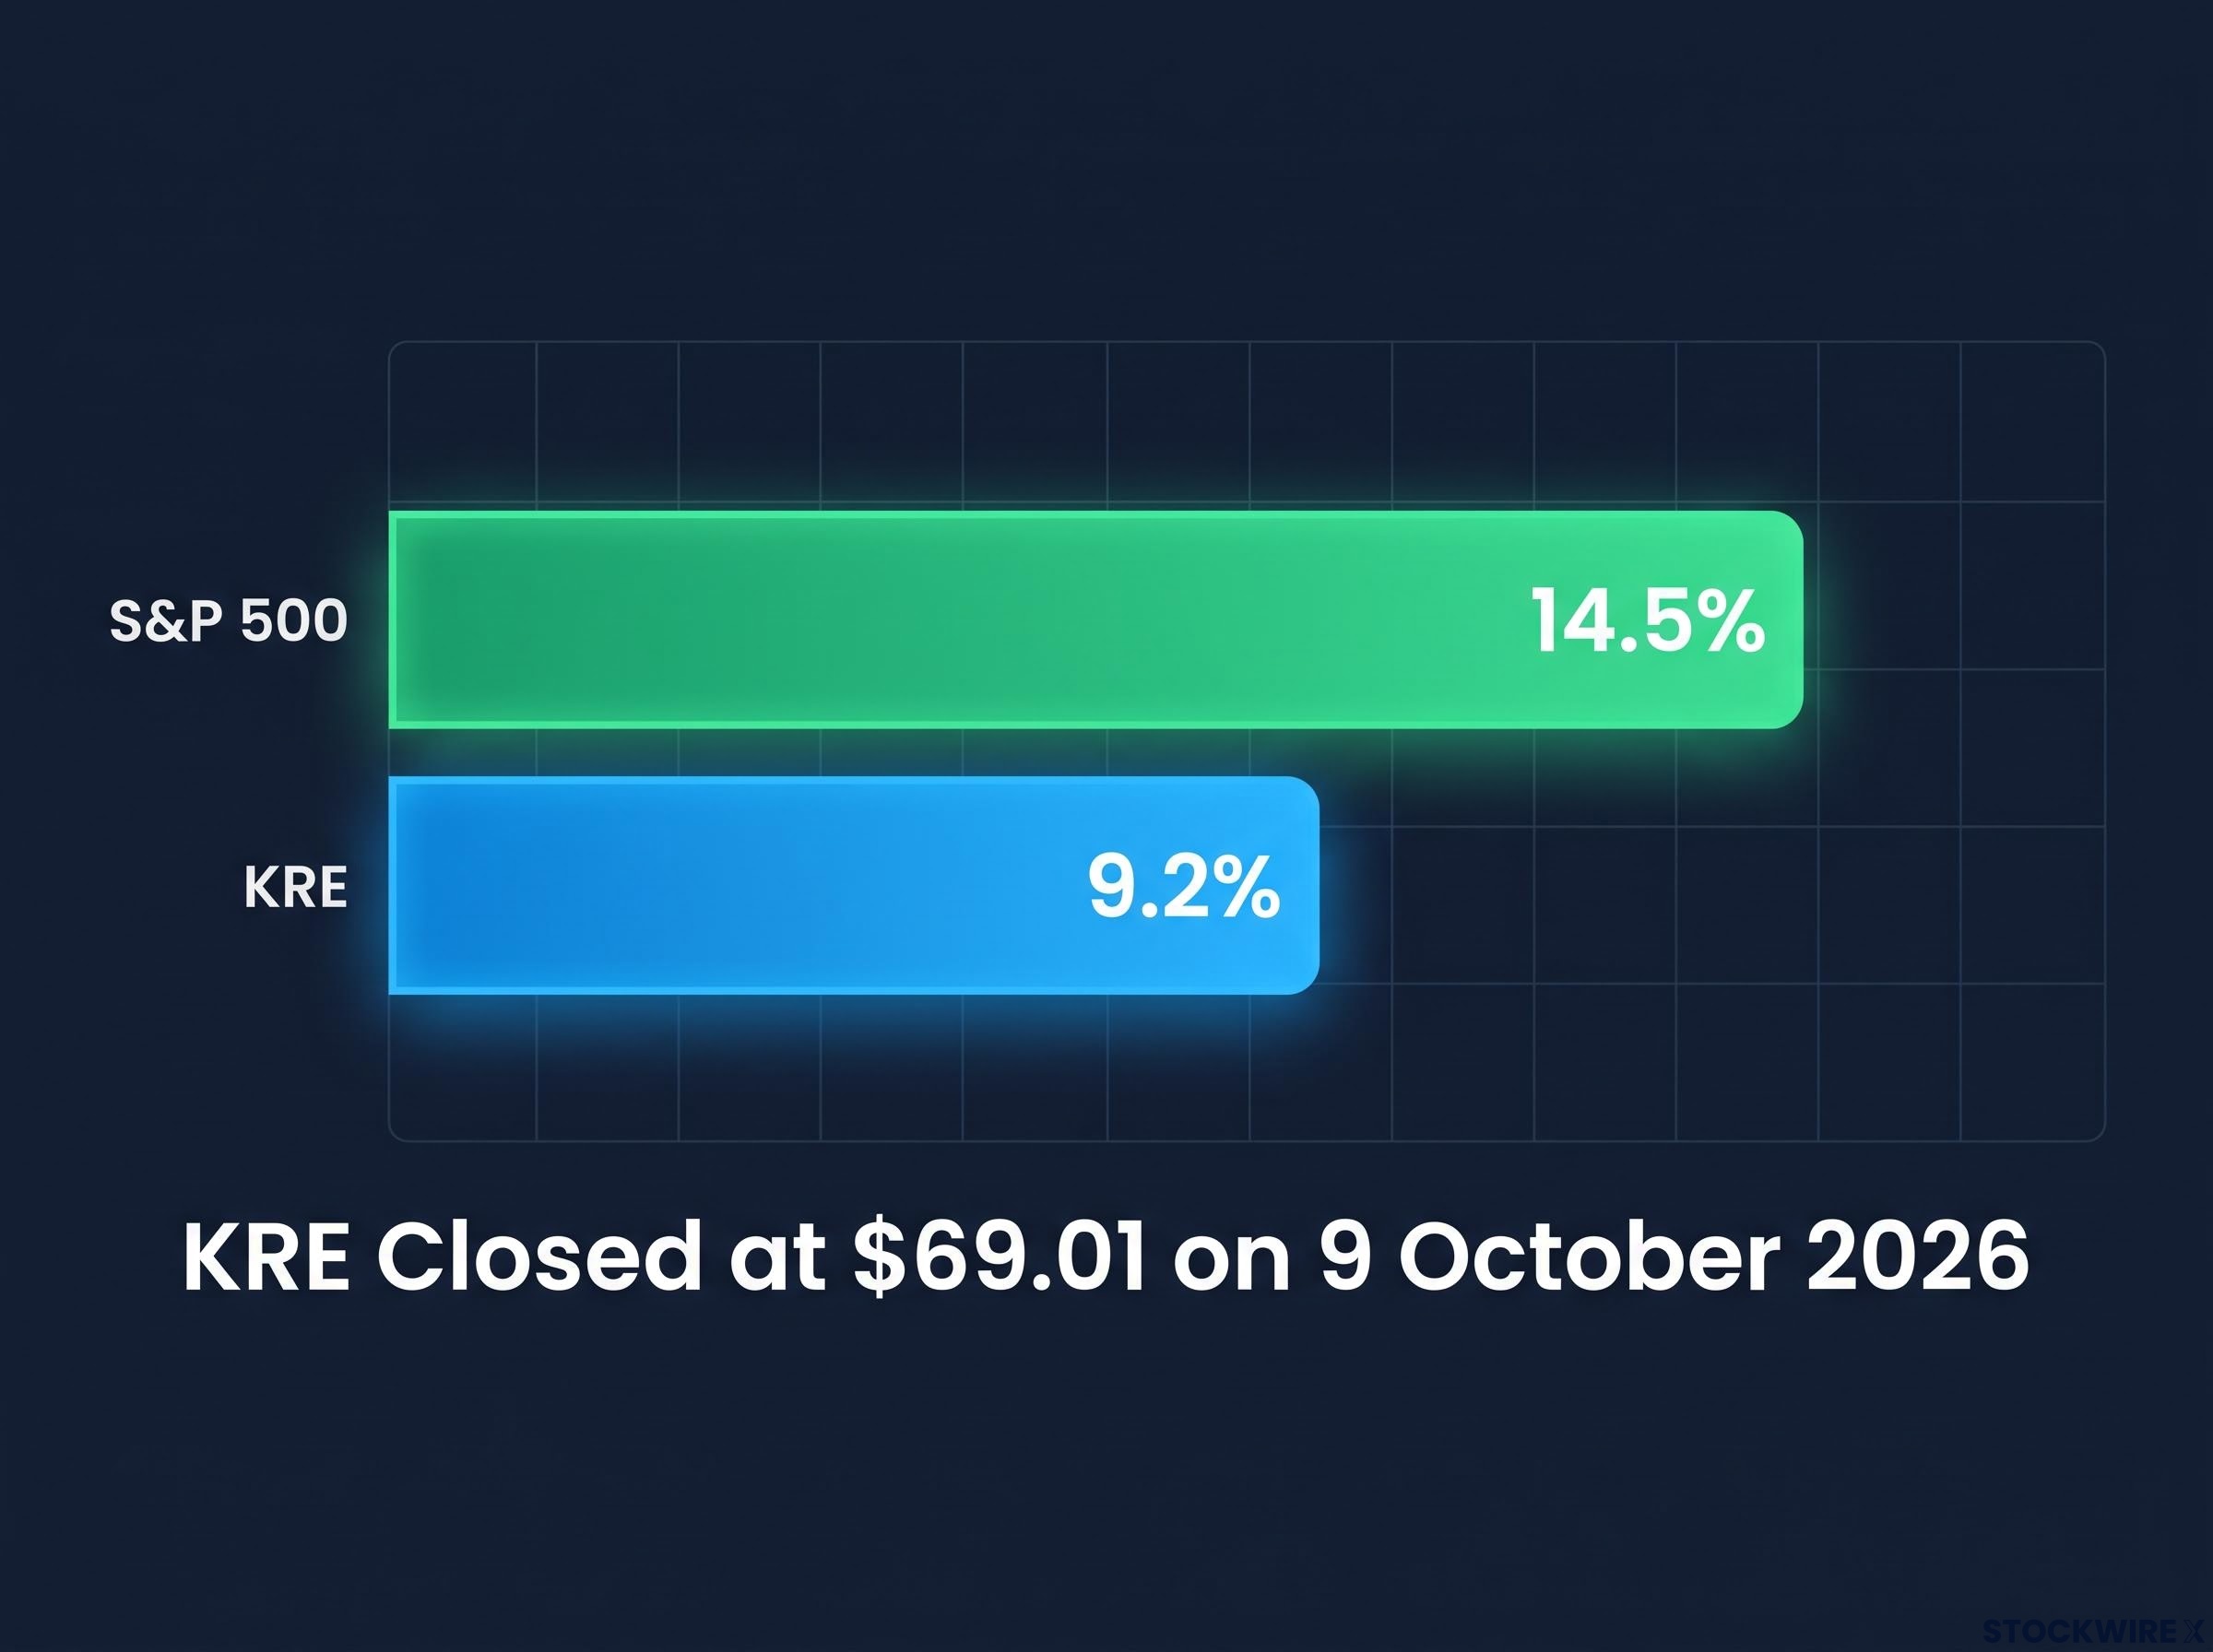
Bonds rallied, yet regional bank stocks barely moved. The SPDR S&P Regional Banking ETF (KRE) has delivered a year-to-date total return of about 9.2%, against roughly 14.5% for the S&P 500. Many investors read that gap as a rate story that will fix itself, but the regional banks disruption now under way suggests it may not.
On CNBC’s Overtime, panelists traced the weakness to the March 2023 failures of Silicon Valley Bank (SVB) and Signature Bank. They also pointed to a newer threat: tools that let money and borrowing move around banks entirely.
The data here runs to early October 2026, and it supports both readings in different places.
Here is how to separate the cyclical drag from the structural threat, so you can judge what KRE’s lag is actually pricing in.
Why are regional banks lagging even after the bond rebound?
The assumption runs like this: when bond prices rise, the bonds sitting on bank balance sheets recover value, so bank shares should follow. That assumption has only partly held this year.
What KRE’s numbers show
KRE closed at $69.01 on Friday, 9 October 2026, down from $69.59 the session before. It began the year near $64.81, which puts the year-to-date total return, with dividends reinvested, at about 9.24%. The S&P 500’s total return over a similar period sits near 14.45%.
The fund was doing better a few weeks ago. A 13.53% year-to-date total return was reported as of 17 September 2026, before later market declines pulled it back.
Over one year, audited data show a total return of about 12.6%. One report put the one-year figure at 15.62%, but that number was not independently confirmed, and the audited reading is the more reliable guide. Either way, KRE trails a broad benchmark that carries far less leverage.
Why leverage amplifies small losses
The drag starts with unrealised losses. An unrealised loss is the fall in a security’s market value that has not yet been locked in by selling it. According to the Federal Deposit Insurance Corporation (FDIC), the industry’s combined losses on securities it holds to sell or to maturity have shrunk steadily.
| Quarter | Unrealised losses | Quarterly change | Change (%) |
|---|---|---|---|
| Q2 2025 | $395.3B | Down $17.9B | 4.3% |
| Q3 2025 | $337.1B | Down $58.2B | 14.7% |
| Q4 2025 | $306.1B | Down $31.0B | 9.2% |
The Q4 2025 figure was the lowest since Q1 2022. It is still more than $300 billion, set against industry equity capital of $2.6 trillion in Q3 2025.
A panelist’s view One Overtime panelist described banks as levered roughly 10 to 1, a structure the panel argued leaves them exposed to runs.
That ratio is a rough characterisation, not a measured figure, and leverage data by bank size was not available. The logic still holds: when a balance sheet is mostly borrowed money, a modest loss on the asset side lands heavily on the thin layer of equity your shares represent.
For you, the takeaway is that a bond bounce alone cannot restore the flexibility and valuation investors were hoping for. Treating KRE as a simple rate bet misses the wound that is still healing.
When big ASX news breaks, our subscribers know first
How are deposit flight, stablecoins and options-based lending challenging the bank model?
A bank makes money in two basic ways. It holds your cash cheaply, and it lends against your assets at a higher rate. Each new challenger chips away at one of those streams.
Deposit mobility and stablecoins
Start with idle cash. AI-assisted personal finance tools can sweep money between bank accounts, money market funds and stablecoins in search of the best yield, removing the inertia that once kept deposits in low-paying accounts. One panelist claimed only about 6% of people are properly allocated in cash products; treat that as a claim, not a measured statistic.
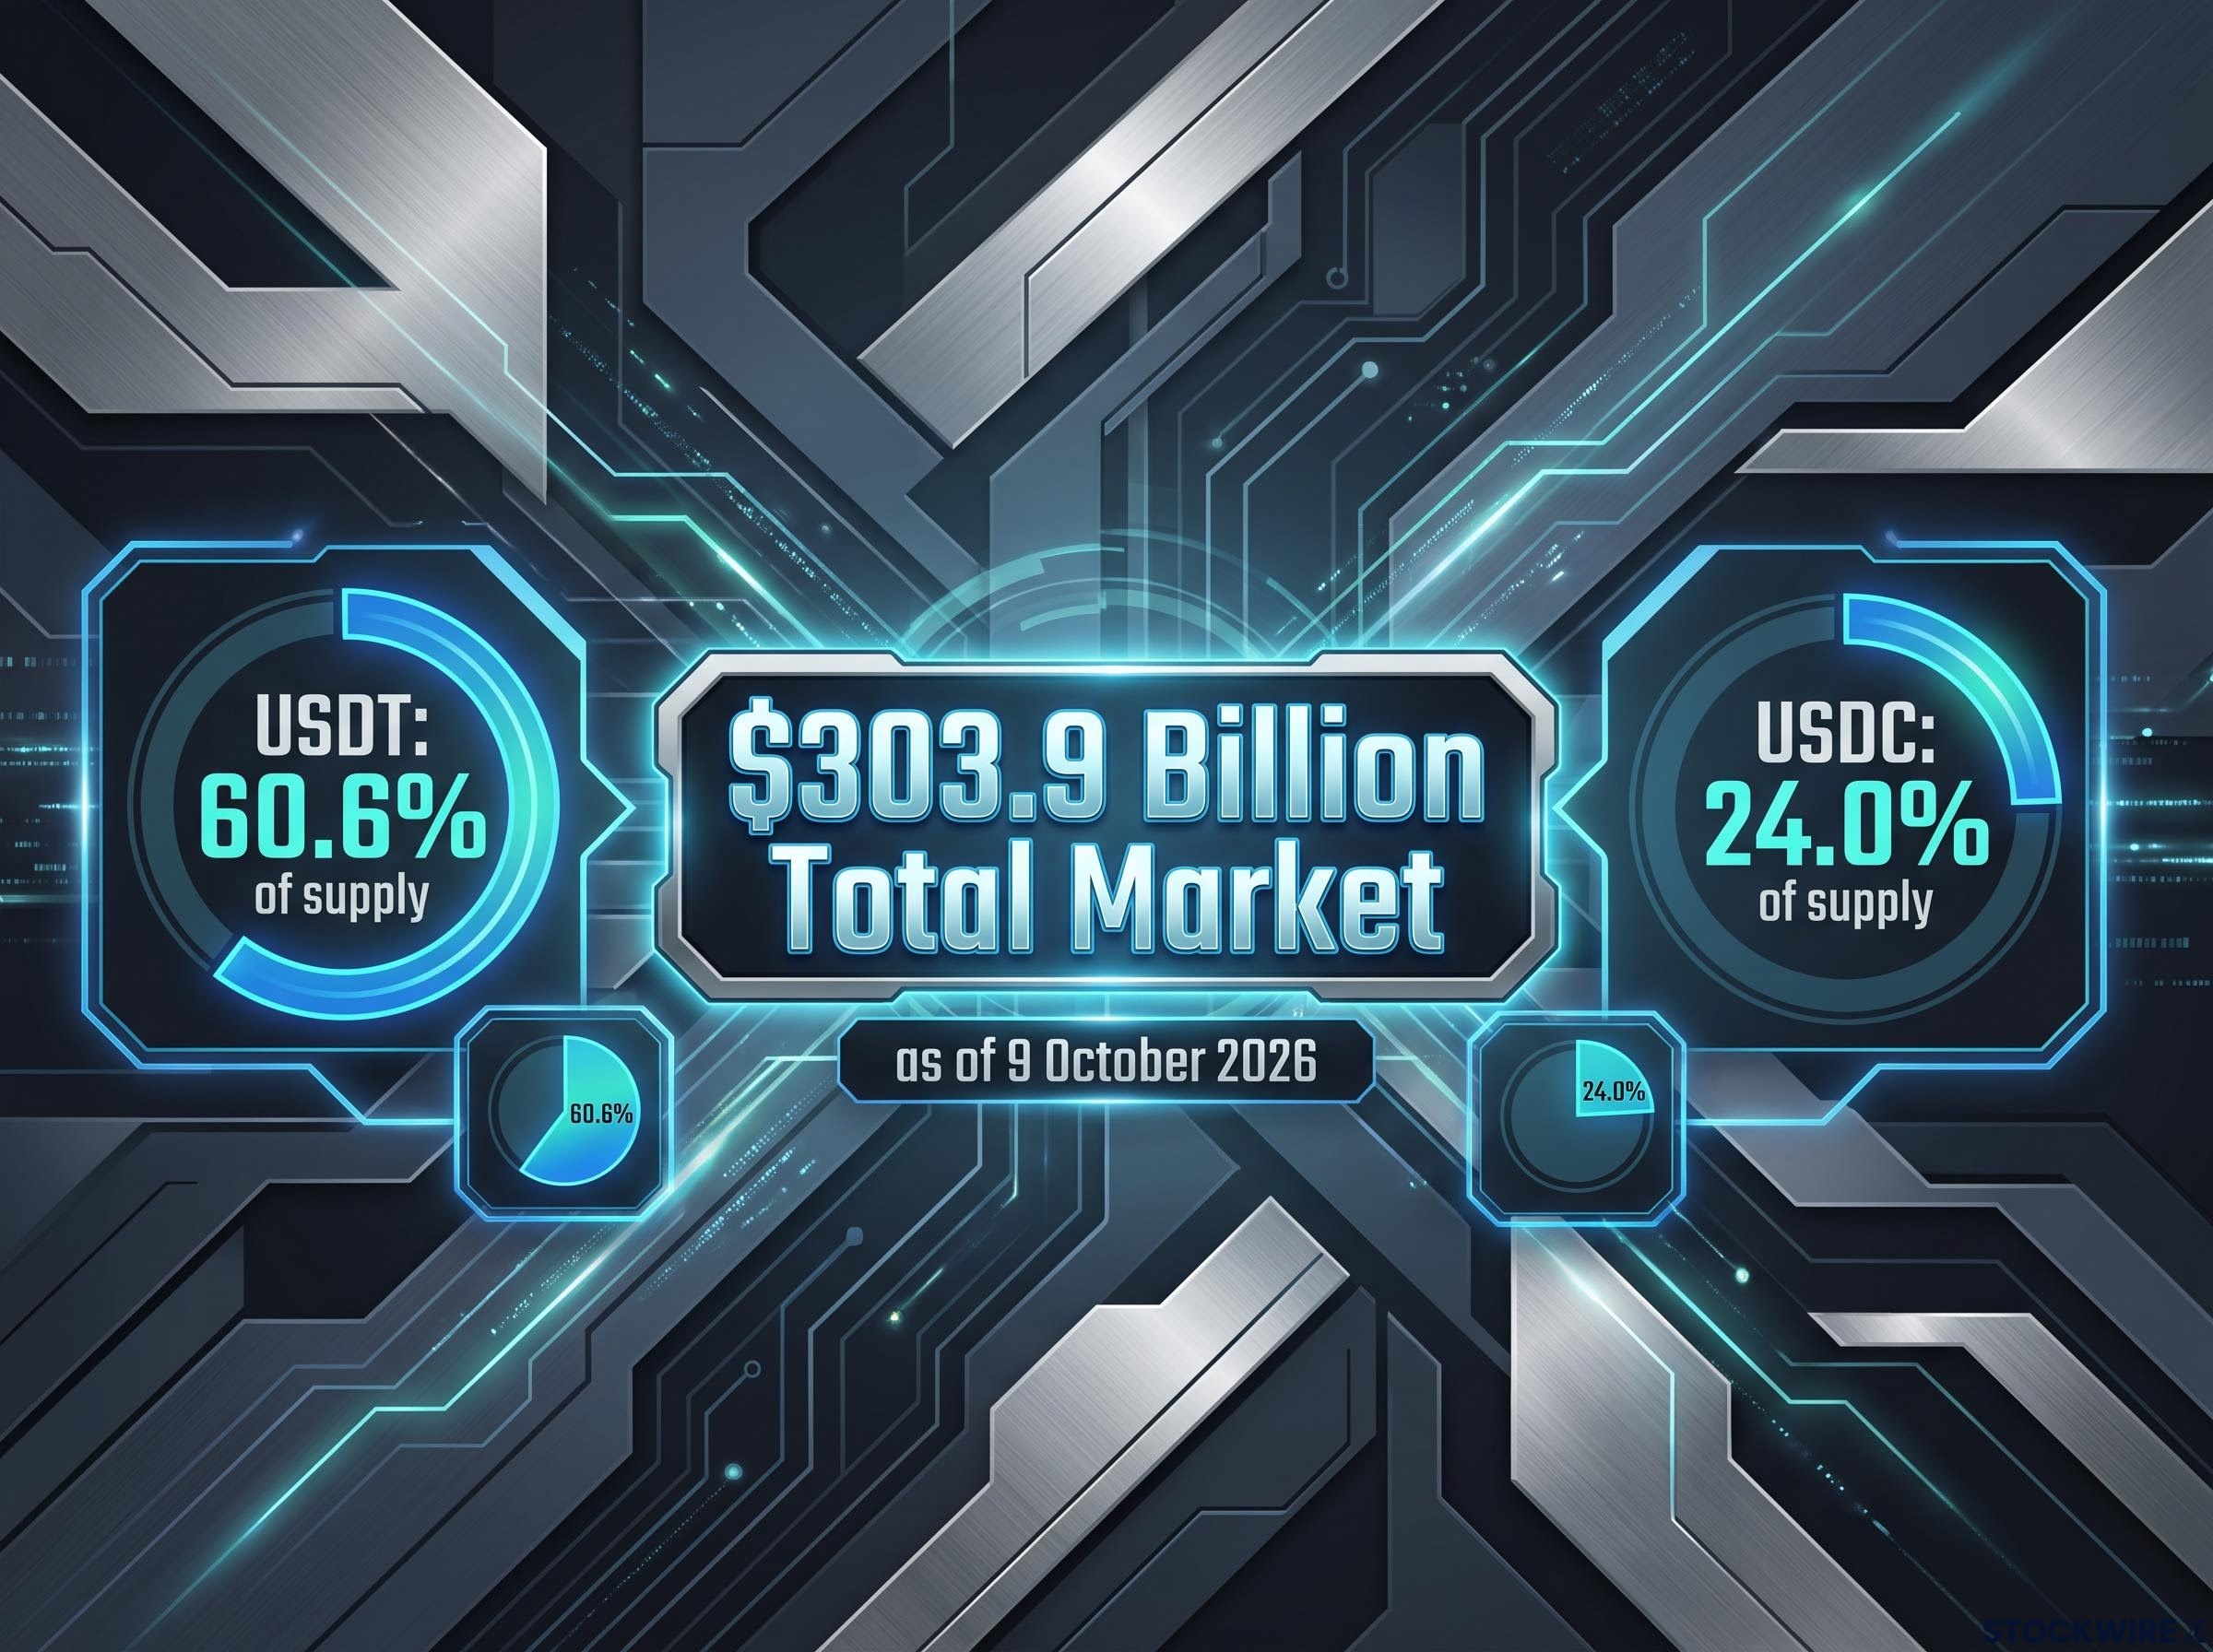
A stablecoin is a digital token designed to hold a fixed value, usually one US dollar. The market totalled about $303.9 billion on 9 October 2026, with USDT at roughly 60.6% of supply and USDC at about 24.0%. These tokens move around the clock, outside the banking system.
No stablecoin or tokenised-deposit law, including the proposed GENIUS Act, could be confirmed as enacted. That rules matter is clear; what they will be is not.
Headline deposits look calm. Federal Reserve data show commercial bank deposits of about $19.52 trillion in August 2026 and roughly $19.69 trillion on a seasonally adjusted basis at 30 September 2026. Large time deposits appear to have risen from about $2.53 trillion to $2.58 trillion between May and September, though those figures are unverified.
That tilt is the signal. Stable totals can hide a change in who holds deposits and at what price, so watch funding costs and margins rather than the headline balance.
Headline totals can mask uninsured deposit exposure, since roughly 43% of domestic deposits sit above the FDIC limit and can leave a bank far faster than insured balances ever could.
Box spreads and prepaid forwards
A box spread combines a call spread and a put spread at identical strike prices and expiry dates. The result pays a fixed amount at expiry, which works like a loan: you can borrow or lend at a set rate through a brokerage account instead of a bank.
A variable prepaid forward (VPF) gives an investor upfront cash in exchange for delivering a variable number of shares later, within a range of prices called a collar. Broker-dealers typically arrange them, and they offer liquidity similar to a margin loan without a regional bank involved.
| Challenger | What it replaces | How it works | Main risk |
|---|---|---|---|
| AI cash tools and stablecoins | Low-yield deposits, payments | Automated sweeps and 24/7 token rails | Unsettled regulation |
| Box spreads | Bank loans, CDs | Options combination with a fixed payoff | Early assignment, margin changes |
| VPFs | Margin and securities-based loans | Cash now for shares delivered later | Tax treatment, unwind costs |
These tools carry real caveats:
- The IRS has examined whether VPFs amount to constructive sales, which could trigger immediate capital gains tax.
- The SEC has scrutinised complex derivatives sold to retail and wealthy investors.
- Box spreads face early-assignment, counterparty and margin risks, while VPFs can be costly to unwind.
Even with those frictions, the products target some of the highest-margin lending banks offer. That erosion matters even when no run is under way.
How does today’s weakness compare with the SVB and Signature episode?
The 2023 failures set the template investors still apply to every regional lender.
- SVB: Held large long-duration securities that lost value as rates rose, funded by concentrated, uninsured tech and venture deposits that fled once social media amplified concerns.
- Signature Bank: Carried heavy crypto-linked deposits and looked vulnerable when that sector turned volatile.
- First Republic: Relied on wealthy clients and jumbo deposits that migrated quickly to larger banks, eventually requiring extraordinary support and resolution.
Much has changed since. Many regionals have built stronger buffers, supervisors have pushed banks to be ready to use the discount window (the Fed’s emergency lending facility), and the Federal Home Loan Banks (FHLB) remain available. Unrealised losses have fallen to $306.1 billion from $395.3 billion in mid-2025.
| Factor | 2023 | Now |
|---|---|---|
| Securities losses | Large and rising with rates | Easing, still above $300B |
| Deposit mix | Concentrated, uninsured at failed banks | More diversified, wealth deposits still mobile |
| Backstops | Discount window under-used | Greater operational readiness, FHLB access |
| Run speed | Accelerated by mobile banking and social media | Could be faster with AI and 24/7 rails |
The stresses have not vanished. Regional strains between 2024 and 2026 often involved commercial property exposure and reliance on brokered deposits and FHLB advances, and coverage kept tying them back to the SVB pattern.
Stress test scenario design mattered as much as bank balance sheets in 2023, because the Fed’s standard test assumed falling yields and so never measured the rate losses that sank SVB.
Technology is the wild card. SVB’s deposits mostly moved to larger banks and money funds; future outflows could flow straight into tokens, and AI agents could act faster than people.
Backstops may slow a failure, but they do not prevent severe equity drawdowns. A 2023-style collapse looks less likely for diversified lenders, yet share prices can still be marked down on funding fragility, so judge each bank on its deposit mix rather than its sector label.
Structural disruption or cyclical pressure: what should KRE investors weigh?
Both camps bring evidence.
- Structural camp: Commentary from KBW and Morningstar through 2023 and 2024 argued regionals face permanently higher deposit costs as customers shift cash to money funds and Treasuries. The Fed’s Michael Barr and the FDIC’s Martin Gruenberg highlighted how digital, social-media-driven runs exposed deposits as flighty, and the Bank for International Settlements (BIS) has flagged activity migrating to non-bank channels.
- Cyclical camp: The American Bankers Association sees rate-cycle whiplash and isolated mismanagement, not a broken model. Supporters point to stable aggregate deposits, manageable credit losses, FDIC insurance and tighter post-2023 supervision.
For a KRE holder, the debate converges on four implications:
- Securities losses above $300 billion still limit flexibility.
- Funding costs stay elevated as competition for deposits continues.
- Margin lending faces erosion from box spreads, VPFs and broker-dealer credit.
- Valuation overhang can keep KRE lagging even when bonds rally.
What would shift the balance? Falling unrealised losses alongside steady margins would favour the cyclical view; rising funding costs or a surge in stablecoin adoption would favour the structural one. Missing data on uninsured deposit shares and leverage by bank size limits how certain anyone can be.
The synthesis The weight of evidence suggests KRE is pricing a mix of both. Size positions on earnings, funding costs and deposit mix, not on collapse or a clean recovery.
What KRE’s lag does and does not tell you about the bank model
KRE’s underperformance blends legacy balance-sheet damage with genuine competitive erosion. Stable aggregate deposits and stronger backstops argue against assuming collapse, but they do not make the drag disappear.
Three variables will tell you which force is winning:
- The unrealised loss trend in the FDIC’s quarterly data.
- Funding costs and deposit mix, especially the shift towards pricier time deposits.
- Stablecoin or tokenised-deposit legislation that is actually enacted, not merely proposed.
If losses keep shrinking while margins hold, the cyclical case strengthens. If funding costs climb as tokens gain ground, the structural case deserves more weight in your thinking.
Readers interested in the policy backdrop will find our full explainer on stablecoin legislation, which traces how US rules could reshape dollar liquidity worldwide.
This article is for informational purposes only and should not be considered financial advice. Investors should conduct their own research and consult with financial professionals before making investment decisions. Past performance does not guarantee future results, and forward-looking views are speculative and subject to change based on market developments.