
The 30-year US Treasury yielded 5.60% on 9 October 2026. Fund managers are a net 48% underweight bonds, and The Economist has just put a bond crisis on its cover, asking whether bonds will “blow up.” For anyone weighing a bond market contrarian rally, the question is simple: is fear this widespread already priced in?
The timing matters. Intraday reporting suggested the 10-year yield touched a 24-year high this week, though that reading has not been independently confirmed. At the same time, AI-related borrowing is pulling in capital on a scale that now rivals Treasury issuance.
That leaves you with a decision. Extreme pessimism can be read as a warning that conditions will worsen, or as a sign that sellers have run out of road.
This piece gives you three things. You get a way to judge sentiment signals, an explanation of why long-end yields face supply pressure, and a clear look at how one trader expresses the bullish view with limited risk. This is analysis, not advice, and the thesis is high-conviction and high-risk.
Why a magazine cover can matter to bond investors, and why it often does not
The idea has real appeal. By the time a mainstream magazine puts a market theme on its cover, the theory goes, everyone who wanted to sell has already sold. In the original market discussion behind this piece, the speakers argued that The Economist reaches a topic on its cover only after months of inside-page coverage, when the short-term move has largely played out.
They pointed to a “king dollar” cover that appeared near a dollar top. The “death of equities” era is another favourite example. Both make the cover-as-signal idea feel almost mechanical.
It is not. The historical anecdotes come with substantial leads and lags, and the timing gaps make them hard to trade.
What the evidence says about magazine-cover signals
Empirical tests of strategies based on magazine covers generally find no consistent excess returns once trading costs and timing are included. That should not surprise you. Editors choose cover themes for narrative and subscription value, and they do not time-stamp them as trades. According to the original discussion, The Economist’s own review of its covers found them usually right, but only modestly so.
The cover works better as confirmation than as a catalyst. The survey data carries more weight, and it helps to separate what has been verified from what rests on the speakers’ word:
- Verified data: The 8 October 2026 cover highlighted soaring yields and government debt. The BofA Global Fund Manager Survey (September 2026) found 27% of managers would go overweight bonds only with 30-year yields at 6% or higher.
- Speaker claims: Bond holdings are said to be the lowest since the dot-com era, and futures shorts sit around the 94th percentile of the past 20 years. The speakers also said bond bear Jim Bianco has shifted towards a long-bond view and that Jared Dillian has built long Treasury positions. None of these claims was independently confirmed.
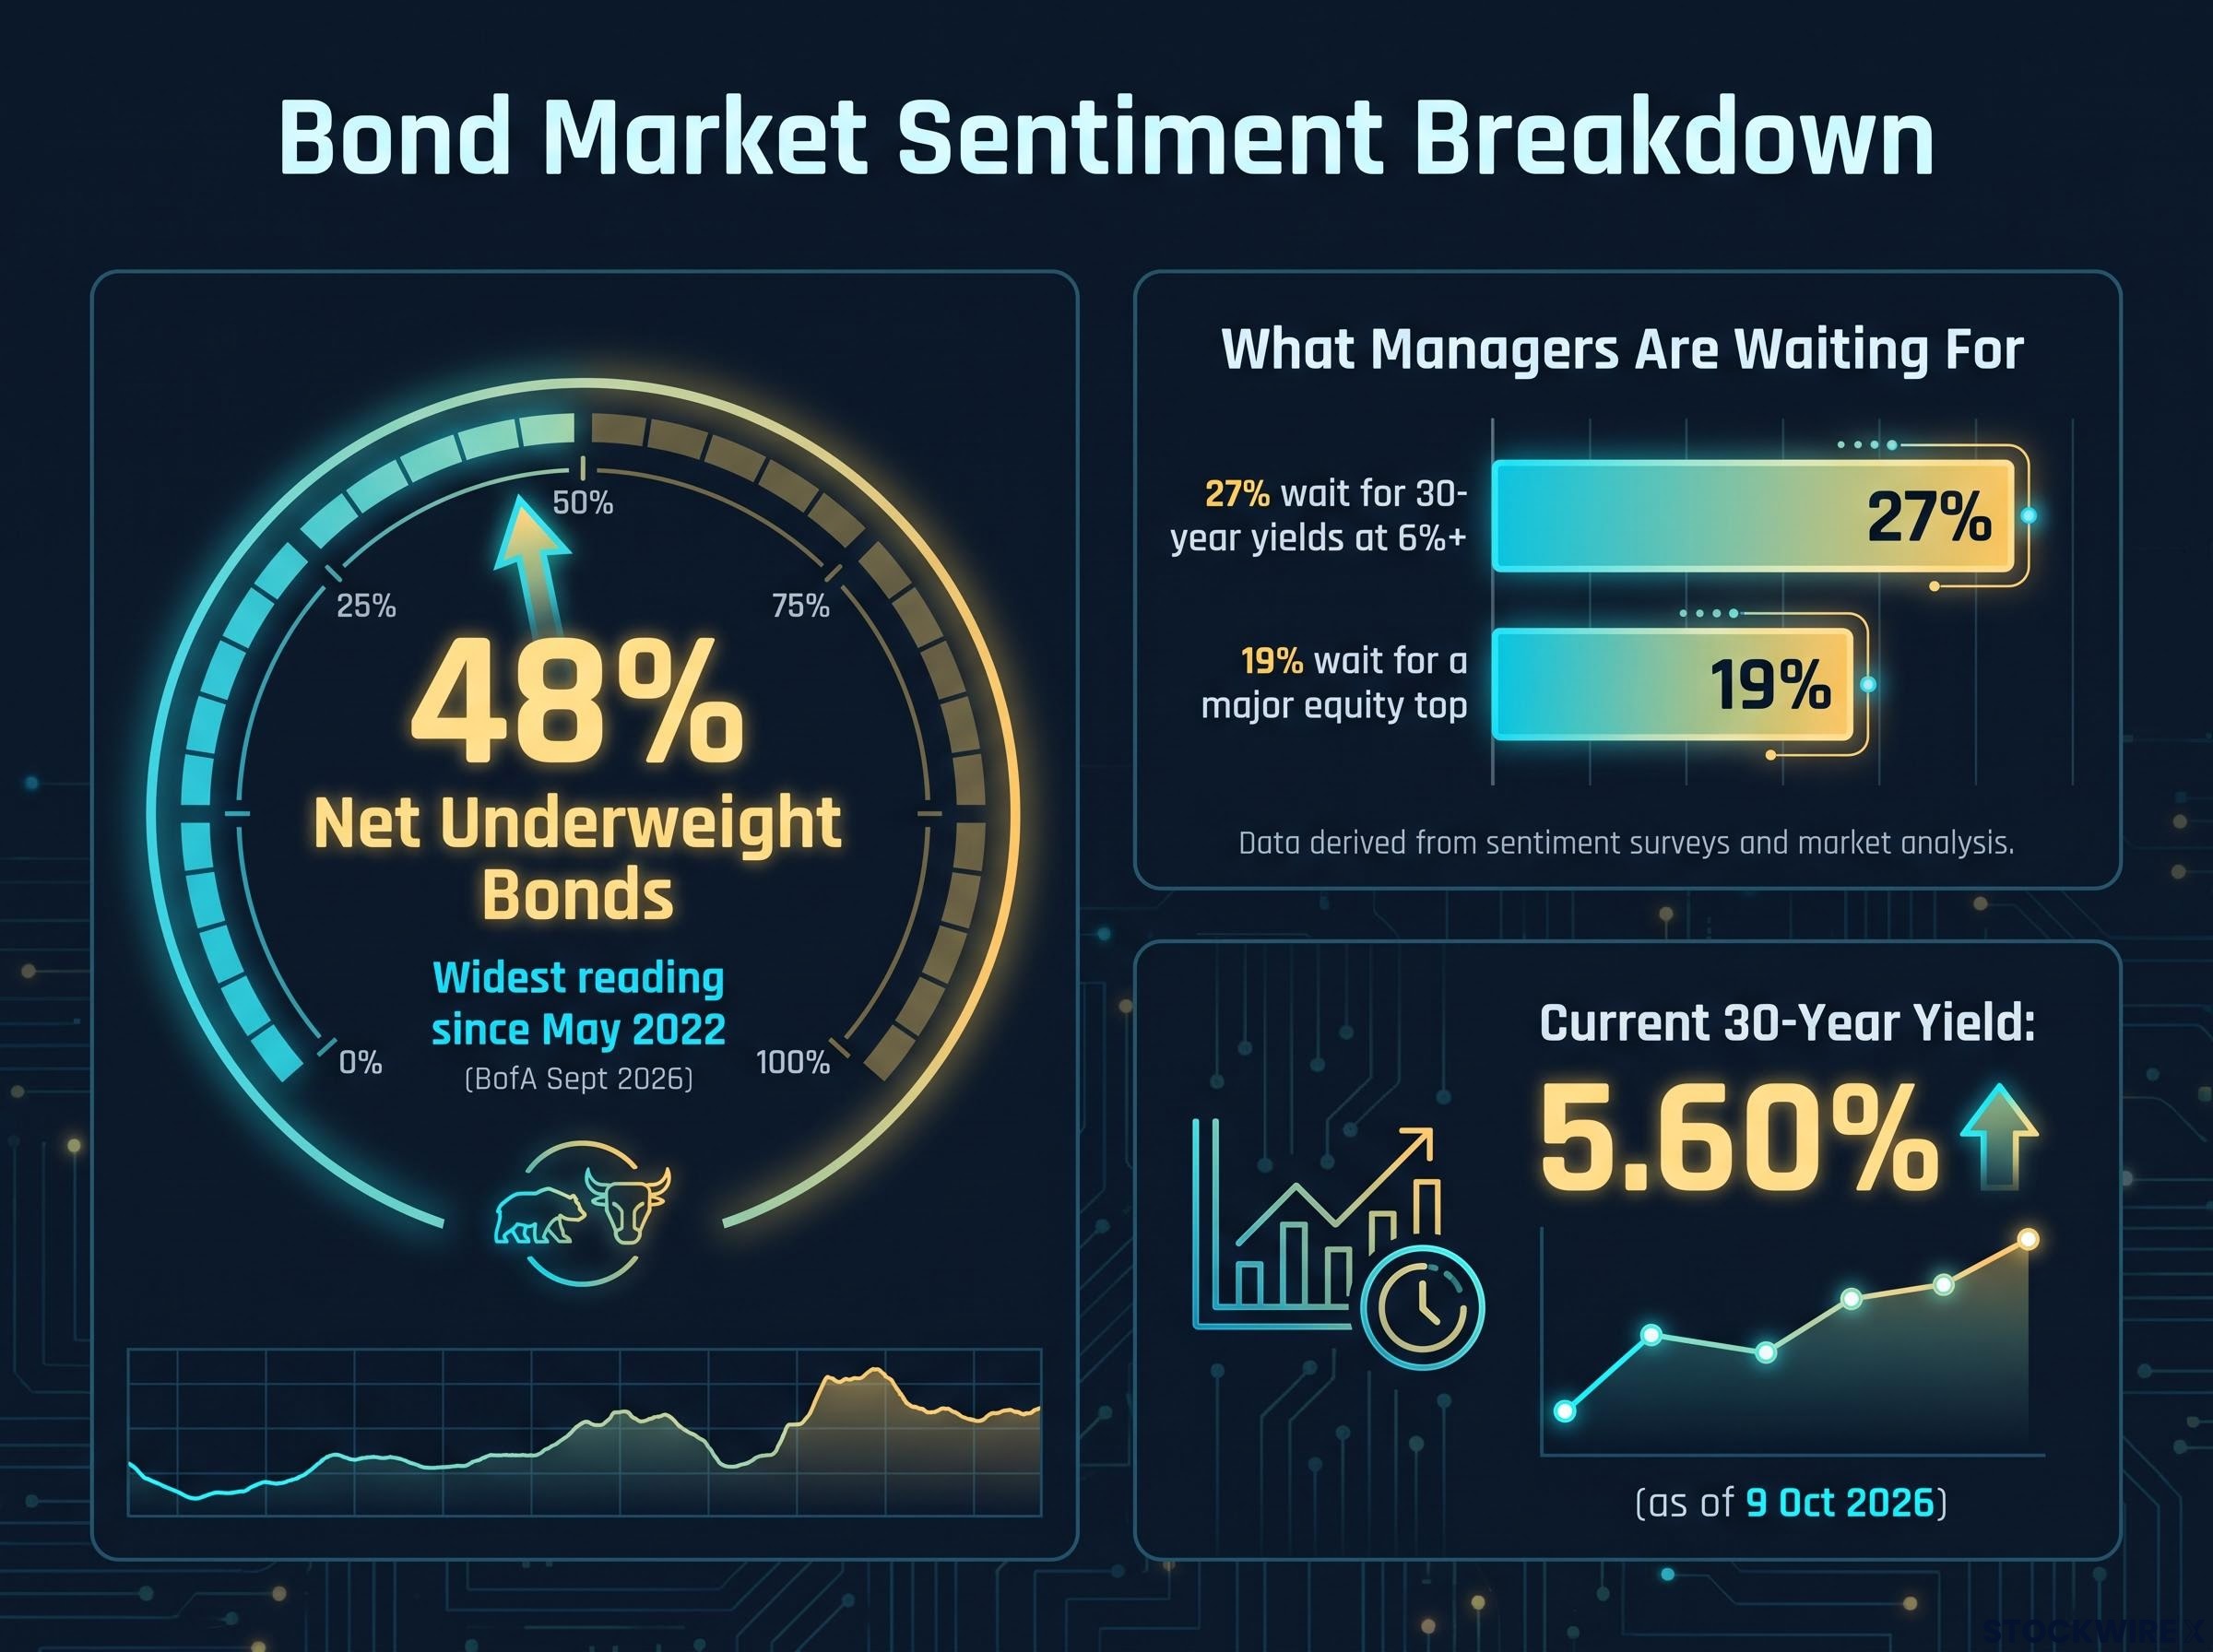
Key statistic: Fund managers were a net 48% underweight bonds in BofA’s September survey, the widest reading since May 2022.
What this tells you is that fear has gone mainstream, which is a precondition for a sentiment reversal. It does not tell you when that reversal arrives, or whether it arrives at all.
The BofA Global Fund Manager Survey for September shows 27% of managers would move overweight government bonds only if 30-year yields reach 6.0% or higher, and 19% want a major equity top first, so patience may be required.
When big ASX news breaks, our subscribers know first
Why AI borrowing and government deficits may be crowding the long end
If sentiment explains why a rally could happen, supply explains why yields have stayed so high. The speakers rejected oil-driven inflation, which they described as a front-end issue, and pointed instead to competition for loanable funds.
The concept is straightforward. Loanable funds are the finite pool of savings available for borrowing at any given time. Governments and corporations compete to borrow from that pool. When competition gets heavier, the price of borrowing rises, and for bonds that price is the yield.
Deficit-heavy governments are one set of borrowers. AI hyperscalers, the giant technology companies building data centres, have become the other. The scale of their borrowing is what makes the competition concrete.
| Source | Metric | Figure | Period |
|---|---|---|---|
| Goldman Sachs | AI-related debt issued (hyperscalers about 40%) | Nearly $500B | 2026 to early August |
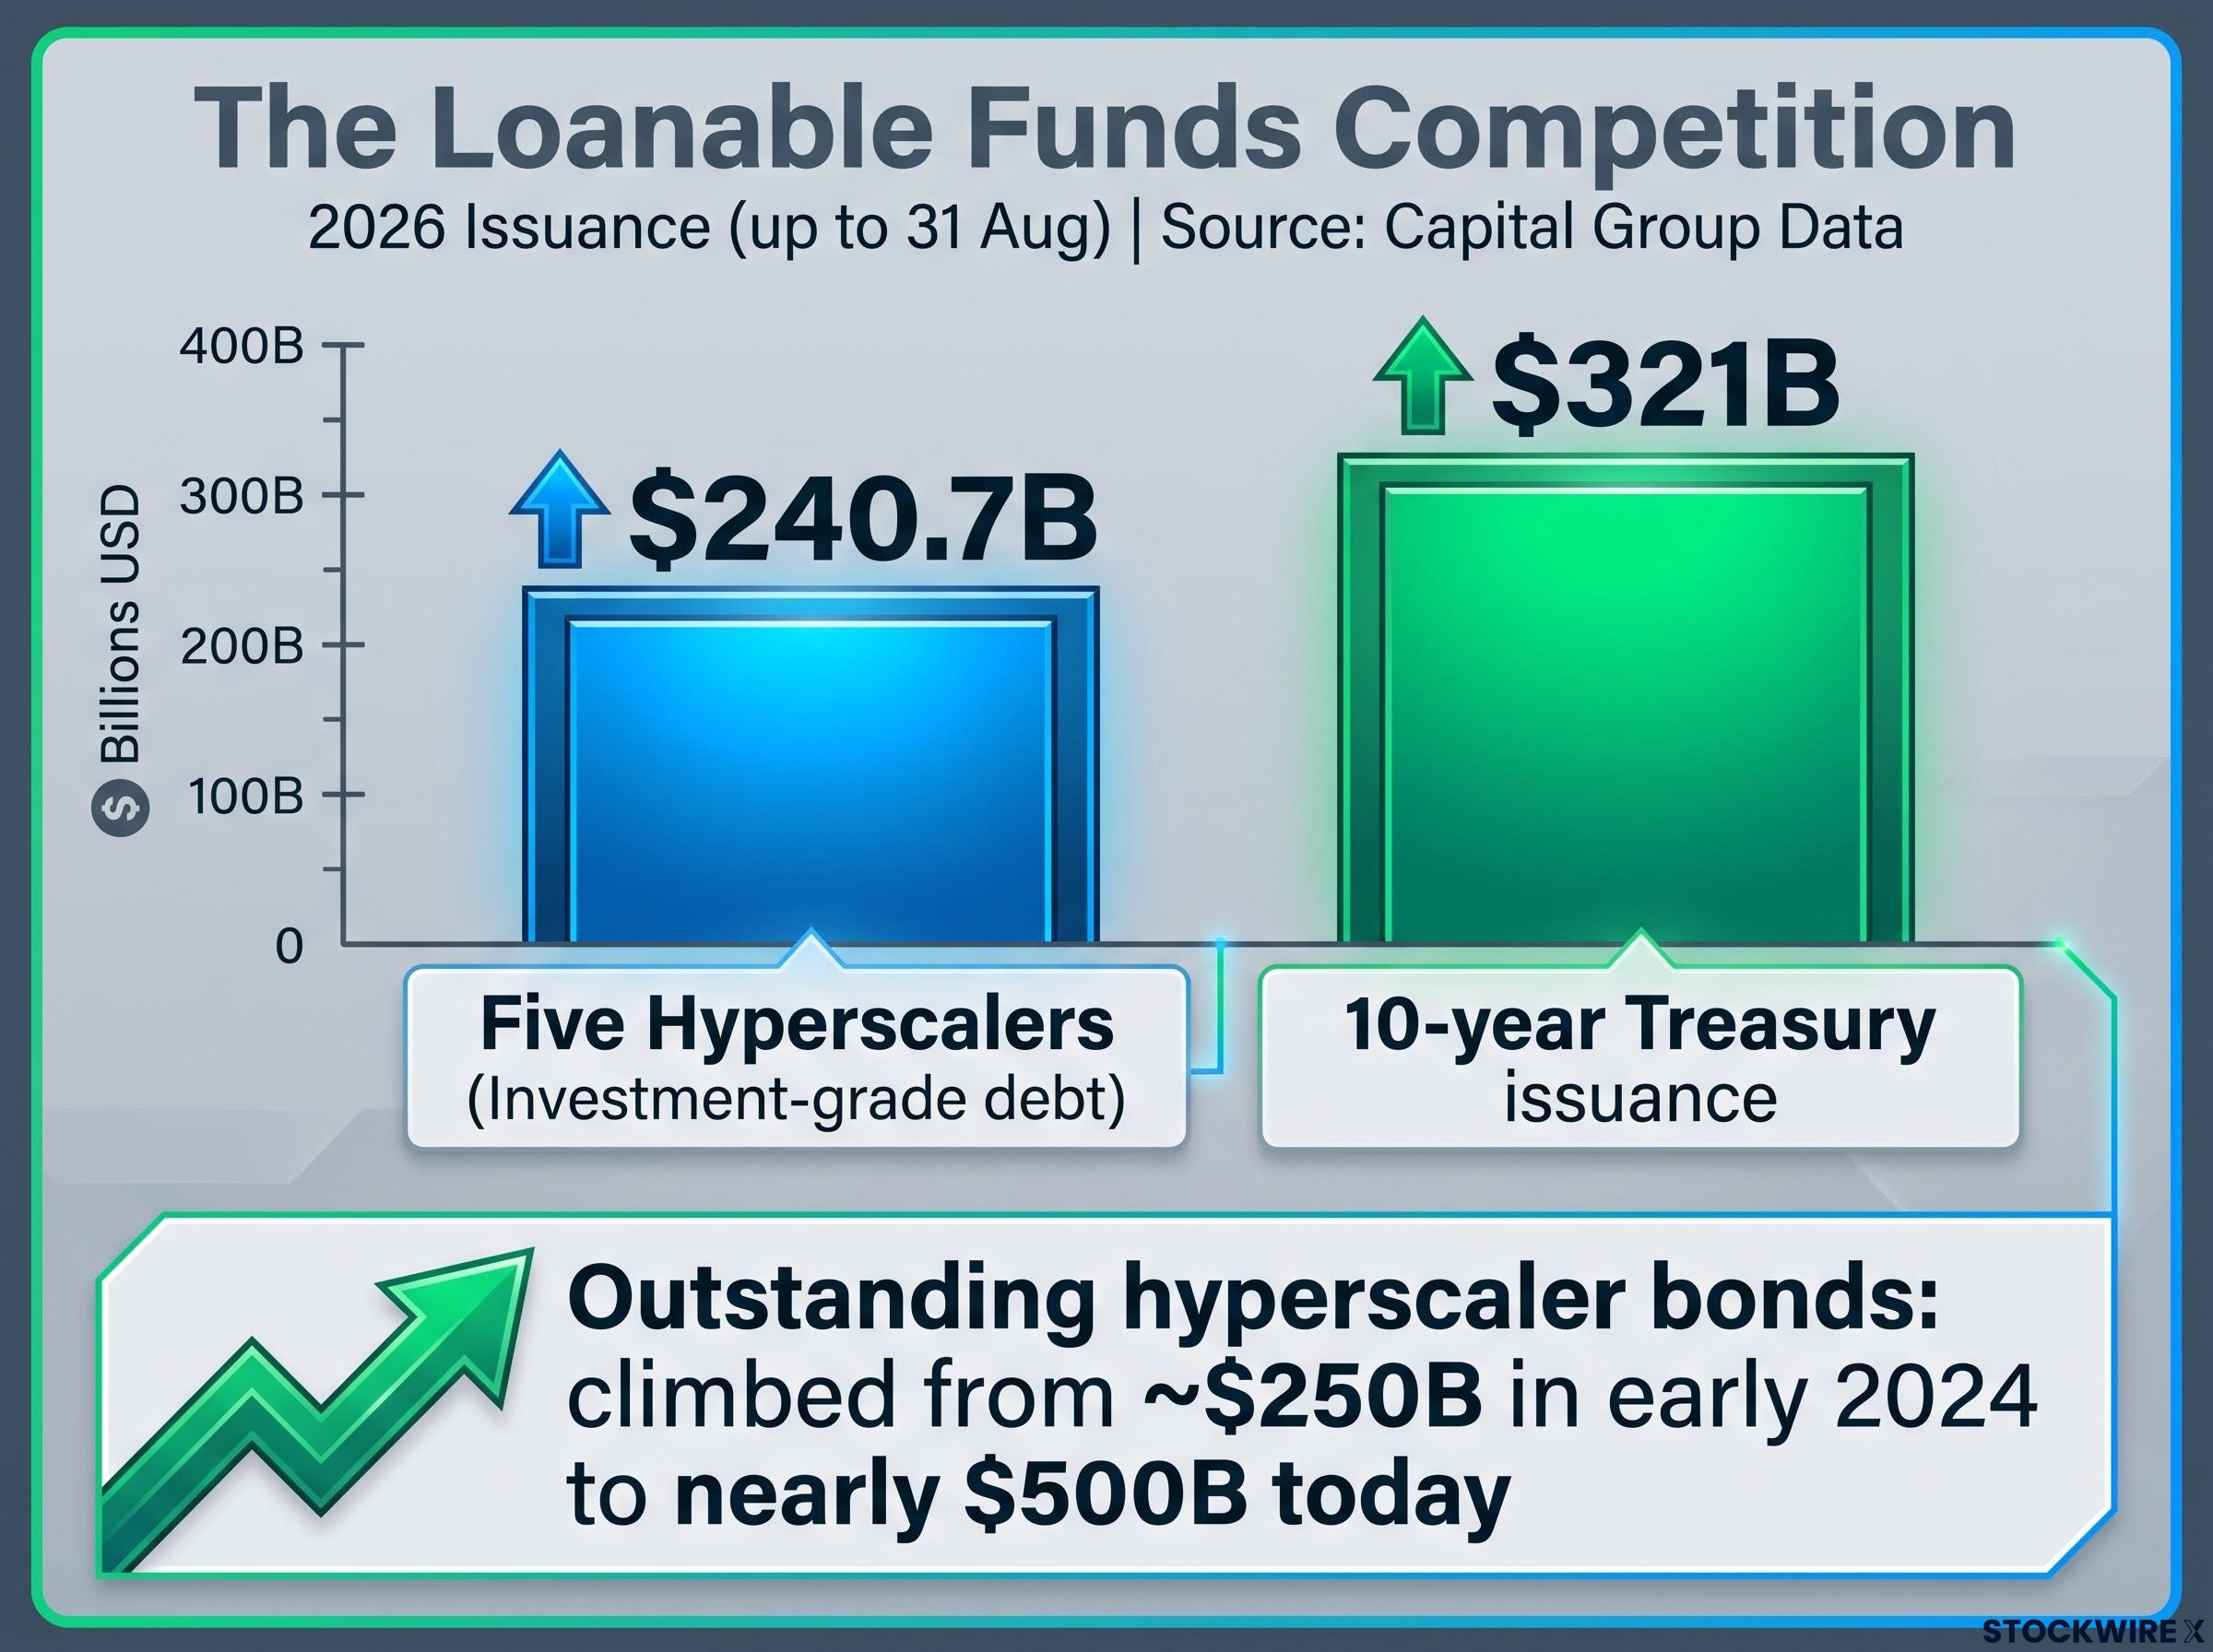
| Capital Group | Investment-grade debt from five hyperscalers | $240.7B | 2026 to 31 August |
| Capital Group | 10-year Treasury issuance | $321B | 2026 to 31 August |
| UBS | Consensus hyperscaler capex | $940B / $1.3T | 2026 / 2027 |
| J.P. Morgan Asset Management | Potential hyperscaler IG bond issuance | About $300B | Next 12 months |
Investment-grade (IG) debt means bonds rated as relatively low-risk by credit agencies. Capital Group also reports that outstanding hyperscaler bonds have climbed from roughly $250 billion in early 2024 to nearly $500 billion. Morgan Stanley forecasts global AI-related issuance near $570 billion for 2026, and Goldman Sachs expects about one-third of AI capital spending to be debt-financed.
The pressure shows up in pricing. UBS reports hyperscaler spreads have widened from 40-75 basis points towards 90 basis points. A spread is the extra yield investors demand over government bonds, and a basis point is one-hundredth of a percentage point.
Hyperscaler supply is already distorting investment-grade credit signals, with Meta’s 2036 bonds pricing like a triple-B credit despite a double-A rating, a sign that spread pressure reflects supply rather than default risk.
Where the simple crowding story falls short
Analysts raise three objections to a pure loanable-funds explanation:
- Macro matters more than supply. Long yields mainly reflect expected short-term interest rates and inflation. Supply shapes spreads and the term premium (the extra yield for locking money up longer) but does not mechanically set yield levels.
- Higher yields attract buyers. As yields rise, pensions, insurers and households tend to buy more, partly offsetting new supply.
- The buyer pools differ. Credit investors may want AI corporate bonds for spread and upside, while duration buyers such as pensions keep preferring Treasuries.
Even with those limits, if you hold or are considering long-duration Treasuries, a supply headwind exists that sentiment alone cannot remove. The contrarian thesis needs a catalyst, not just pessimism.
How a defined-risk call vertical expresses the view
One of the speakers chose a specific structure to act on the view. He placed an at-the-money call vertical on TLT, an exchange-traded fund holding long-dated Treasuries, with the vertical extending to a $100 strike. He said he added to existing positions after seeing the cover and put the reward-to-risk at about 10 to 1. This is his approach, not a recommendation, and current TLT price levels were not available for this analysis.
A call vertical has two legs. You buy a call option at the current price (at-the-money) and sell a call at a higher strike price. Your maximum loss is the net premium you paid, and your maximum gain is the gap between the two strikes minus that premium.
| Feature | Advantage | Pitfall |
|---|---|---|
| Capped loss | Downside limited to premium paid | The full premium can still be lost |
| Leverage | Exposure to duration moves without full capital | Gains capped at the short strike |
| Event exposure | Can profit from a short-covering rally | Rally must arrive before expiry |
The structure suits a thesis where a sharp move is expected but timing is uncertain. The weaknesses deserve the same attention:
- Time decay: options lose value daily if the rally is late.
- Path dependency: a slow, modest yield decline may never reach the short strike.
- Falling implied volatility: as sentiment calms, option prices can shrink and offset gains.
- Costs: ZB futures options (on 30-year Treasury bond futures) can have wider bid-ask spreads, and two legs mean double transaction costs.
The trade-off cuts both ways. Defined risk means a mistimed call costs you only the premium, but it also means being right too late still loses money.
What would have to happen for the rally to arrive, and what could stop it
History offers encouragement. Extreme bearish bond positioning preceded strong rallies after the 1994 rate shock, the 2013 taper tantrum, and risk-off phases in 2018 and 2020.
Then came 2022.
The counter-example: During the 2022 inflation surge, heavy short positioning did not produce an immediate rally. Yields kept rising.
That episode frames four risks to the contrarian case:
- Persistent term premium and supply: heavy AI and sovereign borrowing could keep long yields elevated.
- Inflation and fiscal worries: without clear disinflation or deficit reduction, investors may keep demanding high yields.
- Policy and macro uncertainty: a restrictive Federal Reserve or an AI-driven growth surprise could hold real yields high.
- Managers want better terms first: BofA found 27% want 30-year yields of 6% or more, and 19% want a major equity top, before adding bonds.
Institutional commentary from Capital Group, UBS, J.P. Morgan and Goldman Sachs is cautious rather than bullish, focused on supply and leverage. The bear view holds that fiscal, demographic and AI-capex pressure could keep yields high for years.
Treasury buyback operations have tripled in scale since August, yet long-end yields rose after the expanded programme was announced, and the scheme is scheduled to expire on 4 November 2026.
Plausible catalysts that could shift the picture include:
- Slowing economic growth
- A break in equity markets
- A policy pivot by the Fed
- Moderating inflation expectations
Because many managers say they would buy only at higher yields, today’s 5.60% on the 30-year and 5.24% on the 10-year may not be the turning point. Size any position as though yields could rise further first. Sentiment is necessary, but the catalyst is the missing piece.
Weighing sentiment against supply before making a call
The contrarian case has real support: yields near multi-decade highs, a net 48% underweight among fund managers, and a fear-laden cover. Against it sit heavy AI and sovereign supply and no clear catalyst yet.
The useful step now is deciding which signal would change your view. Equity weakness, 30-year yields approaching 6%, a Fed policy shift, or a slowdown in hyperscaler issuance would each tell you something different about whether the turn is near.
Remember that options can lose their full premium. The cover interpretation, positioning claims, and the Bianco, Dillian and trade details are attributed to the original discussion and were not independently verified.
This article is for informational purposes only and should not be considered financial advice. Investors should conduct their own research and consult with financial professionals before making investment decisions. Past performance does not guarantee future results. Forecasts and forward-looking statements are speculative and subject to change based on market developments.