Most Americans check the Dow when they want to know how the economy is doing. The index they are checking was designed in 1896 to track cotton, tobacco, and railroad companies.
The Dow Jones Industrial Average remains the most widely cited stock index in American financial media. Yet its architecture and composition have drifted so far from its original purpose that its name is now something of a historical artefact. Understanding what it actually measures today, and what it does not, matters for anyone who uses it as a decision-making input.
This article traces the Dow from its 12-company industrial origins to its current 30-stock blue-chip form, explains the price-weighting mechanics that shape its behaviour, and provides a clear framework for interpreting what Dow movements do and do not reveal about the U.S. economy.
From cotton and railroads: how the Dow was built in 1896
The original Dow Jones Industrial Average launched in 1896 with just 12 companies. Every one of them made or moved physical goods. The industries represented tell the story of what the American economy looked like at the turn of the 20th century:
- Cotton
- Railroads
- Natural gas
- Sugar refining
- Tobacco
- Oil
- Electrical equipment
- Rubber
- Lead smelting
Charles Dow, co-founder of Dow Jones & Company, designed the index as an editorial tool. The intent was practical: give readers of The Wall Street Journal a single, readable number that captured the condition of industrial America on any given day.
In that era, the design worked. Industrial output accounted for a dominant share of American economic activity. When the companies on the Dow did well, the broader economy was almost certainly doing well too. Factory production, railroad freight, and commodity processing were not just sectors; they were the economy.
That alignment between the Dow’s composition and the economy’s structure is what earned the index its reputation as a barometer. Whether that alignment still holds 130 years later is the question the rest of this article addresses.
When big ASX news breaks, our subscribers know first
What the Dow actually is: price-weighting and what makes it unusual
Most readers assume the Dow works the way other major indices do: weighting companies by their total size so that the largest firms exert the most influence. The Dow does something different.
The Dow Jones Industrial Average is price-weighted. A stock’s share price, not its total market capitalisation, determines how much it moves the index. A company trading at $500 per share exerts ten times the influence on the Dow as a company trading at $50 per share, regardless of which firm is larger by total market value.
Consider a simplified example. Two companies sit in the index. Company A has a share price of $500 and a market capitalisation of $200 billion. Company B has a share price of $50 but a market capitalisation of $1 trillion. Under price-weighting, Company A dominates the Dow’s movement. Under market-cap weighting, Company B would.
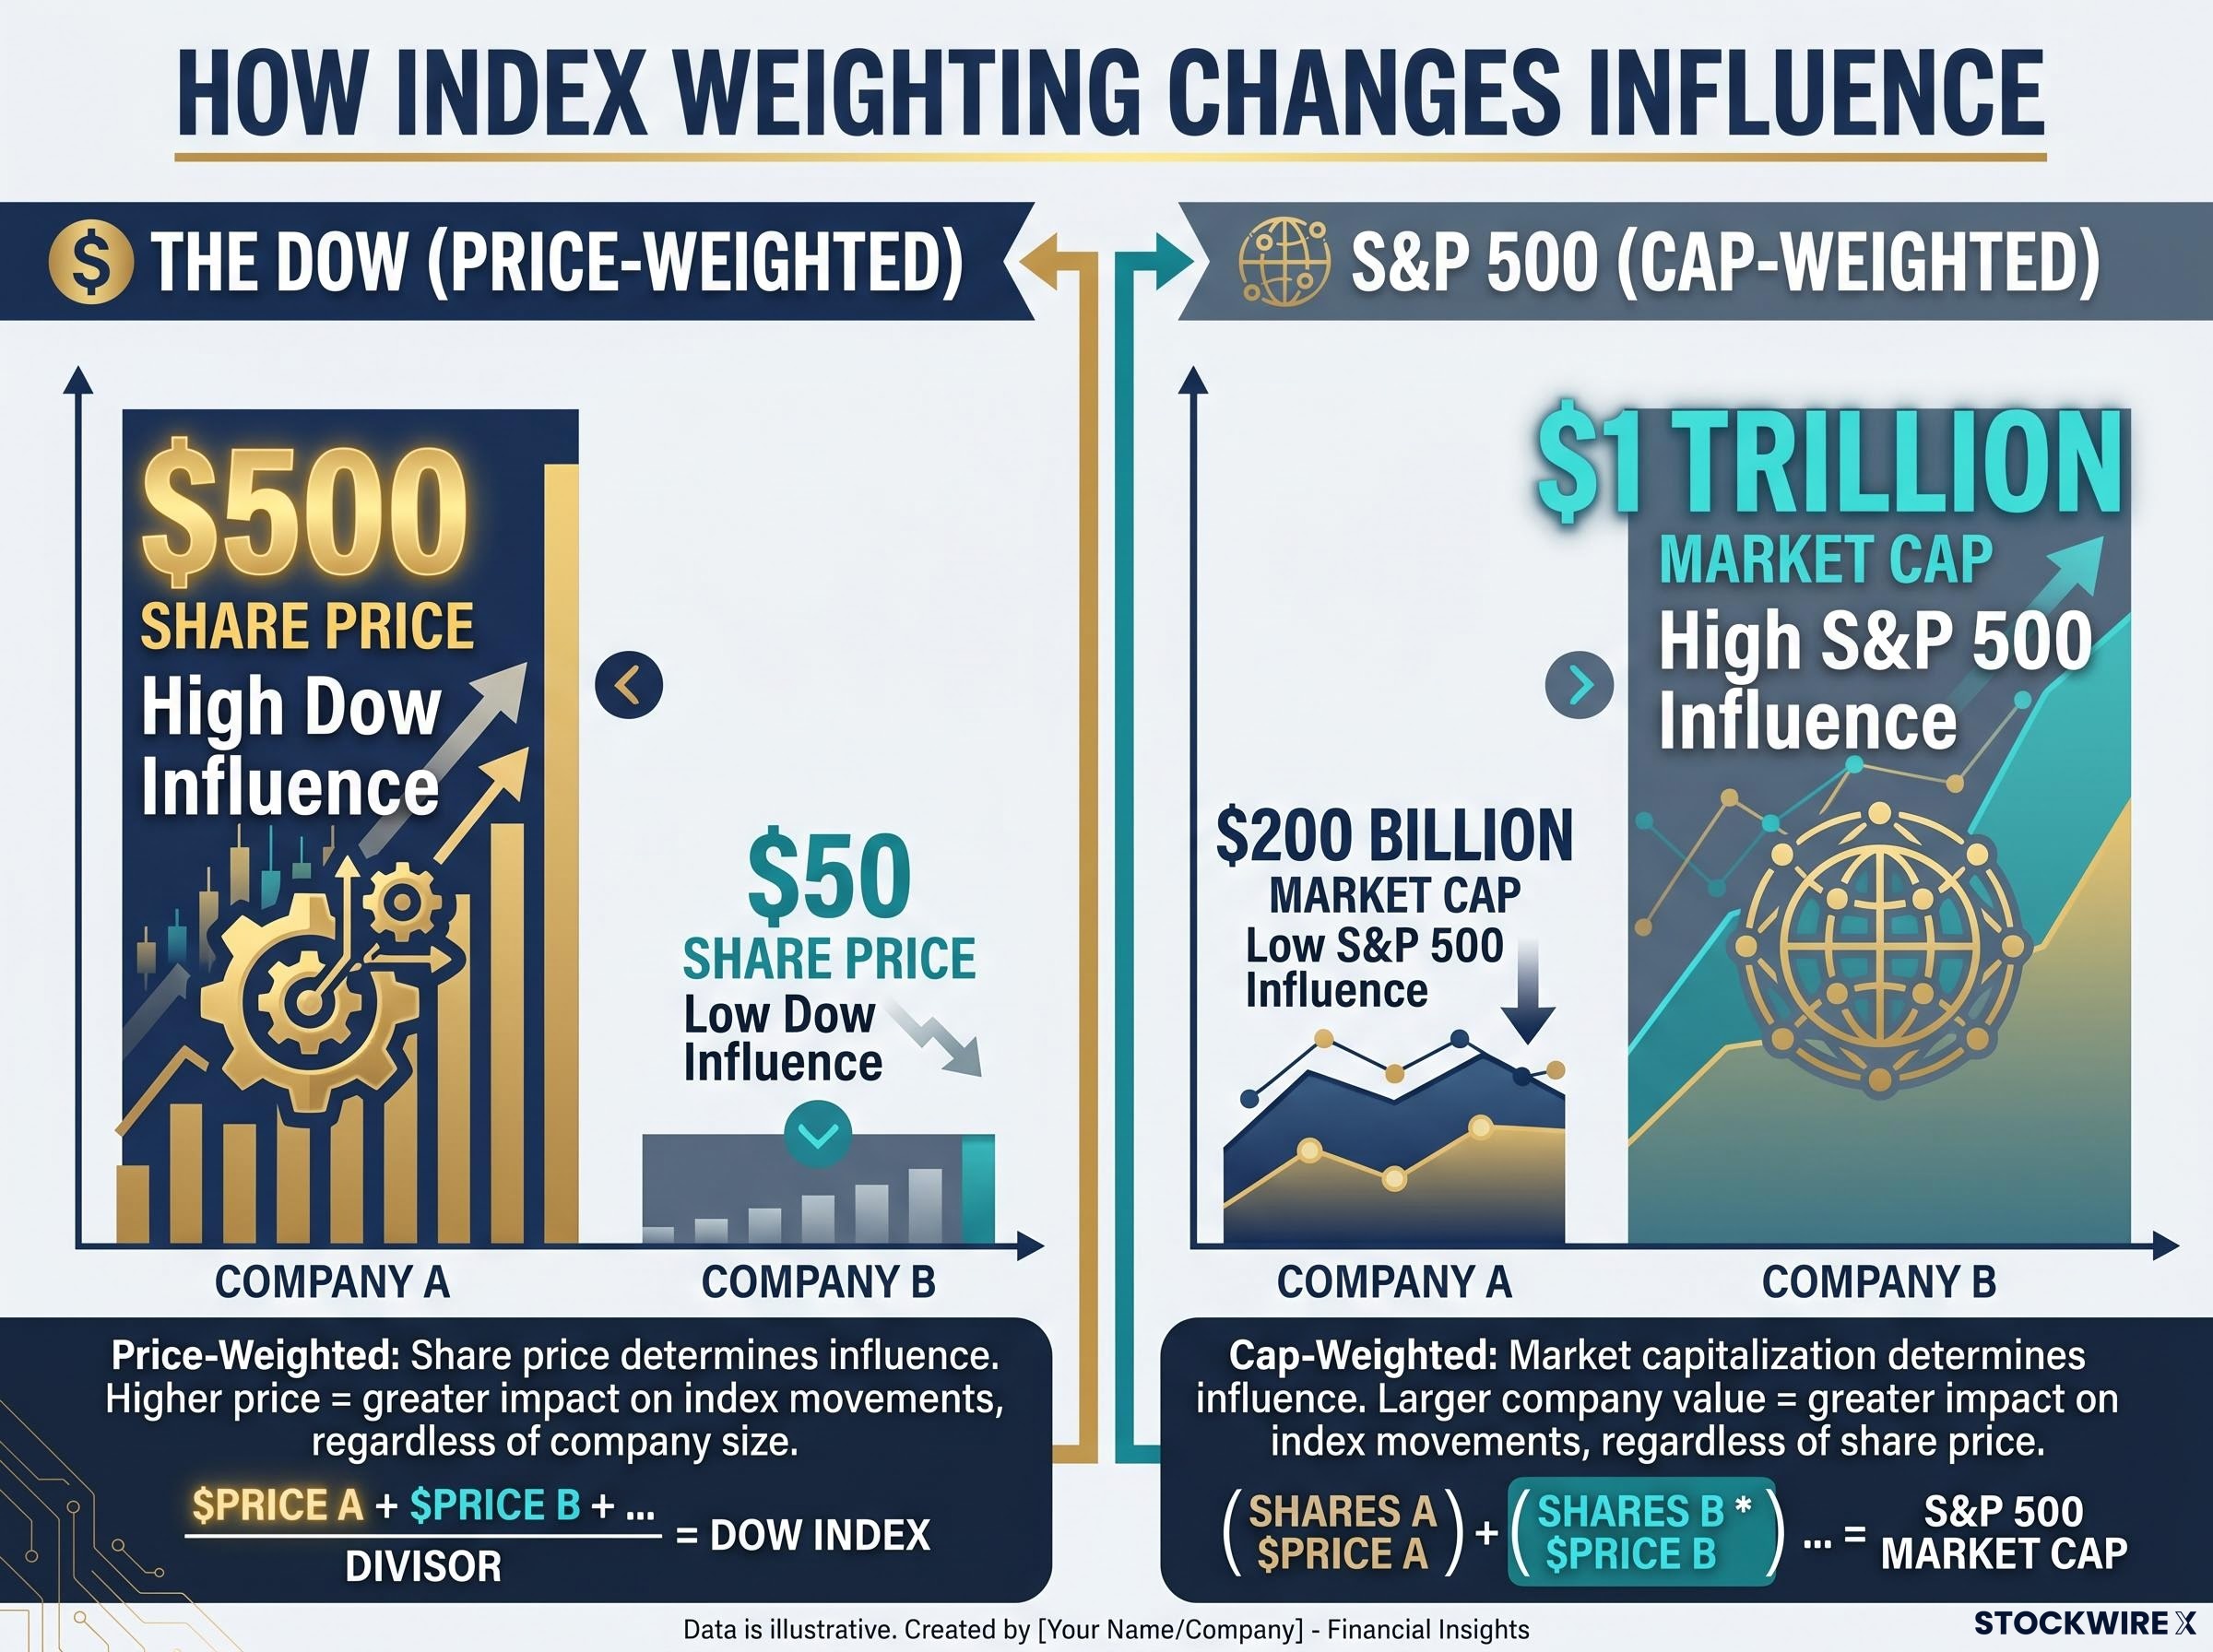
| Company | Share Price | Market Cap | Dow Influence (Price-Weighted) | S&P 500 Influence (Cap-Weighted) |
|---|---|---|---|---|
| Company A | $500 | $200B | High | Low |
| Company B | $50 | $1T | Low | High |
The S&P 500, by contrast, is market-cap-weighted. It tracks approximately 500 companies and aligns each company’s influence with its total corporate value. This means the S&P 500 more closely reflects aggregate economic weight.
Cap-weighted index mechanics create their own distortions in the opposite direction: as large companies grow, passive funds tracking the index are structurally required to buy more of those same stocks, compounding concentration rather than correcting it, which is one reason both price-weighted and cap-weighted indices can diverge from the economic breadth they are assumed to capture.
The core distinction: In the Dow, share price determines influence. In the S&P 500, total market value does. This single structural difference shapes how each index responds to the same market events.
Price-weighting is the single most important fact about the Dow’s architecture. Once a reader understands it, the reason a strong day for one high-priced stock can move the Dow significantly, without reflecting a broad economic shift, becomes clear.
Thirty stocks, shifting sectors: how the Dow’s composition has changed
The Dow started with 12 pure industrial companies. Today it holds 30 stocks spanning industrials, financials, information technology, health care, consumer discretionary, consumer staples, energy, materials, and communication services. The index explicitly excludes transportation and utilities companies, which are tracked in separate Dow Jones indices.
That broadening did not happen all at once. Over more than a century, the committee responsible for the Dow’s composition has periodically removed companies whose relevance faded and added firms that better reflect where American economic activity has migrated. A notable reshuffle on 31 August 2020 added Salesforce, Amgen, and Honeywell while removing Exxon Mobil, Pfizer, and Raytheon Technologies. The removal of Exxon Mobil, a constituent since 1928, signalled a deliberate shift away from legacy energy representation.
Each change reflects a judgement about which companies best represent the current U.S. economy. The growing presence of technology and financial firms in the index tells its own story about where economic activity has migrated since 1896.
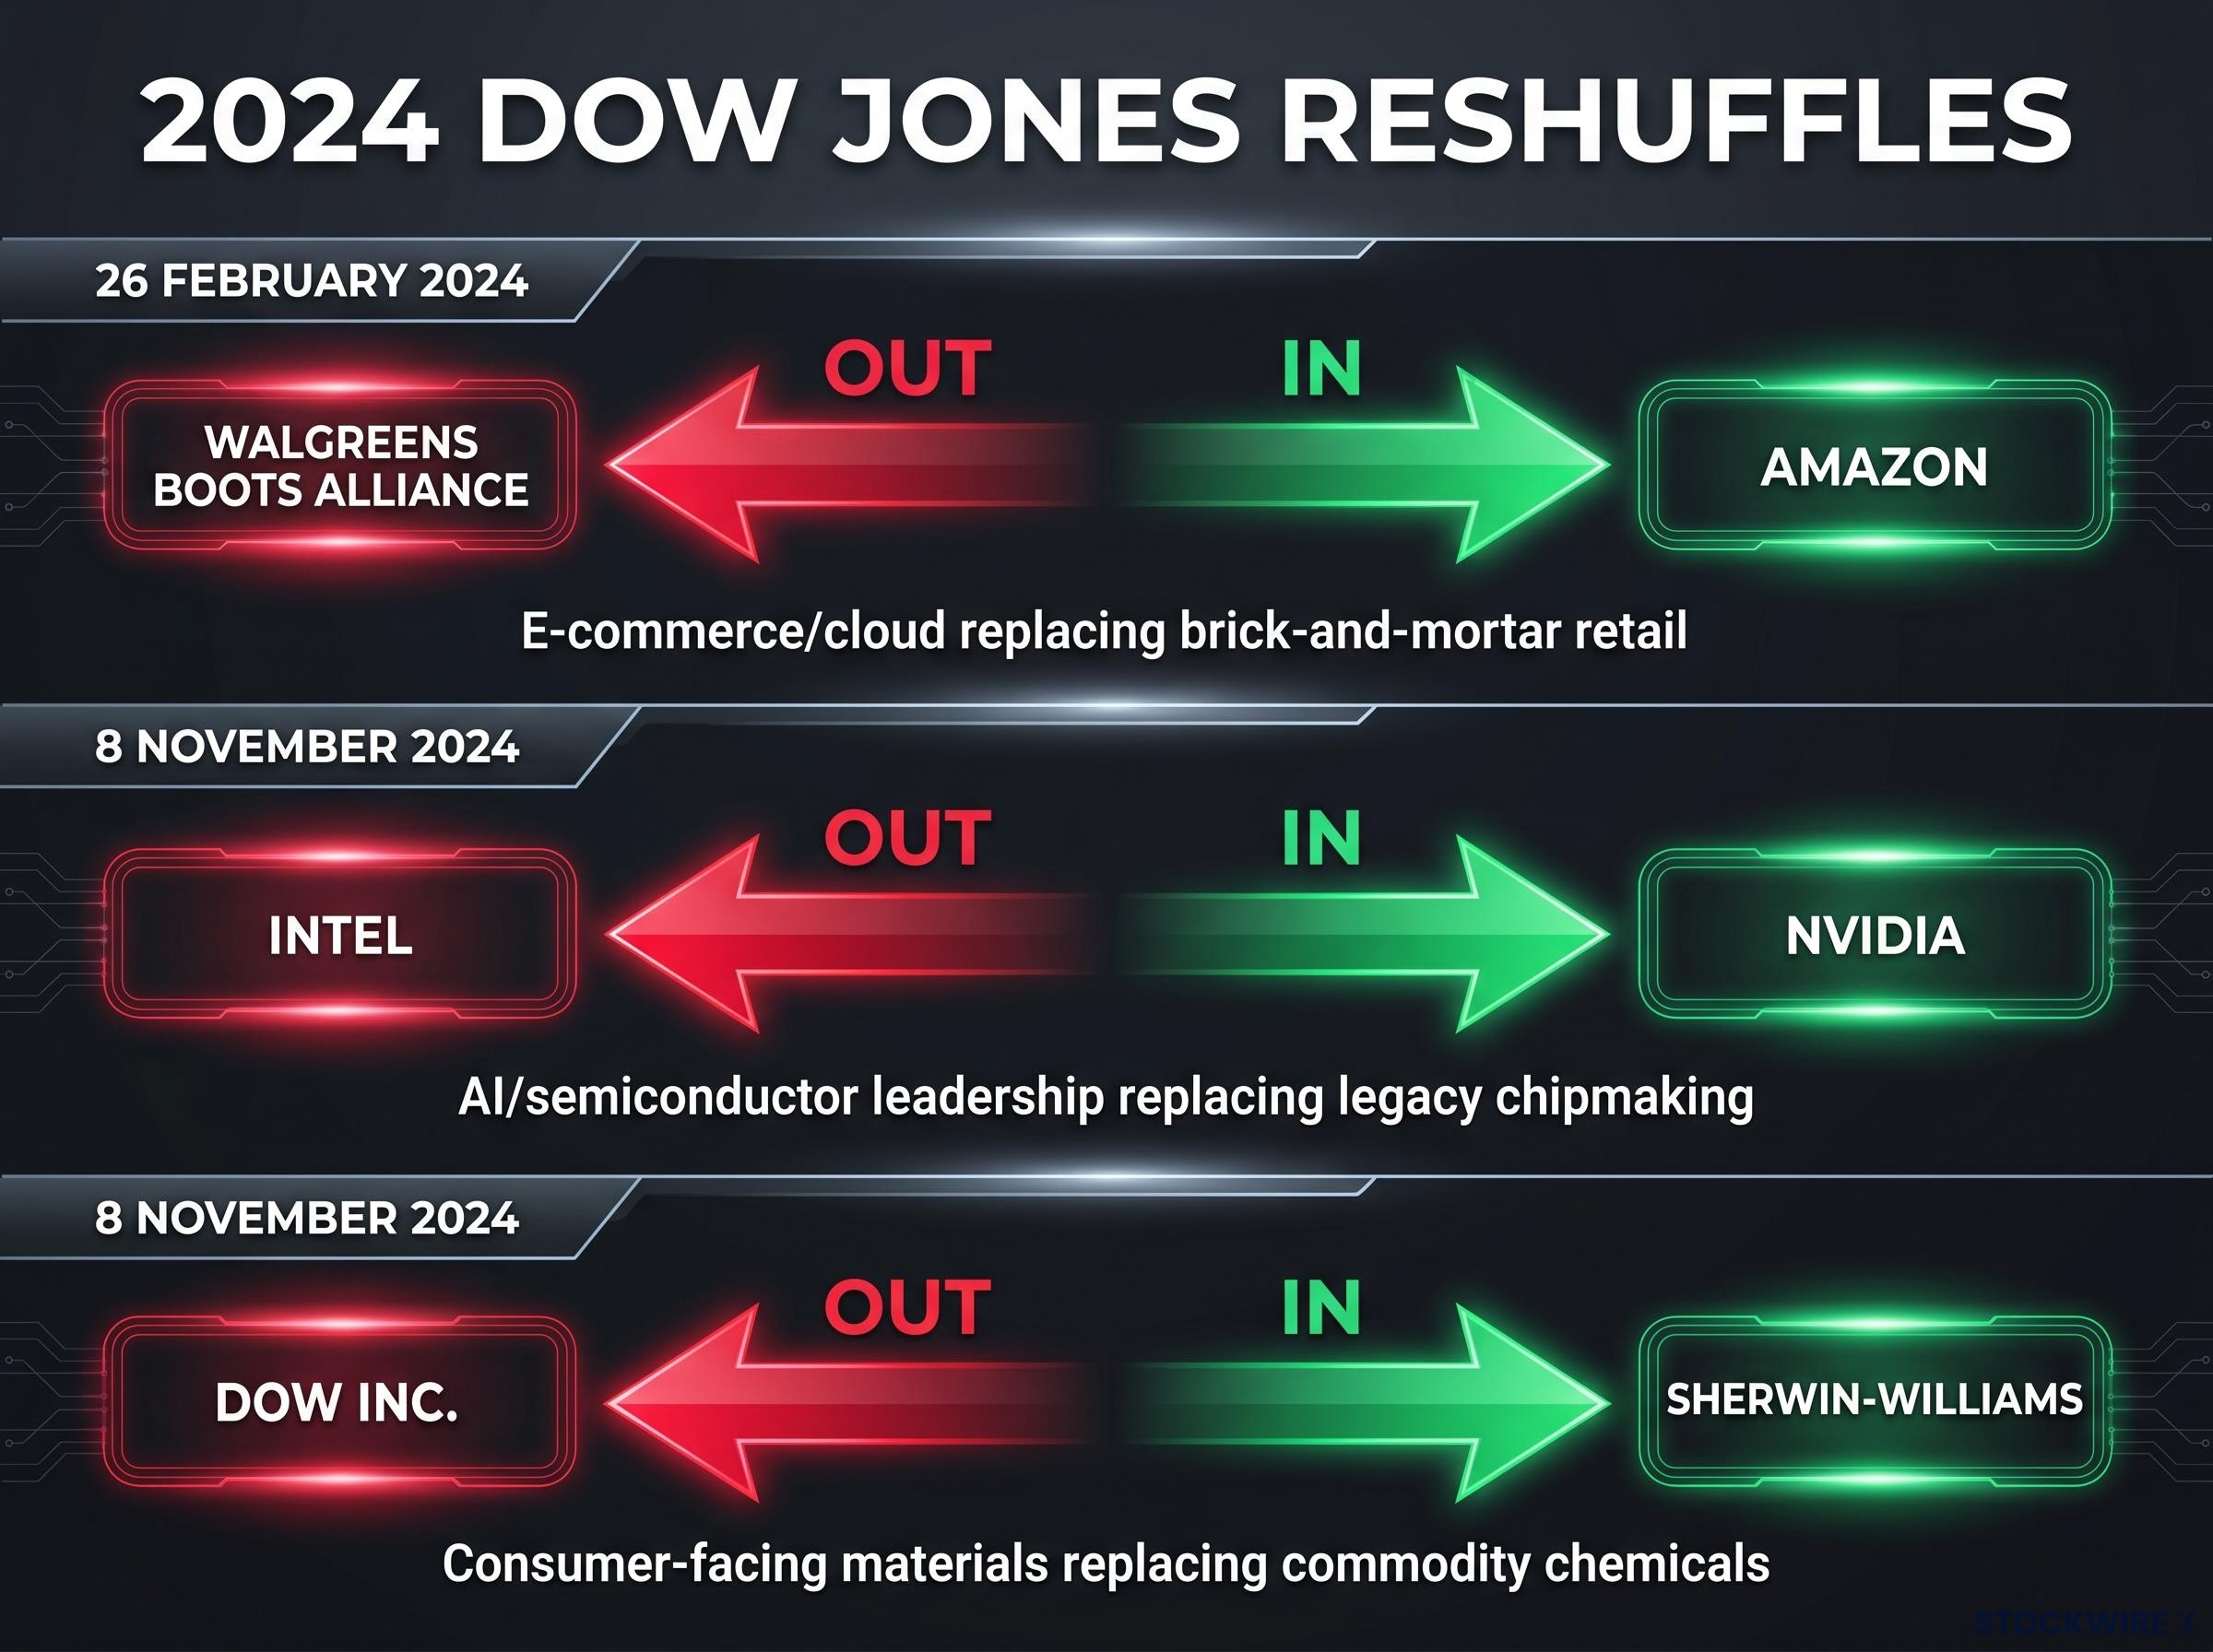
The 2024 reshuffles and what they signal about the modern Dow
Two sets of changes in 2024 reinforced that trajectory.
| Date | Company Removed | Company Added | Sector Implication |
|---|---|---|---|
| 26 February 2024 | Walgreens Boots Alliance | Amazon | E-commerce/cloud replacing brick-and-mortar retail |
| 8 November 2024 | Intel | Nvidia | AI/semiconductor leadership replacing legacy chipmaking |
| 8 November 2024 | Dow Inc. | Sherwin-Williams | Consumer-facing materials replacing commodity chemicals |
Adding Nvidia (semiconductors and artificial intelligence) and Amazon (e-commerce and cloud computing) while removing Intel and Walgreens Boots Alliance represents a deliberate tilt toward digital economy incumbents. No additional constituent changes have been announced through mid-2026.
The industrial sector today: what it employs and produces
The word “industrial” in the Dow’s name may carry less weight inside the index than it once did. The industrial sector itself, however, remains economically substantial.
The industrial goods sector encompasses companies that manufacture capital equipment, machinery, and tools used across construction, manufacturing, and service industries. Its subsectors span a broad range:
- Construction equipment
- Industrial machinery
- Aerospace and defence components
- Electrical equipment
- Transportation equipment
According to the U.S. Bureau of Labor Statistics, the industrial sector composite (manufacturing, mining, construction, and utilities) employed approximately 21.82 million workers as of April 2024, with around 15.54 million in production and non-supervisory roles.
The BLS Employment Situation report for April 2024 recorded total industrial sector employment across manufacturing, mining, construction, and utilities at approximately 21.82 million workers, with 15.54 million in production and non-supervisory roles, underscoring the sector’s continued weight in the American labor market.
The U.S. Census Bureau recorded new capital goods orders totalling $100.42 billion in the most recently identifiable M3 survey reporting period, underscoring the sector’s continuing role in American capital formation.
The industrial sector behaves cyclically. It broadly contracts during recessions as businesses delay expansion, but its subsector diversity means partial expansion can persist even during downturns. One area may contract while another continues growing.
This scale matters for interpreting the Dow. The industrial sector employs tens of millions of Americans and anchors capital spending across the economy. Its partial absence from the Dow’s current composition is precisely what makes the index’s role as an economic proxy more complicated than its name suggests.
Why the Dow is no longer the best proxy for the U.S. economy
Three separate structural weaknesses converge to weaken the Dow’s claim as an economic barometer. Each is significant on its own. Together, they explain why institutional investors and macro analysts have moved on.
- Narrow coverage. The Dow tracks 30 stocks. The S&P 500 tracks approximately 500. An index of 30 companies, however carefully selected, cannot capture the breadth of a $28 trillion economy with tens of thousands of publicly traded firms.
- Price-weighting distortion. As outlined earlier, a single high-priced stock can drive index movements that have nothing to do with broad economic conditions. A 3% gain in one company trading at $500 moves the Dow far more than the same gain in a $50 stock, regardless of which company has a larger economic footprint.
- Compositional drift. The Dow is now heavy with technology and financial firms. That composition reflects where corporate profits concentrate today, but it does not track the full range of sectors, including manufacturing, agriculture, and small business activity, that define economic health for most Americans.
Index concentration risk is not a theoretical concern: when two semiconductor companies controlled over 42% of the KOSPI, a single labour dispute was enough to trigger a 6% single-session collapse across an index nominally tracking hundreds of companies, demonstrating precisely how narrow constituent weighting turns a company-level event into a market-wide signal.
The institutional world has noticed. Market outlooks from Morgan Stanley, J.P. Morgan, and Fidelity in 2024-2025 focused almost exclusively on the S&P 500 when discussing U.S. economic growth, earnings trajectories, and recession risk. The Dow was largely absent from those macro-economy discussions.
Commentary from the Wall Street Journal, Financial Times, Bloomberg, Reuters, and Barron’s consistently characterises the DJIA as a legacy, media-friendly gauge rather than a rigorous economic proxy.
What the Dow still does well
None of this means the Dow is useless. It offers something no other index can: 130 years of continuous history, making it the longest-running equity benchmark in the United States.
That historical continuity has genuine value. It allows long-run comparisons across eras that no other index can match. For non-specialist audiences and financial media, the Dow also serves as a daily shorthand, a single number that conveys whether stocks broadly went up or down. That cultural utility persists even as its analytical precision has eroded.
The Dow’s limitations and its strengths are not contradictory. It can be both a useful cultural reference and a structurally imperfect measure of economic health.
A more informed way to read the Dow in 2026
The practical takeaway is not to stop watching the Dow. It is to upgrade how to interpret it.
Rather than treating a Dow move as a verdict on the economy, readers can use a three-step framework:
- Observe the Dow’s move. Note the direction and magnitude. A 300-point swing sounds dramatic but may reflect the behaviour of a handful of high-priced constituents.
- Check the S&P 500 for confirmation. If both indices moved in the same direction by a similar magnitude, the move is more likely broad-based and economically meaningful. If they diverge significantly, the Dow’s move is likely being driven by a small number of price-weighted stocks rather than a wide shift in market sentiment.
- Consult sector-specific data for targeted signals. The industrial sector alone employs approximately 21.82 million Americans and generates over $100 billion in capital goods orders. Conditions in that sector, and others, require their own data points, not just an index reading.
S&P 500 concentration has reached its own extreme, with five mega-cap stocks controlling roughly 23% of the broad market index and driving over 70% of Q1 2026 losses, which means the S&P 500 used as a Dow confirmation tool carries its own embedded distortions that readers should account for when comparing the two benchmarks.
When the Dow and S&P 500 diverge, the divergence itself is informative. It signals that the price-weighting mechanism is at work, amplifying the movement of a few shares rather than reflecting aggregate market conditions.
This framework does not require abandoning the Dow. It requires pairing it with broader benchmarks and asking, each time it moves, whether the story is about the economy or about a few stocks.
The Dow at 130: a useful relic or a reliable signal?
The Dow Jones Industrial Average earned its reputation as an economic barometer in an era when its 12 constituent companies genuinely mirrored the economy they claimed to represent. Railroads, cotton, oil, and sugar were the economy. That alignment has steadily eroded across 130 years of compositional change, structural evolution, and economic transformation.
The index retains genuine value as a long-run historical record and culturally embedded shorthand. It remains the number most Americans hear first when financial markets make the evening news. That continuity matters.
As the Dow continues to be periodically reshuffled toward the dominant industries of each era, its economic relevance is a moving target. Readers who understand its price-weighted mechanics, its 30-stock limitation, and its compositional drift are equipped to assess its signals on their current merits rather than on the strength of a reputation built in a different century.
Investors who have absorbed the mechanics of price-weighting and index composition and are now considering how to position a portfolio around these benchmarks will find our full explainer on index fund performance, which covers SPIVA data spanning more than 20 years, Warren Buffett’s million-dollar bet against active management, and the compounding arithmetic that explains why cost differentials matter more than fund selection at long horizons.
This article is for informational purposes only and should not be considered financial advice. Investors should conduct their own research and consult with financial professionals before making investment decisions.