Most investors assume they will recognise the danger signal when it arrives. According to one of the world’s most prominent market strategists, the signal may already be present, though it carries a meaning few expect. On 28 May 2026, Ken Fisher of Fisher Investments assessed the current bull market as transitioning from optimism into the early stages of euphoria, the final phase of Sir John Templeton’s four-stage sentiment model. Against a backdrop of record highs across global equity markets, the diagnosis raises a question that matters for every portfolio: what does early-stage bull market euphoria actually imply, and how should investors respond to a phase that history suggests can last for years before it ends?
What follows is an examination of what the euphoria label means within its framework, why it is not a straightforward sell signal, what evidence supports the assessment, and where the gaps in the data demand caution.
The framework that turns market mood into a roadmap
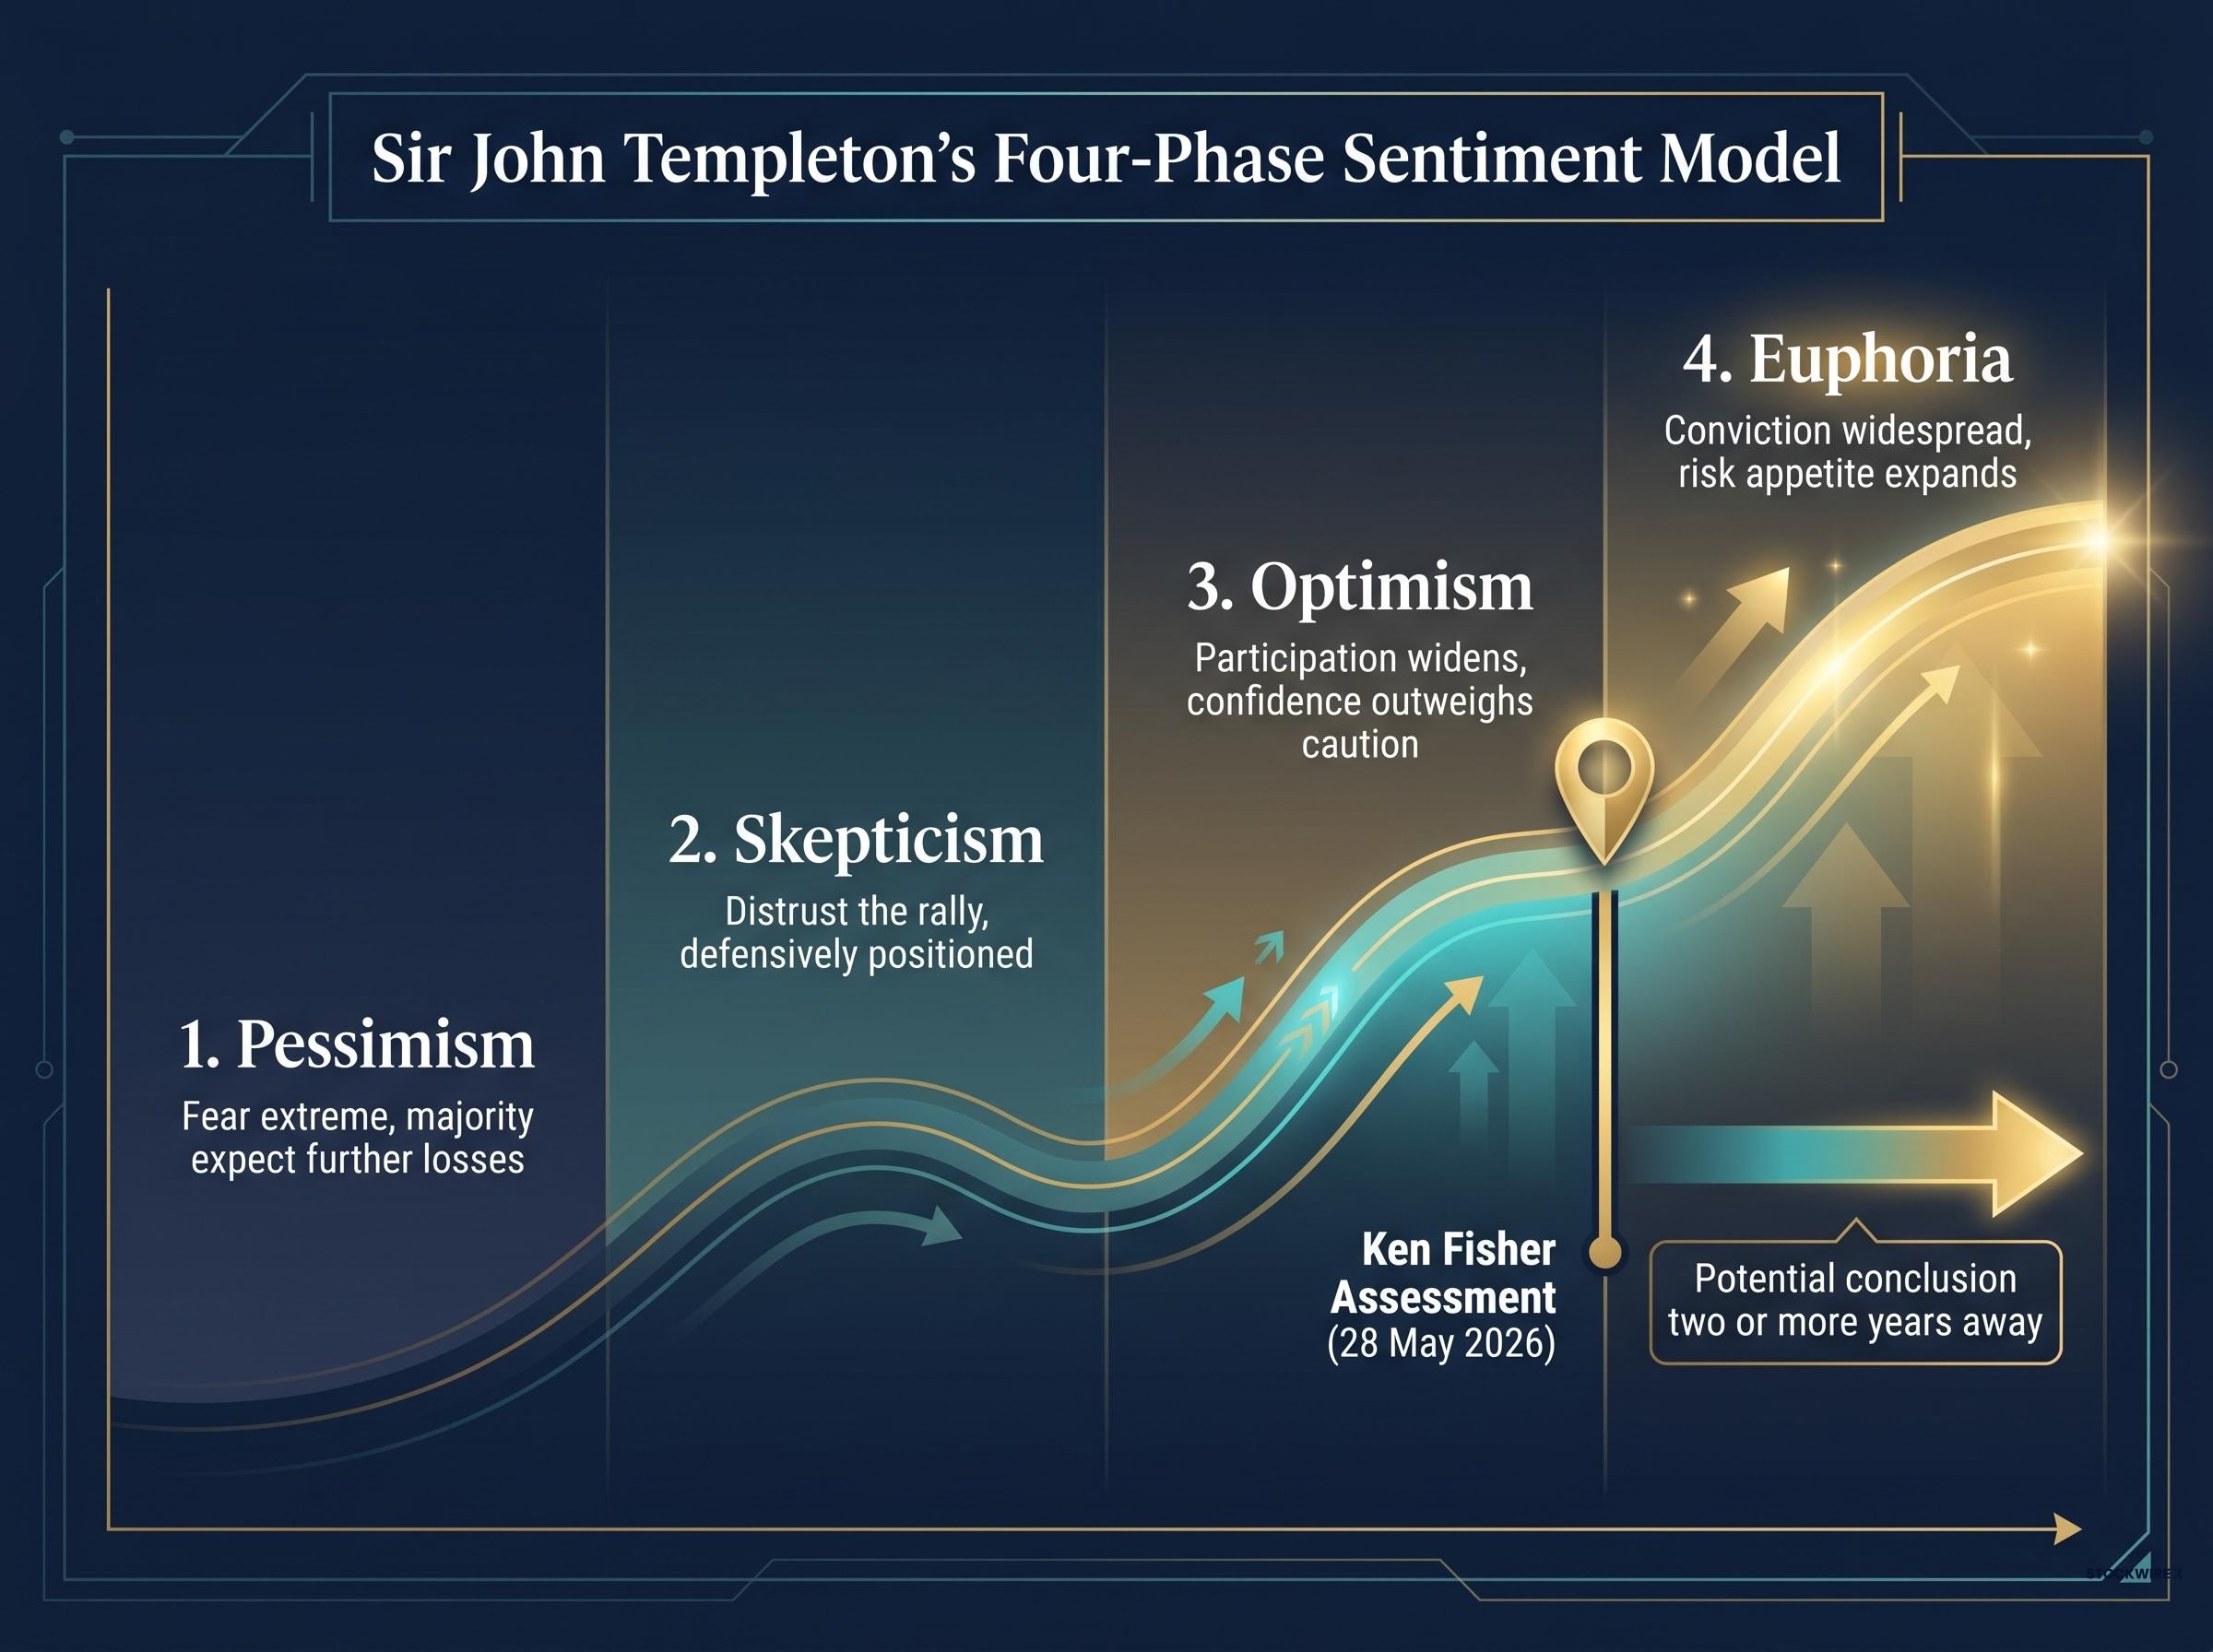
Sir John Templeton’s four-phase model describes the emotional arc of a bull market. It is not a forecasting tool with dates attached. It is a pattern-recognition framework built on the observation that investor sentiment moves through distinct psychological stages, and that the sequence is remarkably consistent across cycles.
The four phases, in order:
- Pessimism: Markets bottom when fear is at its most extreme and the majority of participants expect further losses.
- Skepticism: Prices begin to recover, but most investors distrust the rally and remain defensively positioned.
- Optimism: Gains become broad enough that participation widens, and confidence begins to outweigh caution.
- Euphoria: Conviction becomes widespread, risk appetite expands, and investors begin to treat rising markets as self-evidently permanent.
“Bull markets are born on pessimism, grow on skepticism, mature on optimism, and die on euphoria.” Sir John Templeton
The framework’s durability rests on its description of human behaviour, not market mechanics. Each phase is defined by what the majority of investors believe and how that belief shapes their positioning. Ken Fisher’s May 2026 citation places the current environment at the transition from phase three into the early portion of phase four.
The relationship between sentiment surveys and market direction is less intuitive than most investors assume: decades of Granger-causality research show that stock prices lead sentiment readings rather than the reverse, meaning surveys like the University of Michigan index describe where markets have been, not where they are going.
When big ASX news breaks, our subscribers know first
Why “euphoria” does not mean “exit now”
The word itself carries an urgency that the framework does not support. Euphoria, in common usage, implies a peak, a moment just before the fall. Within Templeton’s model, the final phase is a period, not a point.
Ken Fisher’s assessment, delivered on 28 May 2026, explicitly identifies the market as being in early-stage euphoria, with the bull market’s conclusion potentially two or more years away. That distinction is material. It separates a framework diagnosis from a market-timing call.
Fisher’s estimated timeline places the potential conclusion of the current bull market roughly two or more years from the present assessment, suggesting the euphoria phase may have considerable runway ahead of it.
Phase identification vs. market timing
Sentiment frameworks identify the character of the current environment. They describe where investor psychology sits within a recurring cycle. They do not, and cannot, specify the precise date of reversal.
Acting on a phase label as though it were a countdown clock is a category error. The framework itself does not support it. An investor who sold equities upon hearing the word “euphoria” in May 2026 could be exiting a market that still has years of gains ahead, precisely the kind of premature de-risking that sentiment models are designed to help investors avoid.
Beyond tech: A globally distributed rally
The most persistent counter-narrative to the current bull market is that it depends on a narrow group of technology and artificial intelligence stocks. The geographic and sectoral breadth of the rally undercuts that argument directly.
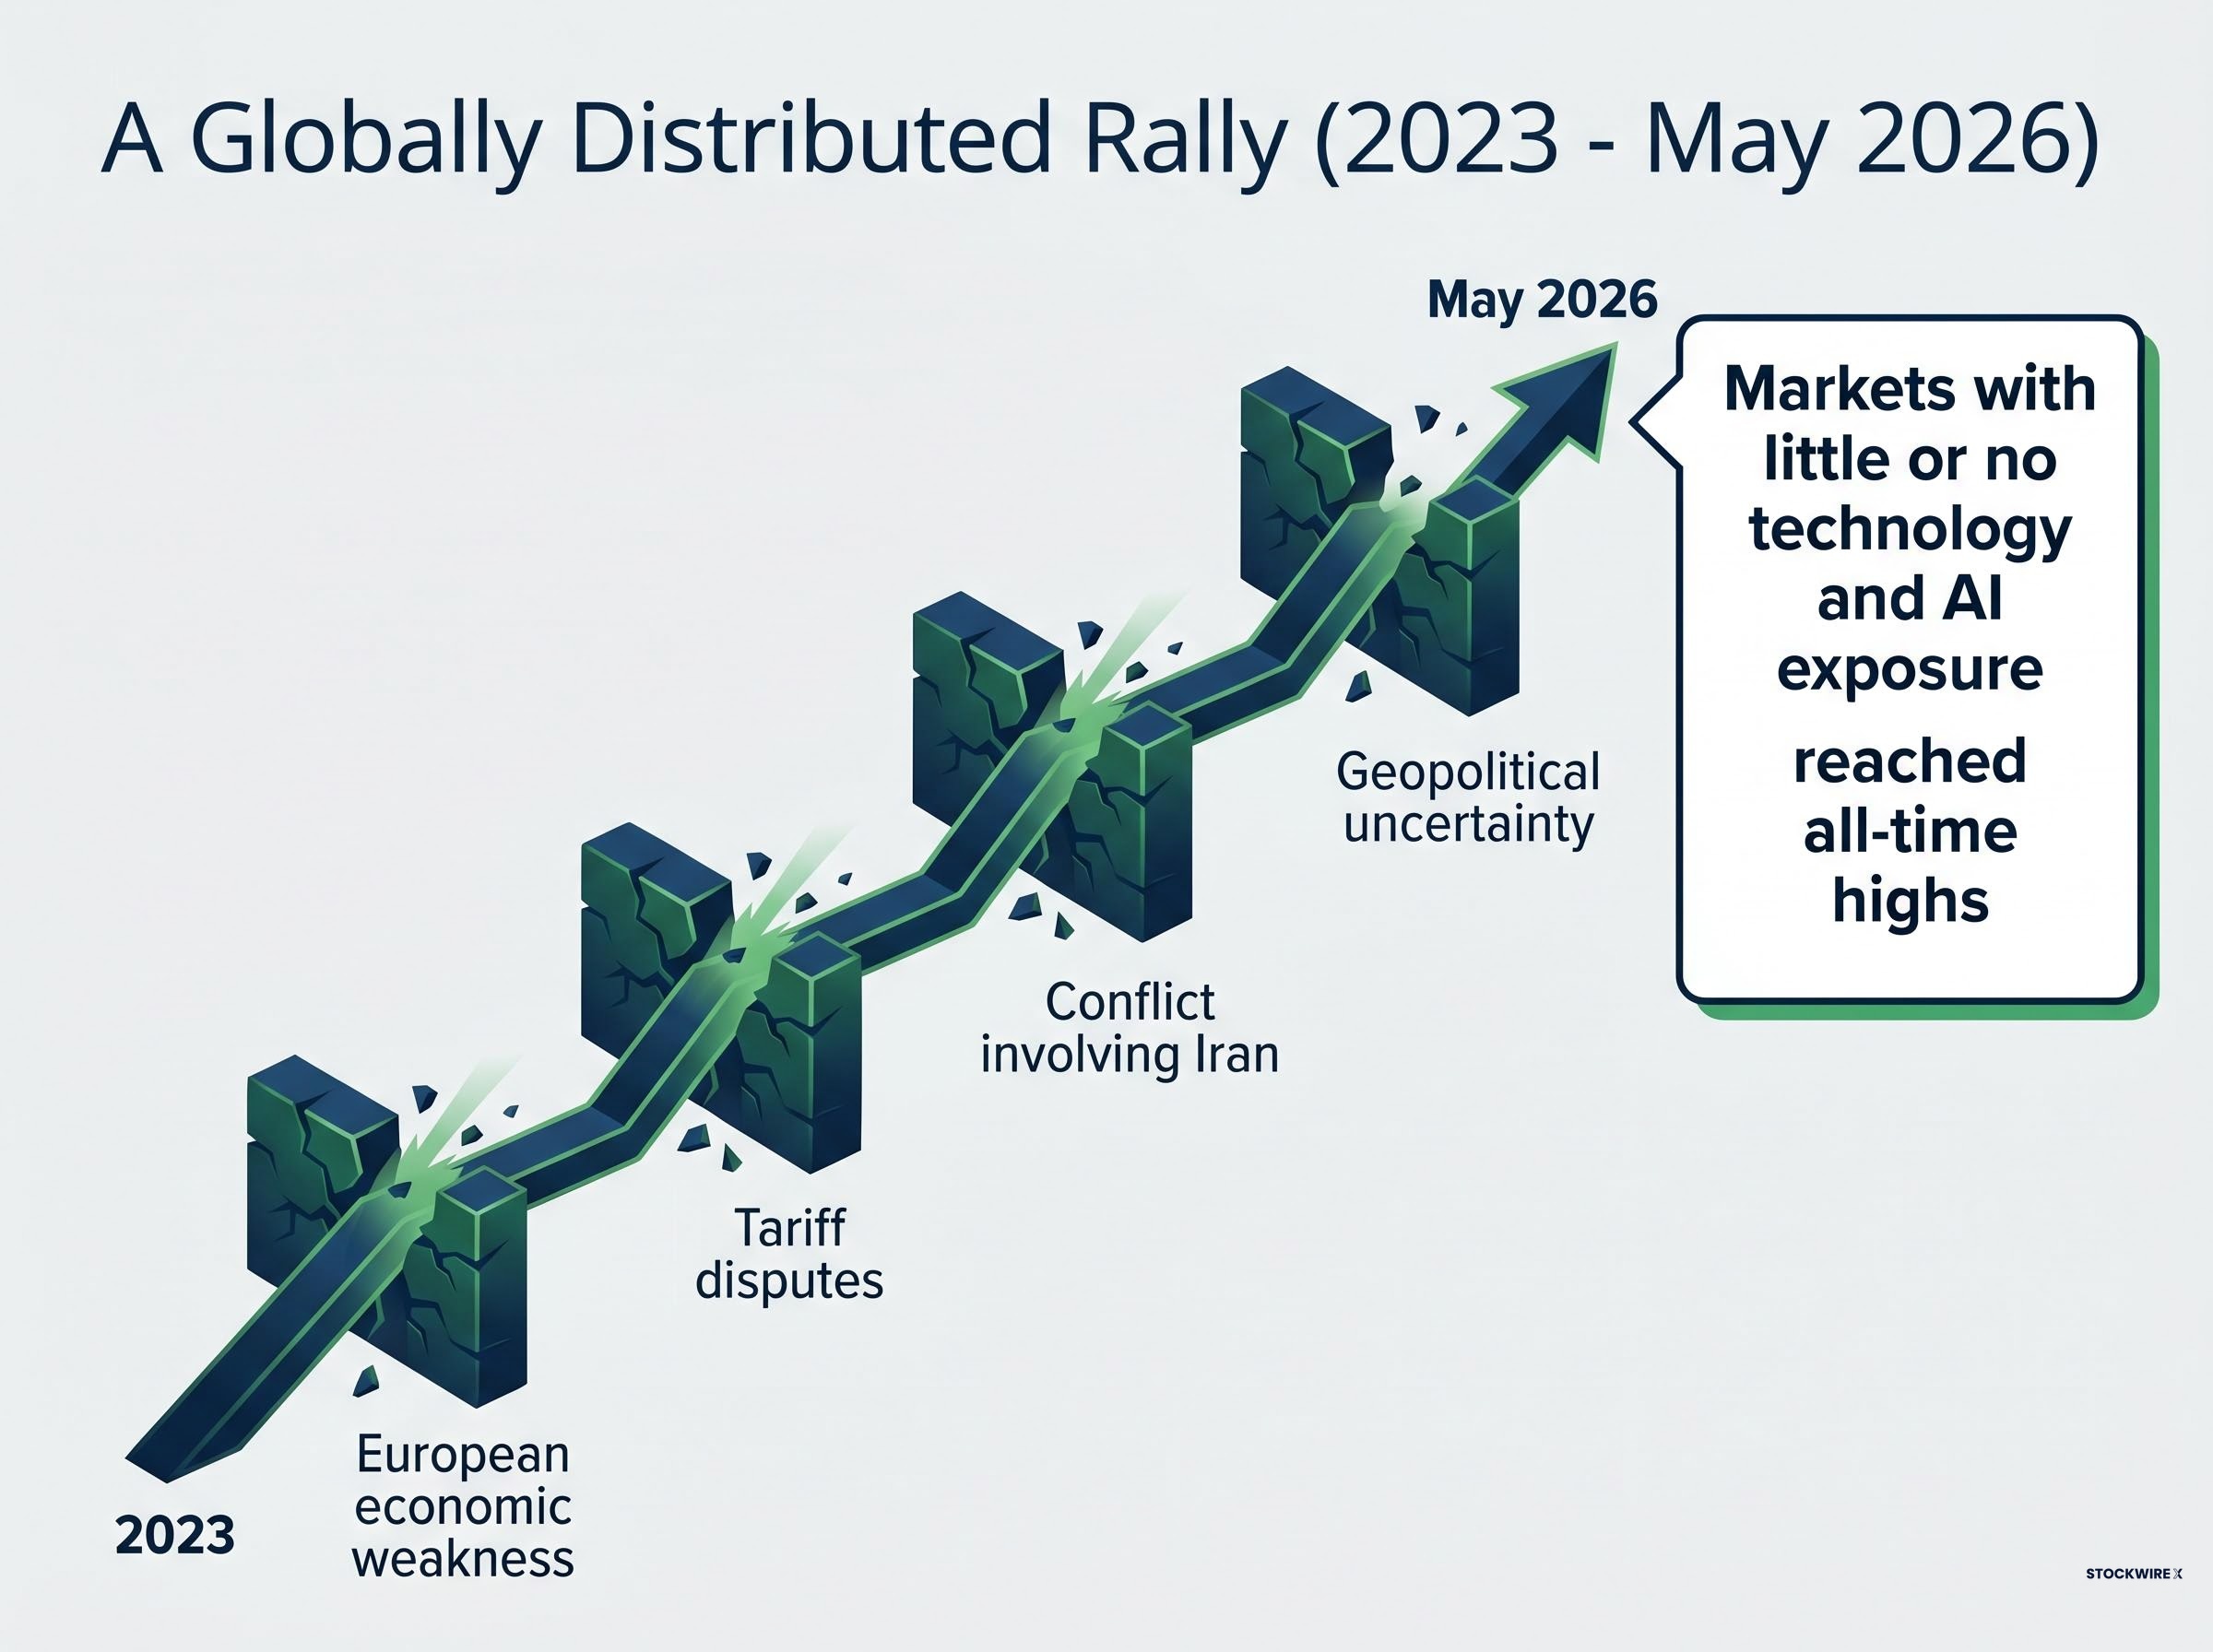
Ken Fisher cited evidence that markets with little or no technology and AI exposure have also reached all-time highs, a trend observed consistently from 2023 through May 2026. That breadth is the empirical backbone of the optimism-to-euphoria transition assessment. When gains are concentrated in a single sector, the cycle is vulnerable to sector-specific reversals. When gains are global and multi-sector, the underlying sentiment shift is structural rather than thematic.
Markets have continued to rise through a wall of concerns that would, in earlier phases, have triggered sustained pullbacks:
- European economic weakness and sluggish growth data
- Ongoing tariff disputes between major trading blocs
- The conflict involving Iran and its implications for energy markets
- Broader geopolitical uncertainty and political instability across multiple regions
The fact that equity markets absorbed these headwinds without surrendering their gains is itself a behavioural signal. It is consistent with the broadening confidence that characterises the transition from optimism into euphoria.
Record-low consumer confidence readings have historically functioned as a contrarian buy signal rather than a warning of imminent collapse, with the University of Michigan’s April 2026 reading of 49.8 arriving simultaneously with S&P 500 levels near all-time highs, a divergence that mirrors the wall-of-worry dynamic running throughout the current cycle.
How past euphoria phases unfolded (and how long they lasted)
The range of historical outcomes is wider than most investors expect. Euphoria phases have varied from roughly one year to several years in duration, depending on the structural conditions of the cycle in question.
The late 1990s offer the most frequently cited precedent. The technology-driven bull market entered a recognisable euphoria phase well before its eventual peak in March 2000, yet investors who remained positioned through the mid-to-late 1990s captured some of the cycle’s largest gains during that final stretch. The phase rewarded patience before it eventually ended sharply.
The limits of historical analogy are real. Each cycle has its own structural character, and duration precedents inform probability, not certainty. Applying the late 1990s template directly to the current environment would ignore the differences in composition, geography, and monetary policy backdrop.
Euphoria phases have historically rewarded patient investors, even as they require heightened attentiveness to the signs that sentiment is reaching its terminal extreme.
What distinguishes this cycle from prior euphoria episodes
Three features of the current environment complicate direct historical comparison. The rally’s geographic breadth is broader than the late 1990s cycle, which was heavily concentrated in US technology. The geopolitical backdrop, including active conflict and trade friction, has not derailed participation in the way previous shocks have. And the absence of narrow sector concentration suggests the rally’s foundation may be more distributed than prior euphoria episodes.
These are reasons for nuance, not reasons to discard the historical lens entirely.
What the data gaps tell us about the limits of the diagnosis
Sentiment-based frameworks like Templeton’s operate without a universally agreed quantitative measure of euphoria. There is no single ratio or survey reading that definitively marks the transition from optimism to euphoria. Phase assessments involve interpretive judgment, and Ken Fisher’s call is one strategist’s reading of where the cycle sits.
Several categories of data would sharpen or challenge the diagnosis if available:
- Current price-to-earnings ratios across major global indices, which would indicate whether valuations are consistent with late-cycle sentiment
- Cyclically adjusted PE ratios (CAPE), which smooth earnings over a longer period and provide a more stable valuation benchmark
- Investor sentiment surveys, such as the AAII Sentiment Survey or similar institutional polling, which would quantify the shift in positioning
- Contrasting strategist views, which would reveal whether the euphoria assessment reflects consensus or a minority reading
- Specific regional market performance data, which would allow a more granular assessment of the breadth claim
The absence of these data points does not invalidate the framework. It does mean that investors should treat the phase assessment as directional, a working hypothesis informed by observable sentiment, rather than a definitive measurement supported by a complete data set.
Institutional fund flow data from the May 2026 BofA Fund Manager Survey captured the largest single-month equity allocation surge ever recorded, a 37-percentage-point jump to a net 50% overweight alongside cash levels falling to 3.9%, providing the kind of quantitative positioning benchmark that sentiment-framework analyses like Fisher’s typically lack.
The AAII Investor Sentiment Survey tracks weekly shifts in bullish, neutral, and bearish positioning among individual investors, providing one of the most widely cited quantitative benchmarks for gauging where retail confidence sits within a given market phase.
Positioning for a phase that rewards patience but punishes complacency
The analytical threads converge on a single investor posture: the euphoria phase warrants heightened awareness, not blanket defensive repositioning.
Fisher’s assessment of early-stage euphoria, combined with a potential timeline of two or more years before the cycle concludes, suggests that continued market participation may be appropriate for many investors. The breadth of the global rally supports this view. Gains are not dependent on a single sector or geography, which historically makes the cycle more durable.
The tension is real, though. Euphoria phases become increasingly high-stakes as they extend. The returns available in the final stretch of a bull market can be substantial, but the reversal, when it eventually arrives, tends to be sharp and punishing for investors who were not prepared.
Four considerations for investors navigating this phase:
- Review time horizon. Investors with shorter time horizons face asymmetric risk as the phase matures. The potential for strong near-term returns exists alongside the potential for a sharp drawdown.
- Assess concentration. Portfolios heavily weighted toward a single sector or region may be more vulnerable to a sentiment reversal than diversified holdings.
- Monitor sentiment indicators. Tracking investor surveys, valuation ratios, and fund flow data provides an early-warning function that complements the framework diagnosis.
- Establish a response plan. Deciding in advance how to respond to a phase transition reduces the likelihood of reactive decision-making during a downturn.
For investors wanting to understand the psychological mechanisms that make late-cycle positioning so difficult to maintain, our dedicated guide to loss aversion and investor behaviour walks through Kahneman and Tversky’s prospect theory, Morningstar’s documented 1-2 percentage point annual return shortfall from emotional selling, and three practical pre-commitment tools that interrupt loss aversion before it reaches the sell button.
This article is for informational purposes only and should not be considered financial advice. Investors should conduct their own research and consult with financial professionals before making investment decisions.
Past performance does not guarantee future results. Financial projections are subject to market conditions and various risk factors.
The bull market’s final chapter may still have years to run
The transition into early-stage euphoria is a meaningful signal about where the market cycle sits. It is not a sell signal. Templeton’s framework describes a bull market that began in pessimism, travelled through skepticism and optimism, and has now arrived at the phase that is historically the most emotionally charged and the most easily misread.
The question for investors is not whether to participate. It is how to participate with clear eyes about where the cycle stands and what the range of outcomes looks like from here. The data supports continued engagement; the framework demands continued vigilance.
Investors may find value in revisiting their portfolio strategy in light of this cycle-phase analysis. Consulting a financial adviser to assess how specific circumstances, time horizons, and risk tolerances align with the current market phase is a practical step that matches the moment.
—