Tesla trades at a trailing price-to-earnings ratio above 360x. No mature automaker on earth commands anything close to that multiple. The question is not whether the number looks extreme; it is whether anything behind it justifies the price.
The stock is not a bet on cars. It is a bet on two specific future businesses: robotaxis and Optimus, Tesla’s humanoid robot programme. The Q2 2026 earnings call on 23 July 2026 gave investors the clearest picture yet of how both are developing relative to how optimistically they have been priced.
Here is the framework for separating which of Tesla’s two growth pillars has a defensible near-term earnings path and which is better treated as a long-horizon option, so you can form a grounded view on whether the current premium is reasonable.
What the market is actually pricing at $1.4 trillion
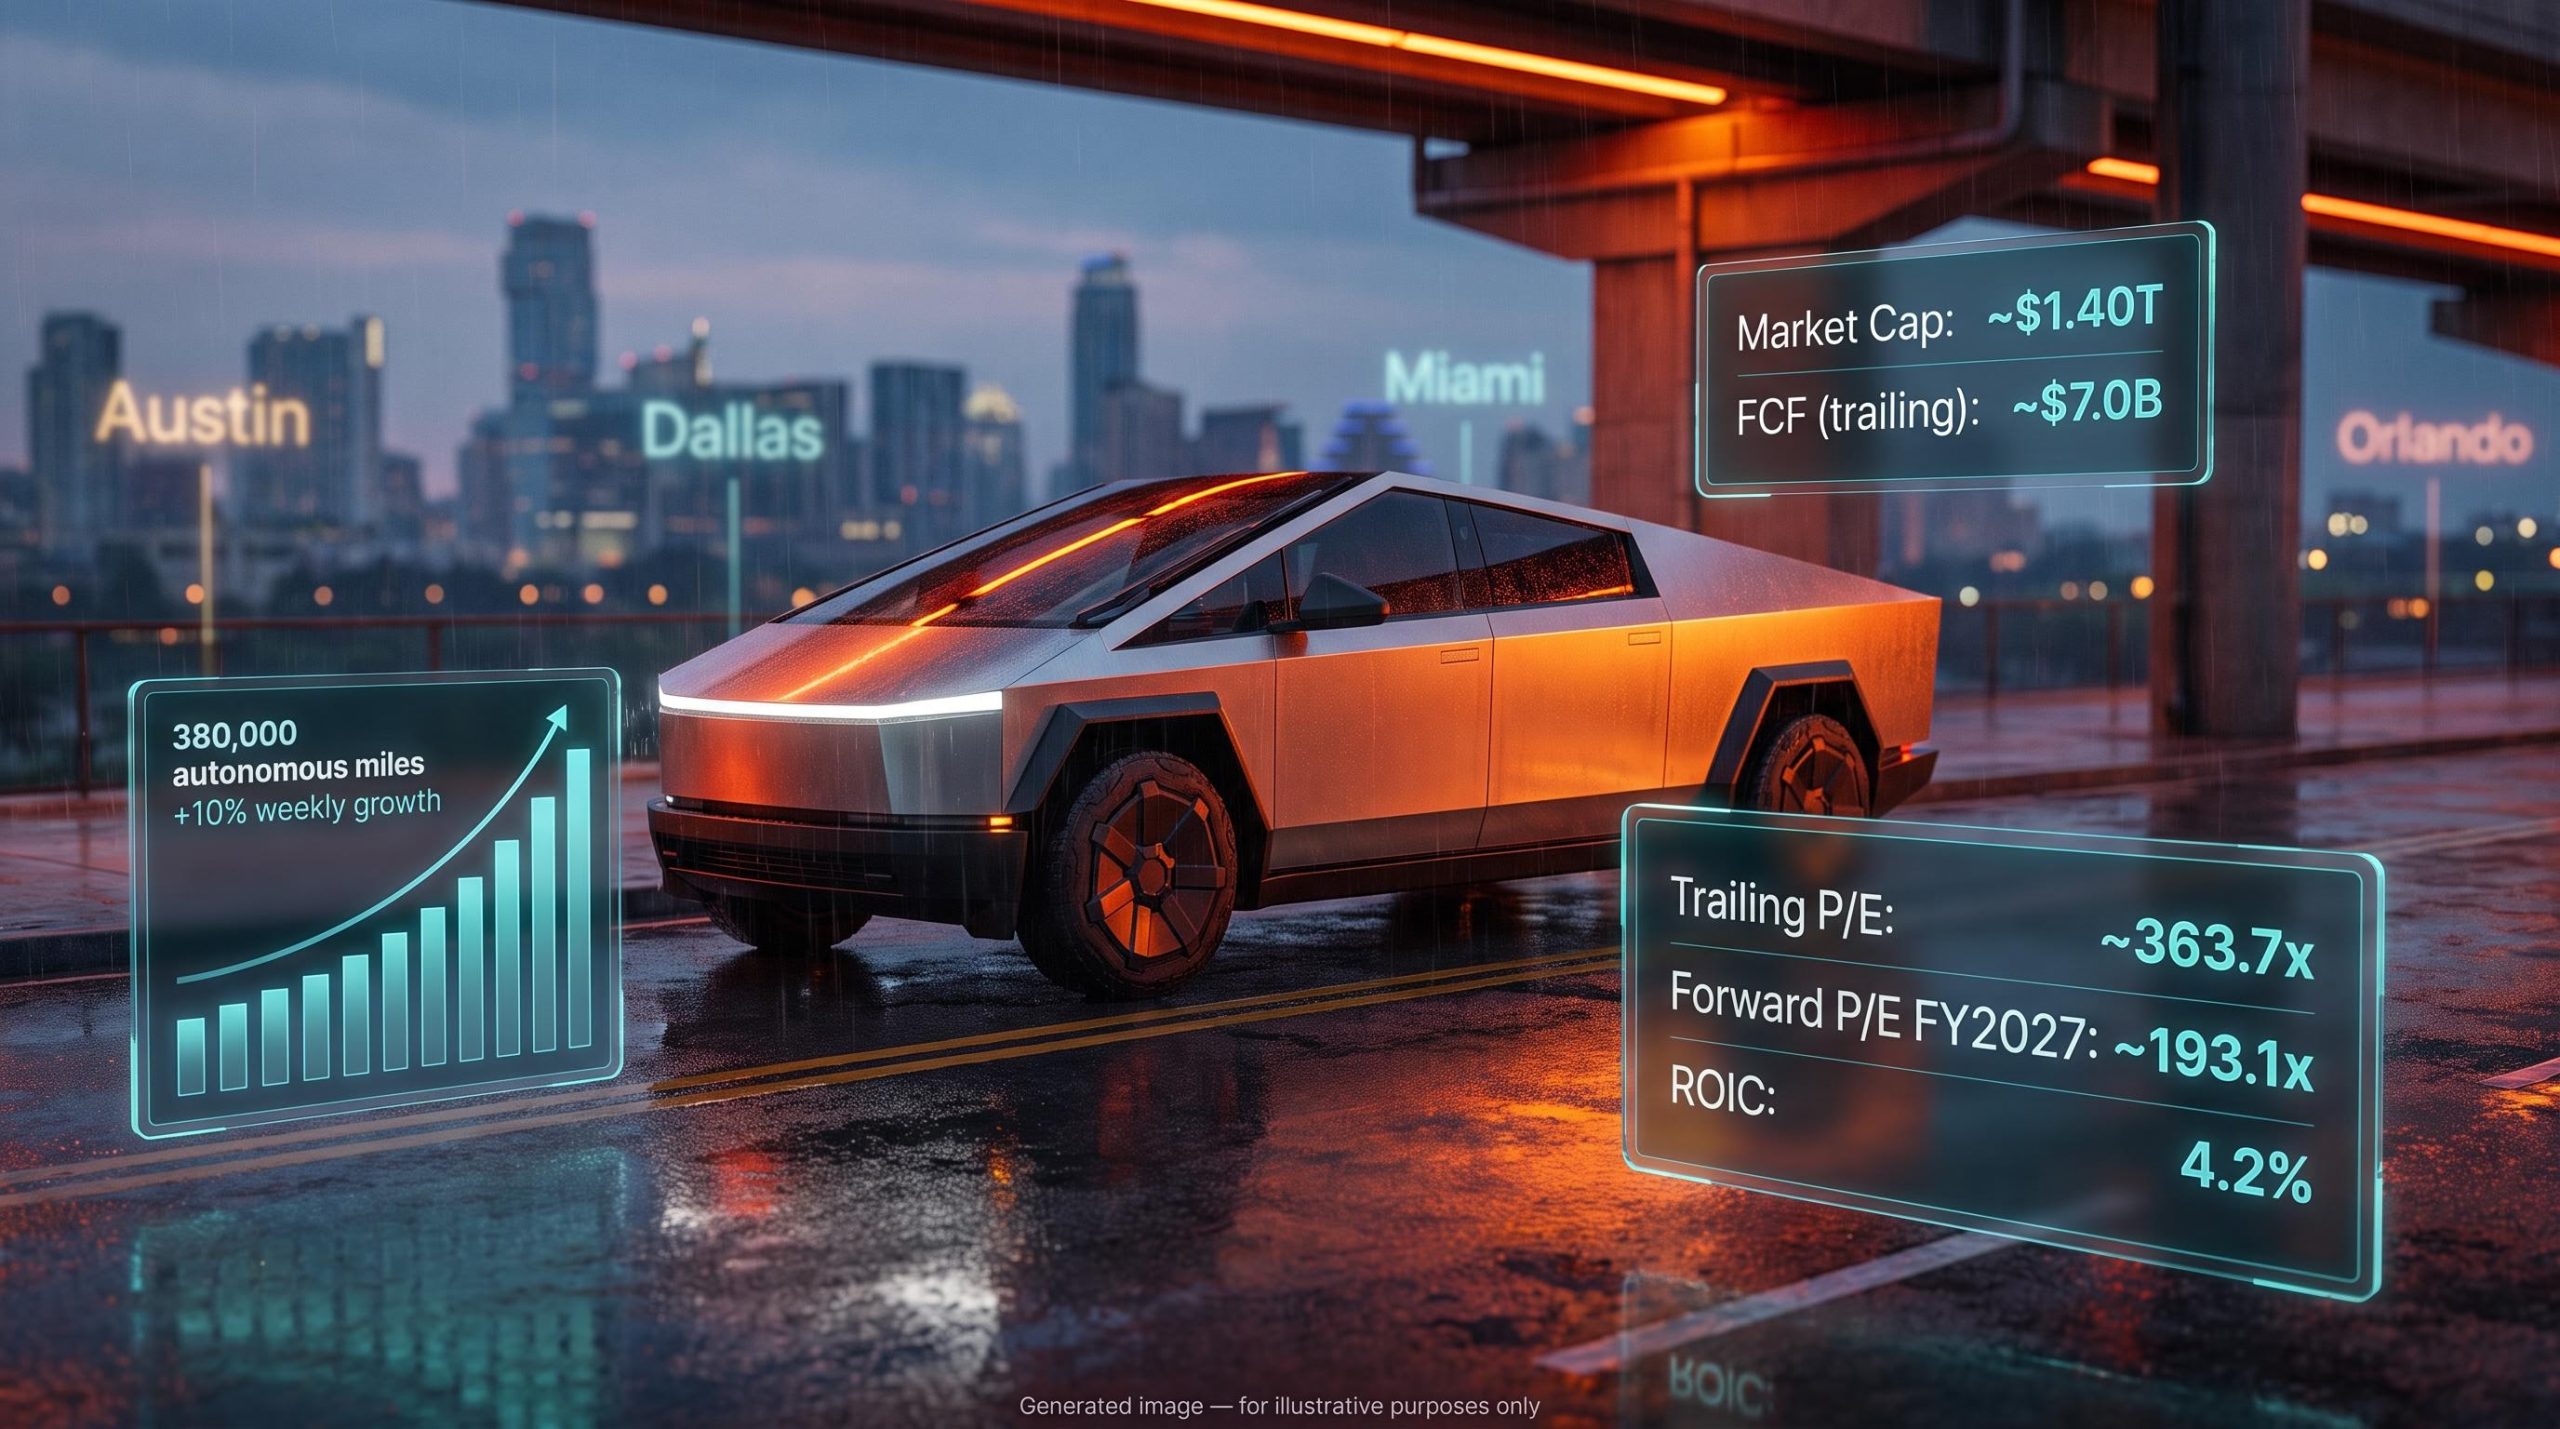
Tesla’s market capitalisation sits at approximately $1.40 trillion. The company’s trailing P/E ratio is roughly 363.7x. Its levered free cash flow over the past twelve months is approximately $7.0 billion. These are the numbers of a company whose stock price has left its current earnings several years behind.
| Metric | Value | Implied interpretation |
|---|---|---|
| Trailing P/E | ~363.7x | Current earnings justify a fraction of the price |
| Forward P/E (FY2027) | ~193.1x | Even next year’s consensus earnings leave a massive gap |
| Forward P/E (FY2028) | ~140x | Multiple compression requires sustained double-digit EPS growth |
| ROIC | 4.2% | Returns below estimated cost of capital |
| Levered FCF (trailing) | ~$7.0B | Implies ~200x free cash flow multiple |
The sharpest single figure in that table is the 4.2% ROIC. Return on invested capital measures whether the money a company deploys actually generates returns above what it costs to raise that capital. At 4.2%, Tesla is not yet creating economic value at scale. The stock is not being valued on what it earns today but on what it must earn a decade from now.
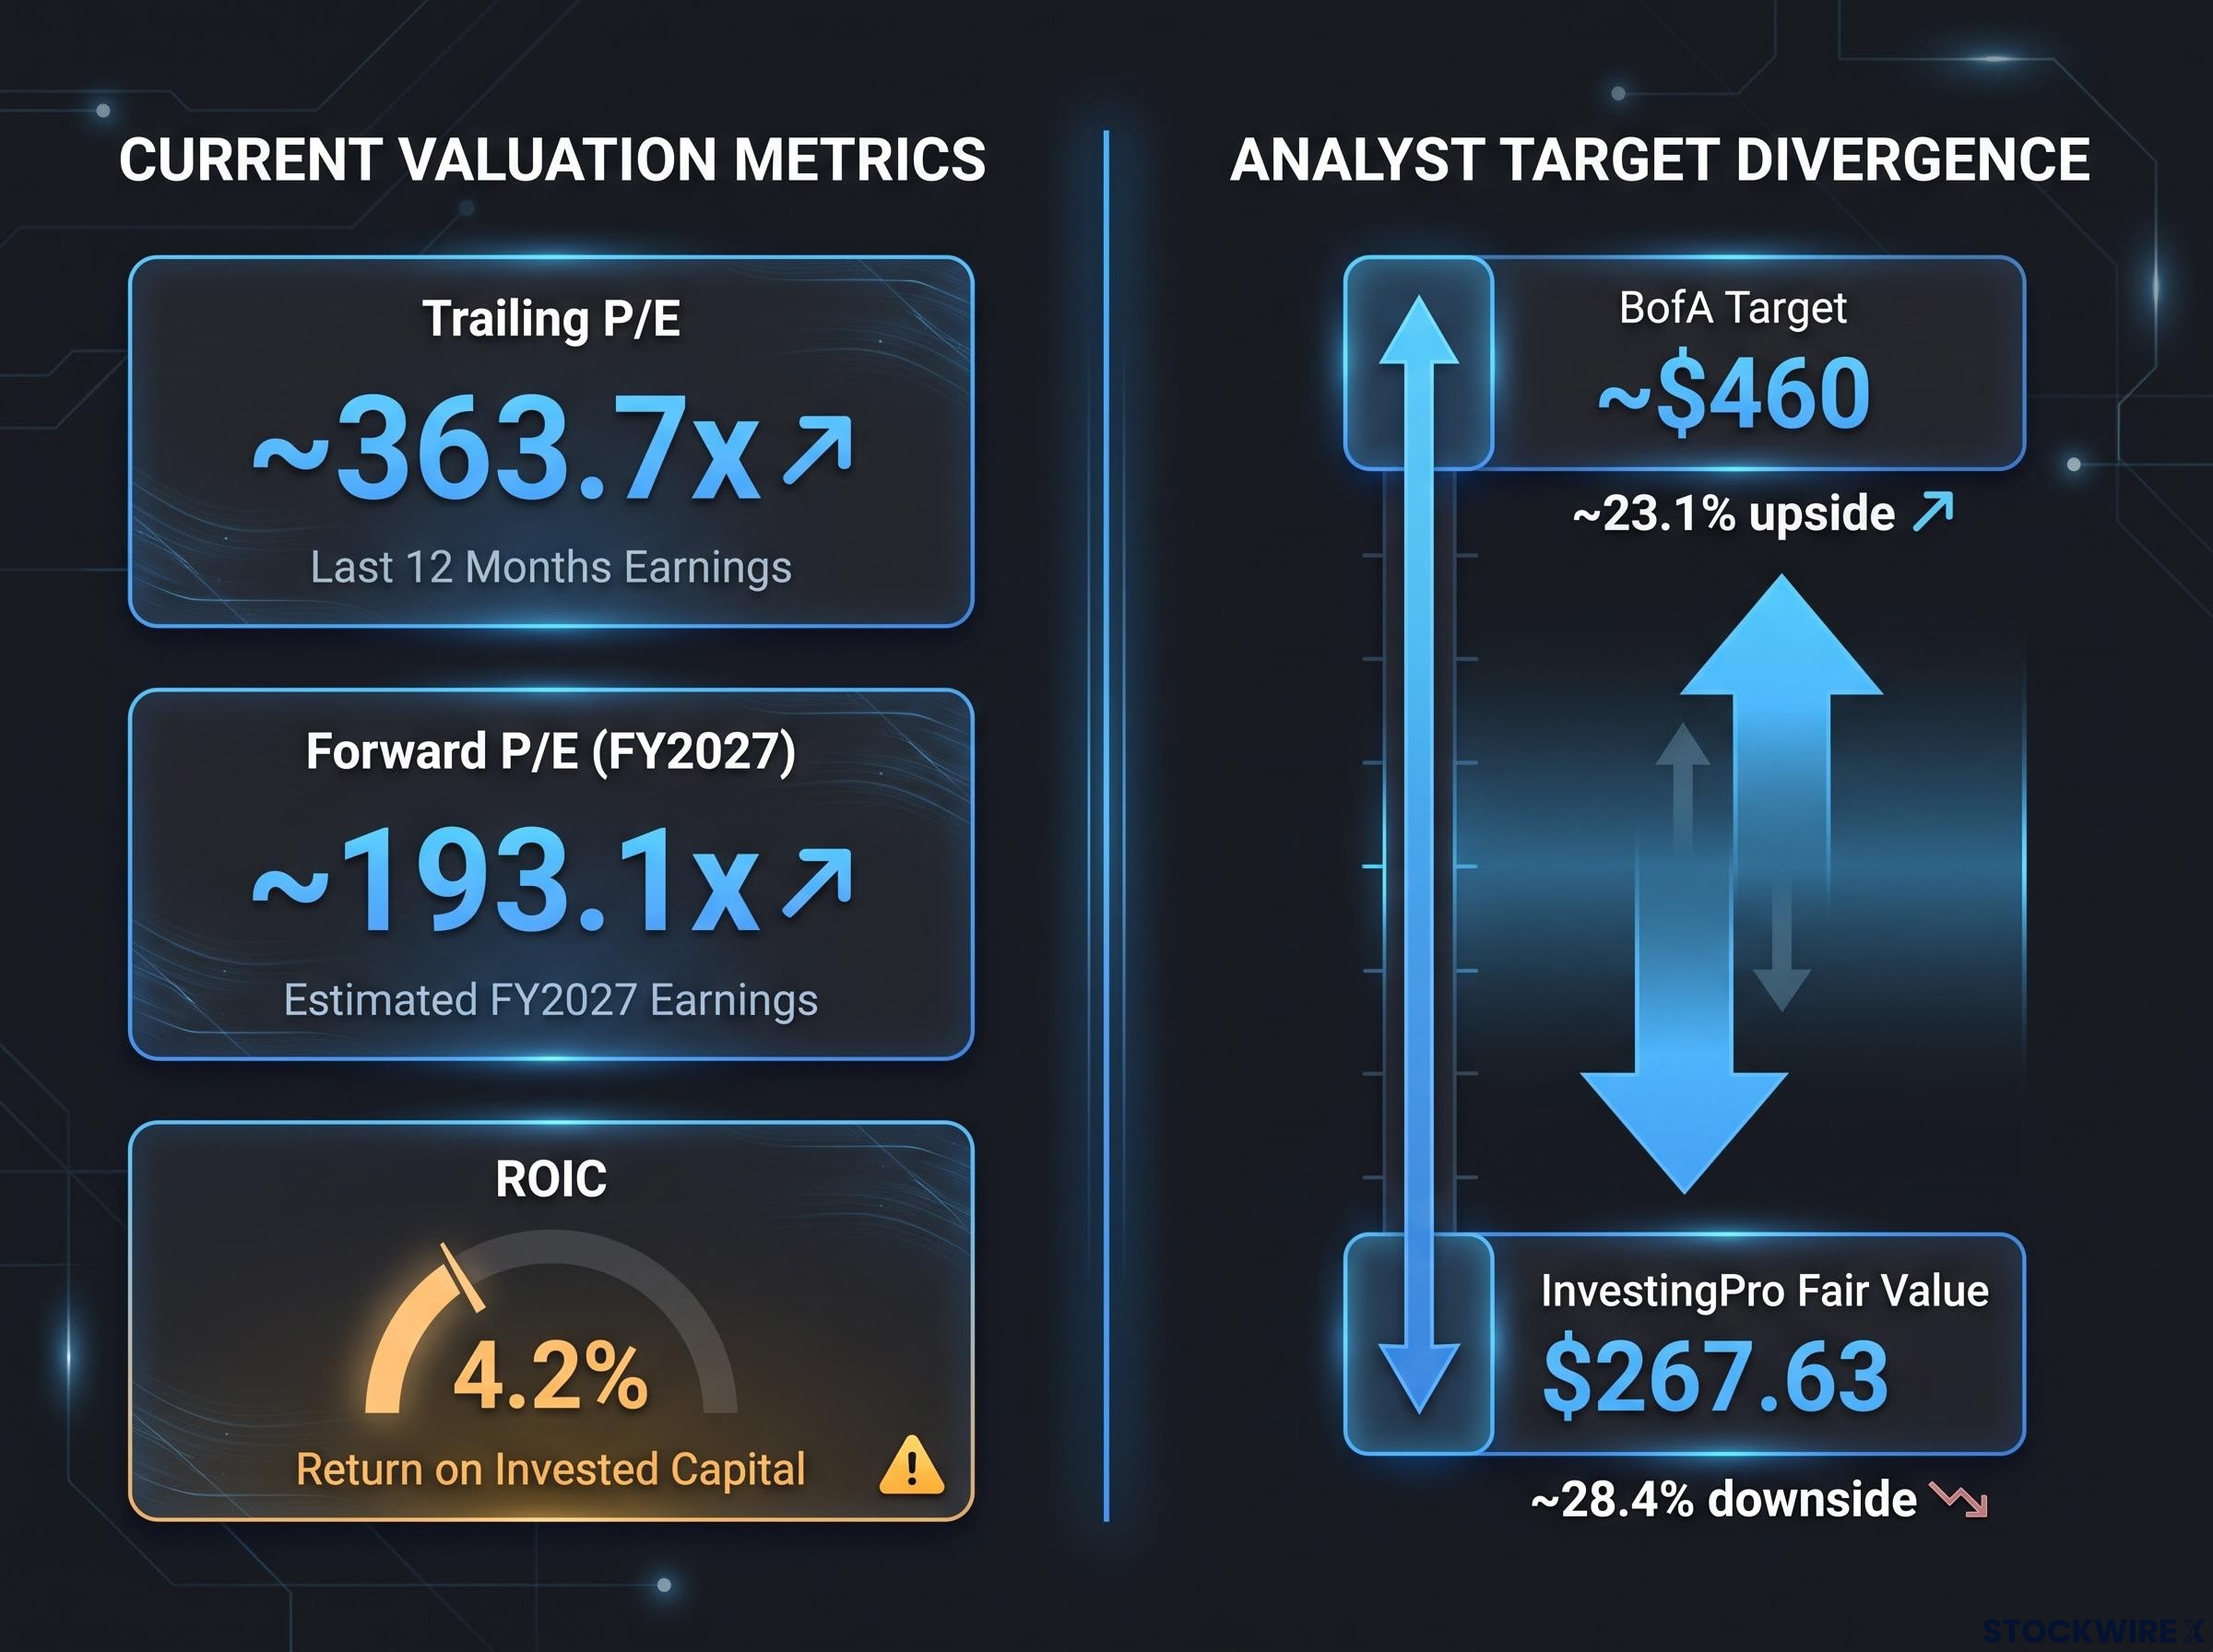
That gap is the lens through which every robotaxi and Optimus data point in this article should be read. The InvestingPro fair value estimate of $267.63 implies approximately 28.4% downside from the prevailing price. BofA‘s analyst price target of roughly $460 implies approximately 23.1% upside. The spread between those two figures tells you how contested this valuation is among professional analysts.
JPMorgan’s physical AI thesis, which projects robotaxi, Optimus, and FSD licensing driving roughly half of Tesla’s revenue growth from 2025 to 2030, provides important institutional context for the BofA $460 target cited here, with JPMorgan arriving at a comparable $475 figure while still rating the stock Neutral rather than Overweight.
When big ASX news breaks, our subscribers know first
How P/E multiples work at Tesla’s scale (and why they matter for evaluating growth bets)
A forward P/E of 193x means investors are paying today for earnings they expect to materialise years from now. Consensus expects Tesla to earn approximately $1.94 per share in FY2027. At a share price above $370, the market is pricing in earnings growth that extends well beyond that single year, discounting future profits back to a present value and embedding them in the stock price now.
The implied growth rate embedded in Tesla’s current share price converts the 193x forward multiple into a concrete revenue demand: the minimum annual growth the company must sustain for today’s entry price to generate a target return, a figure that trailing P/E ratios never surface on their own.
The distinction that matters is between two types of premium. The first is a multiple that prices in a near-term growth catalyst, one where the evidence is visible and the revenue pathway is identifiable. The second is a multiple that prices in a long-horizon option, justifiable only with scenario-based probability weighting across a range of possible futures.
Why the robotaxi-versus-Optimus distinction matters here
Because Tesla’s multiple is extreme, the question of which business line will generate earnings in the near term versus the 2030s is not academic. It determines whether the premium is reasonable. Three scenarios capture the range of outcomes:
- Near-term catalyst earns the multiple: Robotaxi scales to commercial revenue by 2027-2028 with disclosed margins, partially justifying the forward P/E.
- Long-horizon option partially earns it: Robotaxi grows but slowly, Optimus remains pre-revenue, and the multiple is sustained mainly by narrative momentum and optionality.
- Timeline slips and the multiple compresses: Neither programme hits management targets, ROIC stays depressed, and the gap between price and earnings narrows from the price side.
A 193x forward multiple is not unusual for a company whose earnings are expected to grow dramatically over the next decade. But it becomes precarious the moment that earnings timeline slips, which makes the pace of robotaxi and Optimus commercialisation the single most important variable to track.
Citizens Financial initiated coverage with a Market Perform rating, concluding that near-term expectations look too ambitious given the difficulty of bringing Optimus to market and that Tesla remains firmly in a capital-outlay phase for the programme rather than an earnings-generation phase. BofA takes a more constructive stance with its $460 target. The divergence between the two reflects the same framework: how much present value to assign future earnings that do not yet exist.
Robotaxi: what the Q2 2026 evidence shows and where the gaps remain
What management reported
During the Q2 2026 earnings call, Tesla disclosed a set of specific operational figures for its robotaxi programme. The unsupervised service had by that point logged 380,000 total autonomous miles across operations in six cities, with weekly mileage expanding at roughly 10% each week. Two new markets, Orlando and Tampa, went live on approximately 22 July 2026, the day before the earnings release, extending the footprint beyond Austin (where the service launched in January 2026), Dallas, Houston, and Miami.
| City | Start date | Operational status |
|---|---|---|
| Austin | January 2026 | Operational (unsupervised) |
| Dallas | 2026 | Operational (unsupervised) |
| Houston | 2026 | Operational (unsupervised) |
| Miami | 2026 | Operational (unsupervised) |
| Orlando | ~22 July 2026 | Recently launched |
| Tampa | ~22 July 2026 | Recently launched |
The 10% week-over-week growth rate is the most important single data point here. If it holds, it compounds into a materially larger operation by year-end. At that pace, weekly mileage roughly doubles every seven weeks.
Management stated that profitability from the robotaxi segment is not expected before 2027. Elon Musk reiterated his target of a “widespread” U.S. presence by the end of 2026, contingent on regulatory approval. The Cybercab, the purpose-built vehicle without a steering wheel or pedals, commits Tesla to fully unsupervised autonomy rather than a hybrid human-fallback model. That raises both the ceiling and the risk profile.
What external observers see
Third-party trackers and press coverage describe a different scale of operations. External reporting characterises the fleet as roughly 42-59 vehicles in Texas, with operations described as low-key pilots rather than a commercial launch. One third-party source cited approximately 7,000 robotaxi miles in Austin after two months (this figure is unverified and should be treated with appropriate caution).
Critical coverage has characterised the programme as still nascent and behind frontrunners such as Waymo. Technical experts have noted that training AI to handle rare edge cases in traffic can take years, even with large datasets.
The discrepancy between management-reported figures and external observations is material. Both perspectives are preserved here because the gap itself is relevant to any valuation assessment. The 10% weekly growth rate needs independent verification before it can anchor a valuation argument.
Optimus: a 2030s option wearing a 2026 price tag
The scale of Tesla’s Optimus ambitions is striking. The company’s Gen 3 platform carries a stated production objective of around 1 million units annually, while Gen 4 points toward roughly 10 million units per year. These figures represent aspirations over a multi-year horizon rather than deliverables on any near-term roadmap, yet they indicate the magnitude of what Tesla is ultimately targeting.
Now consider the supply chain reality and the timeline:
- Fremont facility output is scheduled to commence in late July or August 2026, with management flagging that the initial ramp will be slow and incremental
- Management acknowledged that progress is being held back by the need to construct an entirely new supply chain that has no precedent to draw on
- Musk has stated he expects to offer Optimus to external customers around 2027, after deploying it internally in Tesla’s own factories
- Citizens Financial characterised Tesla as at the beginning of an Optimus investment cycle, meaning capital outlays precede meaningful revenue contribution
BofA projects total global humanoid robot shipments across the entire industry at approximately 1.2 million units by 2030. If the entire market is only 1.2 million by the end of the decade, Tesla’s Gen 3 target of 1 million units per year for a single company implies either extraordinary market share capture or a timeline that extends well past 2030.
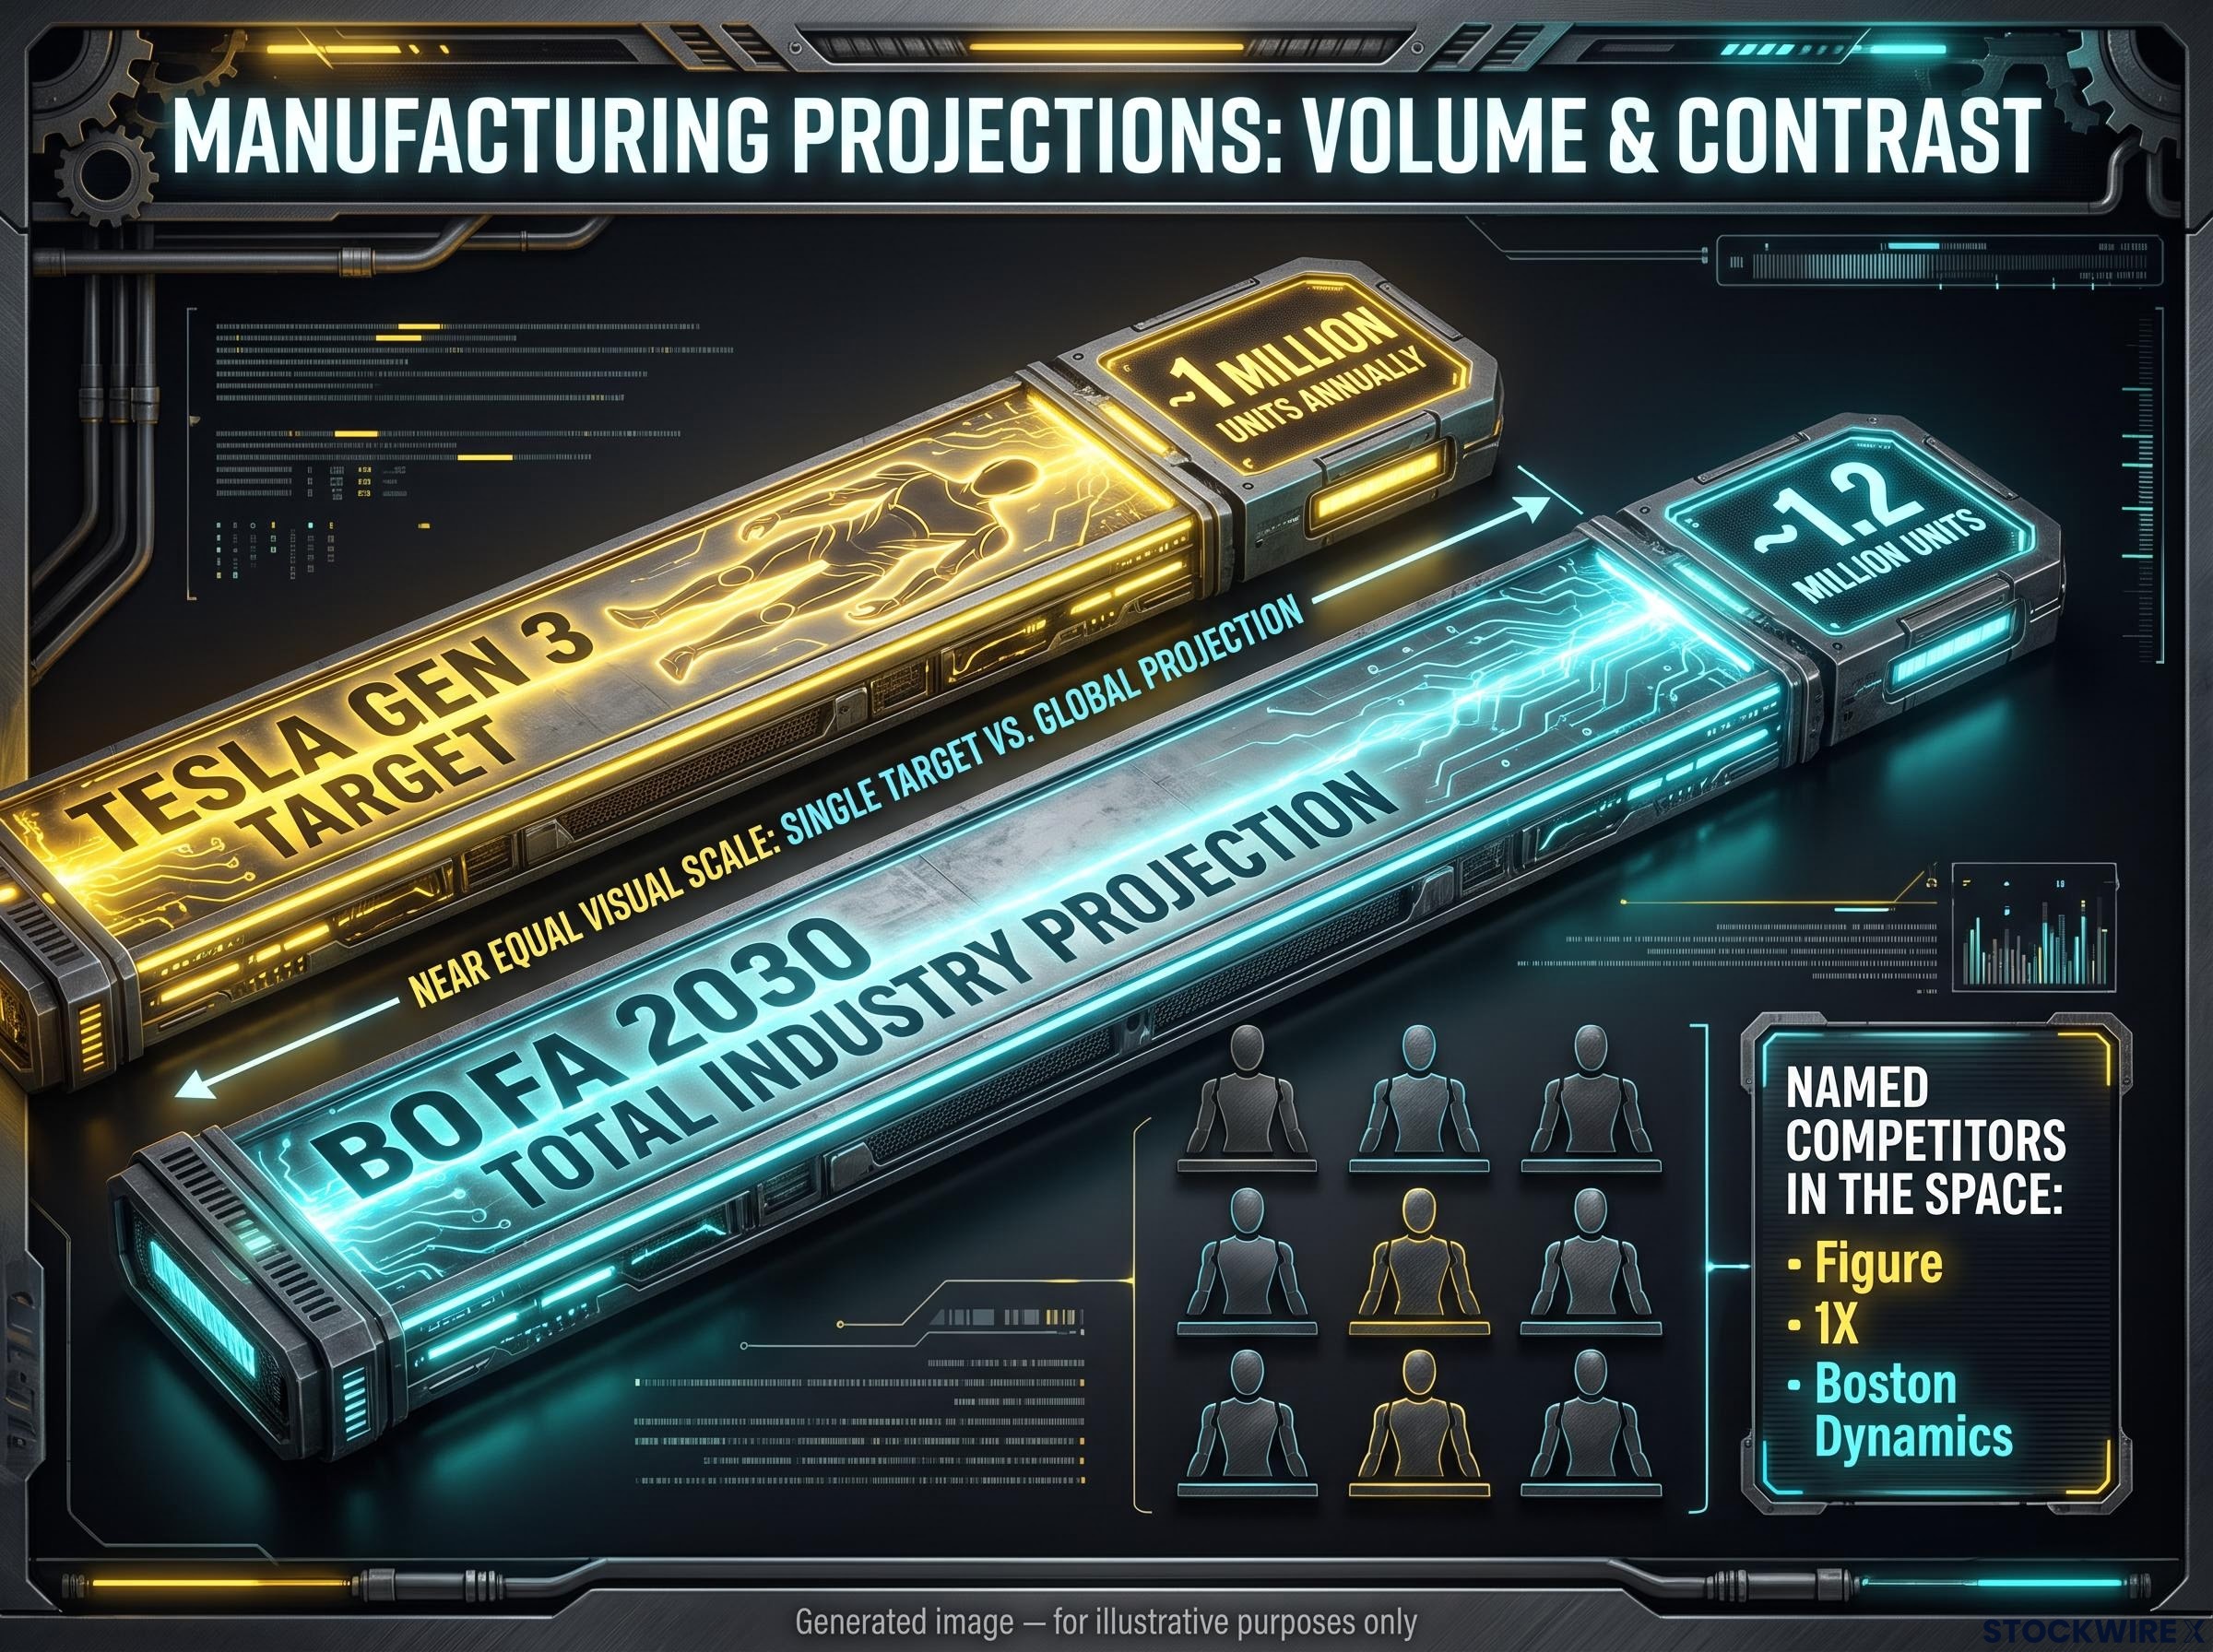
The competitive field is already crowded. Named competitors pursuing humanoid robots include:
The humanoid robot competitive landscape extends well beyond the named US players, with China’s deployment-scale data advantage and control of approximately 93% of global permanent magnet supply creating structural constraints for any US manufacturer attempting to ramp hardware production at the pace Tesla’s Gen 3 and Gen 4 targets imply.
- Figure
- 1X
- Boston Dynamics
- Major Chinese manufacturers
Optimus could justify enormous future value if the technology works and the market scales. But at a starting point of roughly 193x forward earnings with a 4.2% ROIC, the prudent approach is to assign it modest present value and treat most of its potential as 2030s-plus upside. In the interim, it is primarily a capex and R&D drag on free cash flow.
Which pillar carries more weight, and what that means for the premium
Robotaxi is the more defensible component of the current premium. It has operating vehicles, management-reported mileage growth, and a pathway to revenue that could begin materialising in 2027. “More defensible” still means medium-term catalyst with significant execution risk, not fully priced near-term earnings.
Optimus is a long-dated call option. It should be assigned scenario-weighted probability value rather than forming the core of a 193x forward P/E thesis for the current fiscal year.
| Dimension | Robotaxi | Optimus |
|---|---|---|
| Current commercial maturity | Unsupervised pilots in six U.S. cities | Pre-production; factory deployment pending |
| Earliest realistic revenue | 2027 (management guidance) | 2030s (external commercial sales) |
| Key near-term milestone | Multi-city scaling with disclosed margins | Fremont production volumes confirmed |
| Valuation role | Near-term catalyst (partially earns premium) | Long-dated option (optionality, not core thesis) |
Three specific milestones would shift the multiple:
- Robotaxi scales credibly across multiple cities with disclosed revenue per ride and positive unit economics. This would support the premium expanding further.
- Optimus confirms Fremont production volumes and secures its first external customer deployment. This would begin converting optionality into tangible value.
- Either programme experiences a timeline slip or a high-profile safety incident resets the regulatory environment. This would compress the multiple, potentially sharply.
The InvestingPro fair value of $267.63 reflects how consensus modelling treats these programmes when earnings-based rather than narrative-based methods are applied. The gap between that figure and the current price is, in effect, the market’s option premium on both programmes succeeding faster than conservative models assume.
The signals worth watching before making a call on Tesla’s premium
Tesla’s valuation is not a mystery to be solved today. It is a hypothesis to be tested over the next four to six quarters. The specific data points below are the tests.
Robotaxi signals:
- Number of cities with unsupervised commercial service. If Tesla expands beyond six cities with sustained operations by Q4 2026, the scaling thesis strengthens. If the count stalls, it weakens.
- Total autonomous miles and week-over-week growth trajectory. The 10% weekly figure needs to hold or accelerate through H2 2026. Deceleration is a warning.
- Safety data relative to human drivers. Any publicly disclosed safety metrics that compare favourably to human baselines would materially support the regulatory case.
- Revenue per ride disclosure. Until Tesla reports actual revenue and margin per robotaxi ride, the profit pathway remains assumption rather than evidence.
Optimus signals:
- Fremont production confirmation and volume trajectory. The gradual ramp beginning in late July or August 2026 needs to produce verifiable output numbers by Q3 reporting.
- First external customer deployment timing. Musk’s 2027 target for external sales is the commitment against which progress should be measured.
- Supply chain ramp confirmation. Any evidence that the newly built supply chain is scaling (or not) directly affects the credibility of the million-unit aspiration.
Both the InvestingPro downside case ($267.63) and the BofA upside case (~$460) can be rational simultaneously given the range of plausible outcomes. The multiple will move toward one or the other as these milestones are hit or missed. The valuation debate is not settled; you now have the framework to interpret the evidence as it arrives.
For investors who want to build their own probability-weighted model around these milestones, our comprehensive walkthrough of probability-weighted scenario analysis shows how to assign bull, base, and bear probabilities to specific monitoring triggers and convert them into a single blended expected return testable against any entry price.
This article is for informational purposes only and should not be considered financial advice. Investors should conduct their own research and consult with financial professionals before making investment decisions. Past performance does not guarantee future results. Financial projections are subject to market conditions and various risk factors.