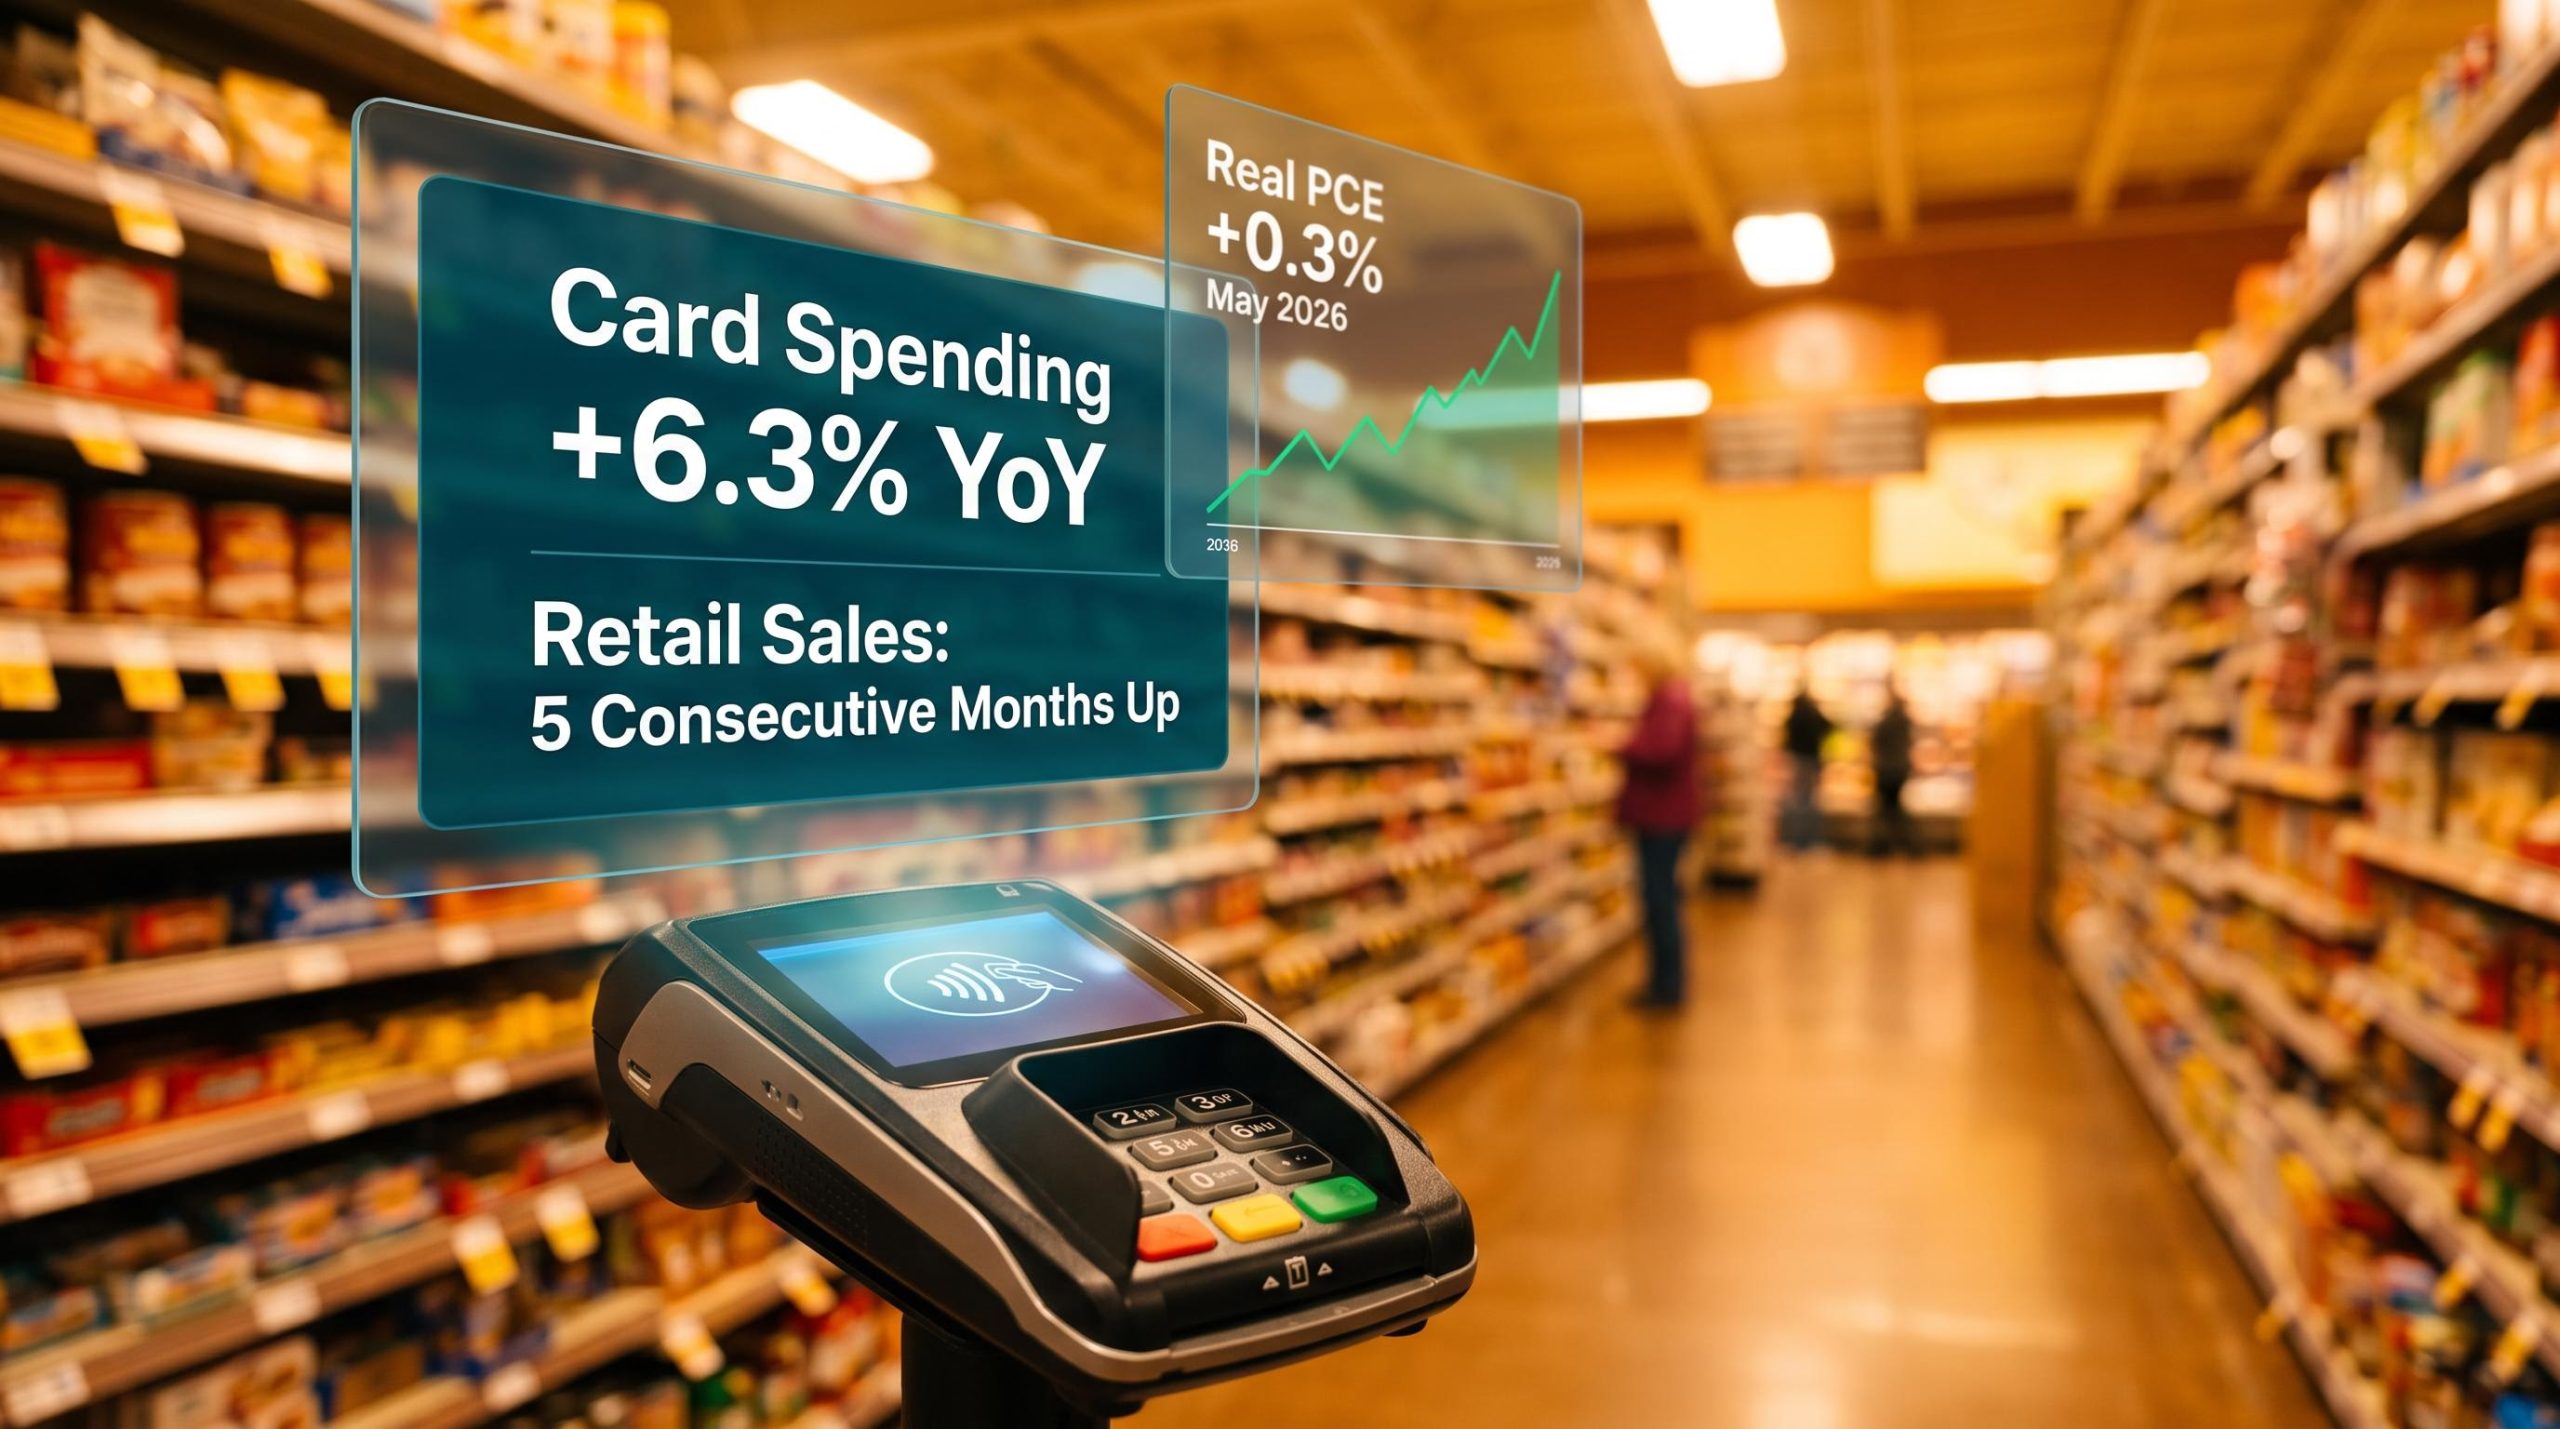
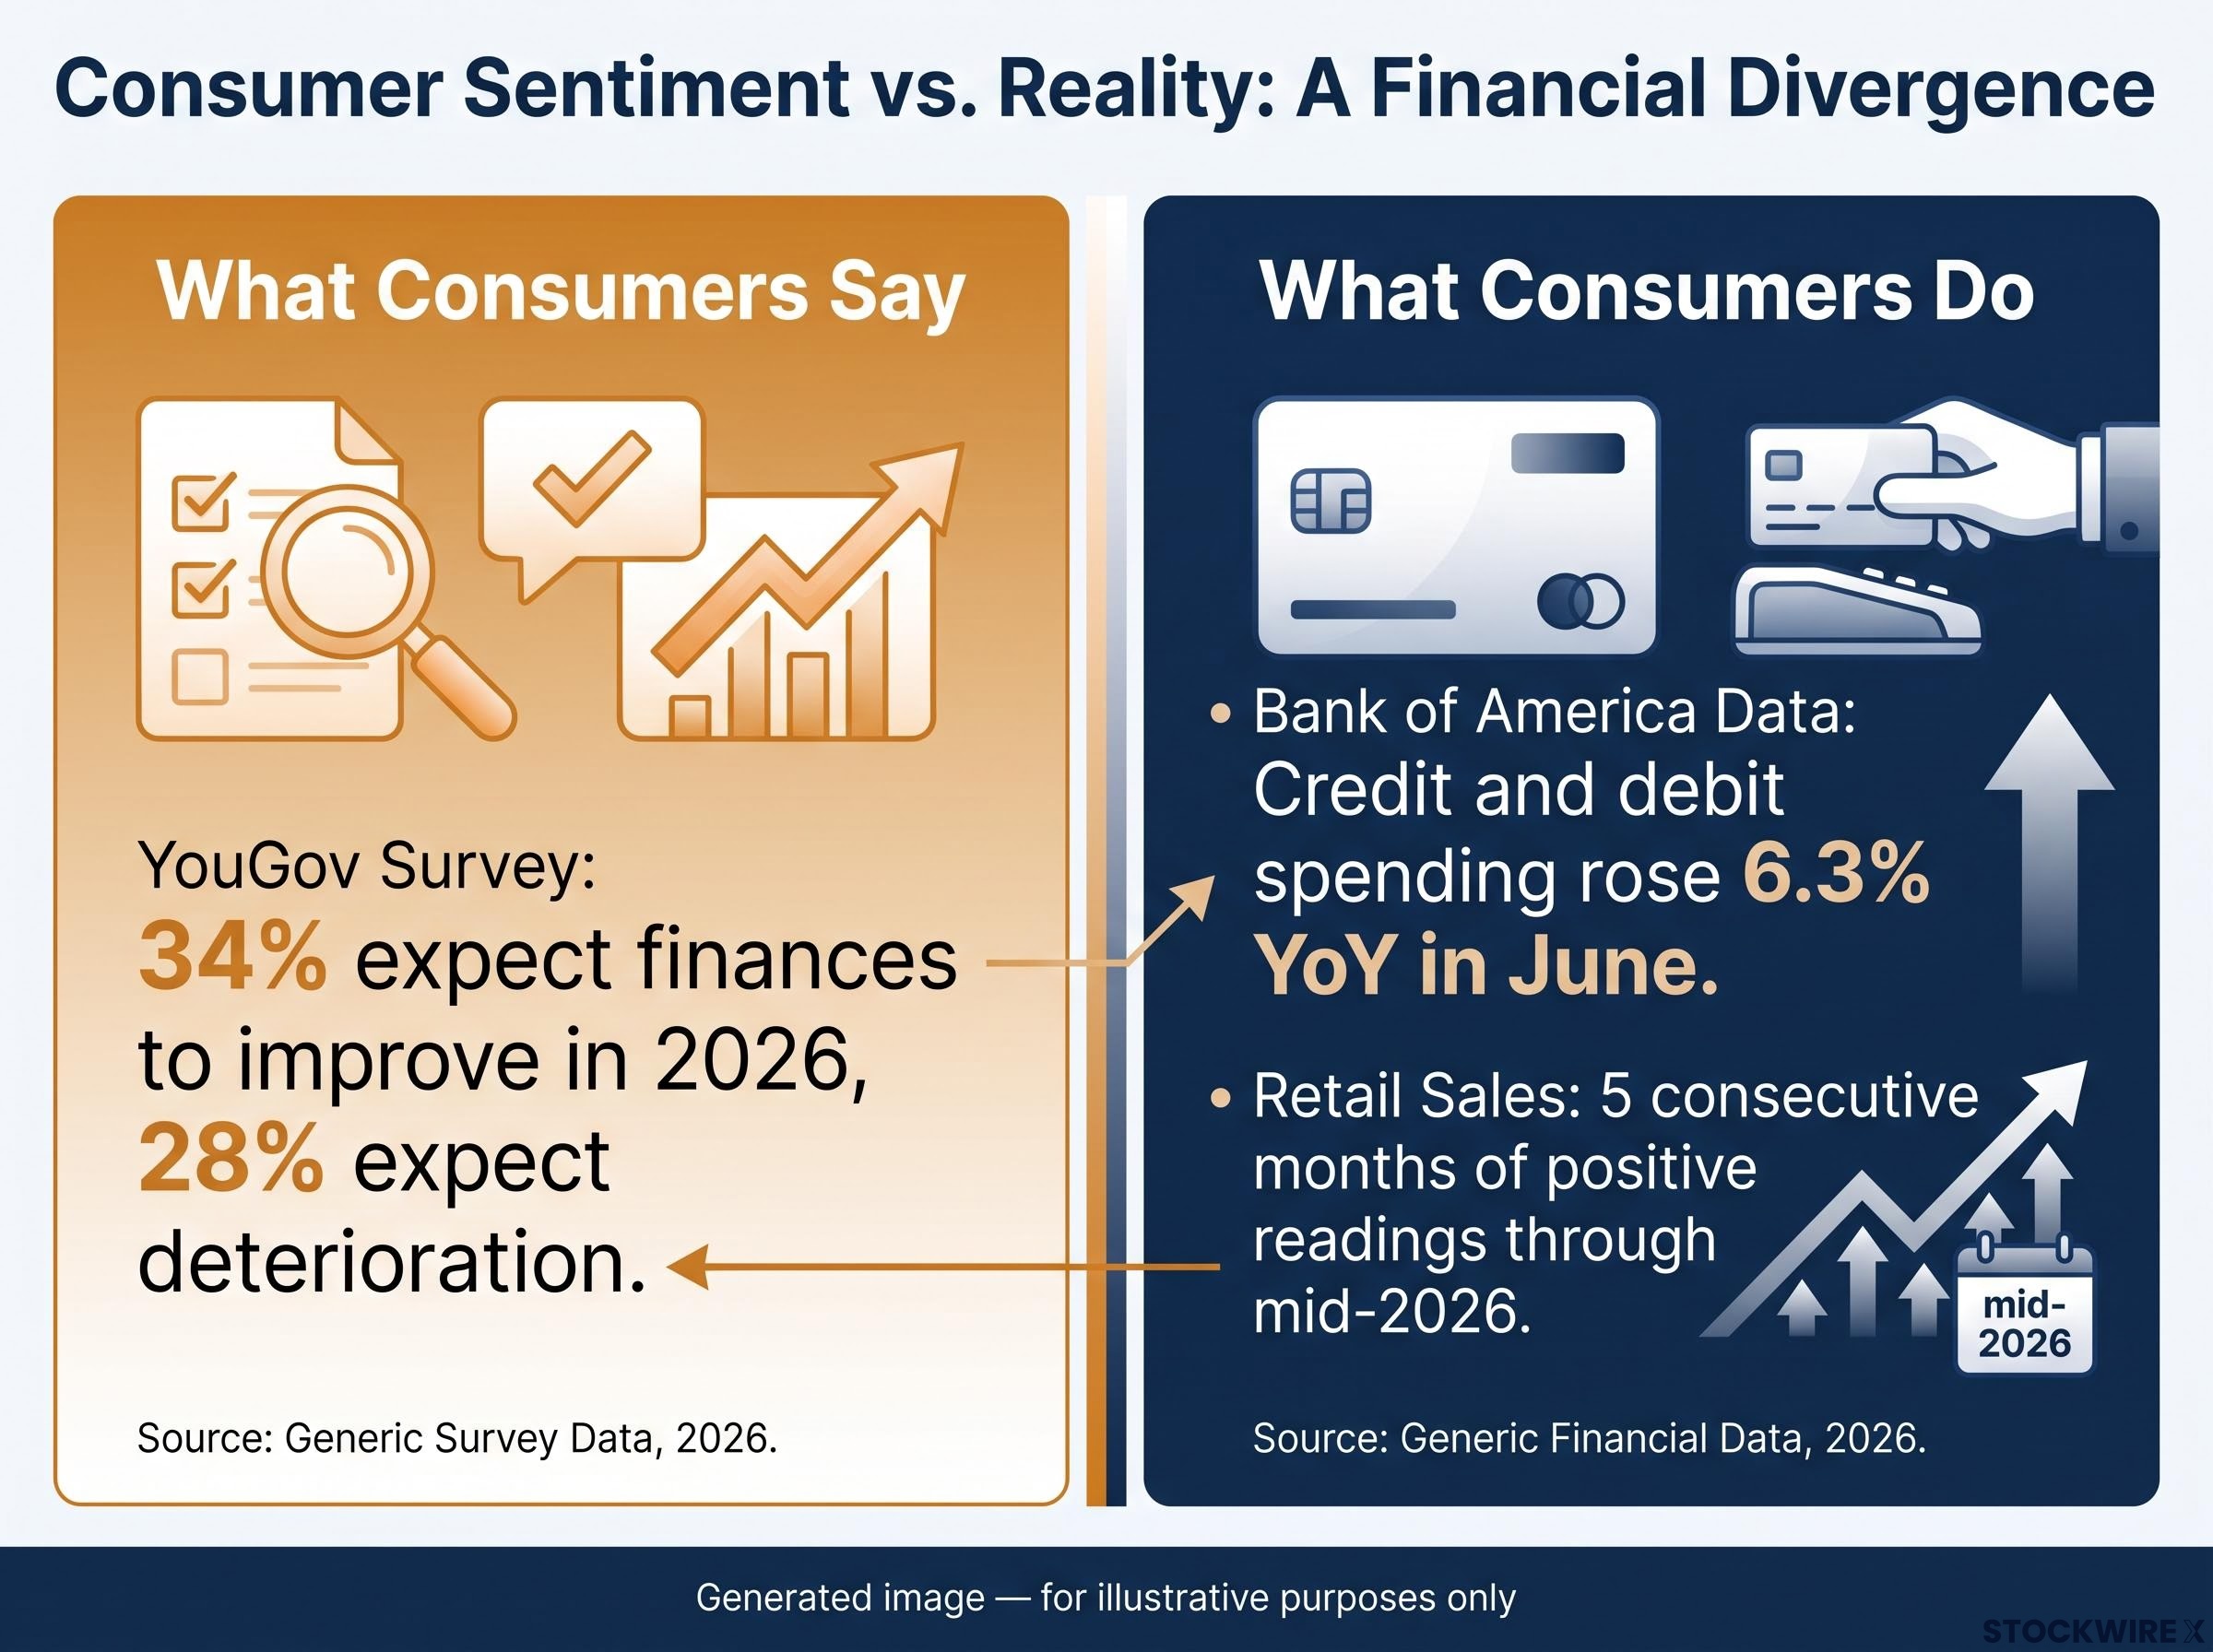
Consumer sentiment surveys paint a picture of an American household in retreat. The spending data tell a different story. Through mid-2026, retail sales have risen for five consecutive months, real personal consumption expenditures (PCE) have expanded in four of the last five months, and card-transaction data just posted their strongest year-over-year growth in more than four years.
That gap between perception and reality is not academic. The Federal Reserve reads these same signals when setting rate expectations. Equity valuations in consumer-facing sectors swing on whether the consumer is “weakening” or “resilient.” Credit conditions tighten or loosen based on how lenders interpret the demand picture. If you are making portfolio or business decisions in mid-2026, the interpretation you choose has direct financial consequences.
Here is a framework for reading consumer data the way analysts do, separating the noise in any single indicator from the signal in the full picture, so you can judge for yourself whether the spending story matches the headlines.
Why retail sales keep misleading people who should know better
Retail sales deserve their headline billing. The Census Bureau’s advance report lands early, moves markets, and covers a broad swath of goods consumption. Through June 2026, the numbers look constructive: a 0.2% month-over-month gain in June, a revised 1.0% increase in May, and five straight months of positive readings. Year-over-year, retail and food-services sales rose 6.4% in Q2. The control group measure, which strips out autos, gasoline, restaurants, and building materials and feeds directly into GDP estimates, climbed 0.5% in June with prior months revised higher.
But two structural features of this report consistently mislead readers who should know better.
First, retail sales are nominal. They are not adjusted for inflation. When prices rise, receipts rise with them, even if no additional units move off the shelf. A reader who treats a nominal increase as proof of expanding demand is confusing a price signal with a volume signal.
Second, retail sales cover only goods and food service. They exclude:
- Housing costs
- Healthcare spending
- Utilities
- Education expenses
These services categories constitute the majority of household expenditure. A metric that misses most of what households actually spend on cannot tell you whether the consumer is healthy or not.
The gasoline distortion hiding June’s true demand picture
June’s 0.2% headline was further suppressed by a mechanical effect. Lower pump prices compressed gas-station receipts, dragging the top-line number down. But those same lower prices freed up discretionary income, which showed up in other categories and in card-transaction data.
Bloomberg explicitly noted that lower gasoline prices mean June retail sales figures “understate the strength of demand.”
Strip out petrol stations and retail sales advanced 0.7% in June, on top of a 0.9% rise in May. Thirteen retail subindustries saw five contractions in June against only one in May, yet once the fuel-price effect is removed, the true demand reading was considerably more robust than the headline implied.
If you are using retail sales as your primary consumer gauge, you are almost certainly drawing the wrong conclusion about the direction of real demand, whether the headline looks strong or weak.
When big ASX news breaks, our subscribers know first
What real PCE actually tells you about consumer demand
Personal consumption expenditures, reported by the Bureau of Economic Analysis (BEA), correct for both of retail sales’ blind spots. PCE covers all personal consumption, including services-dominated categories such as housing, healthcare, and education. And the “real” version adjusts for inflation, giving you actual volume changes rather than nominal receipts.
The difference in signal quality is visible in the data.
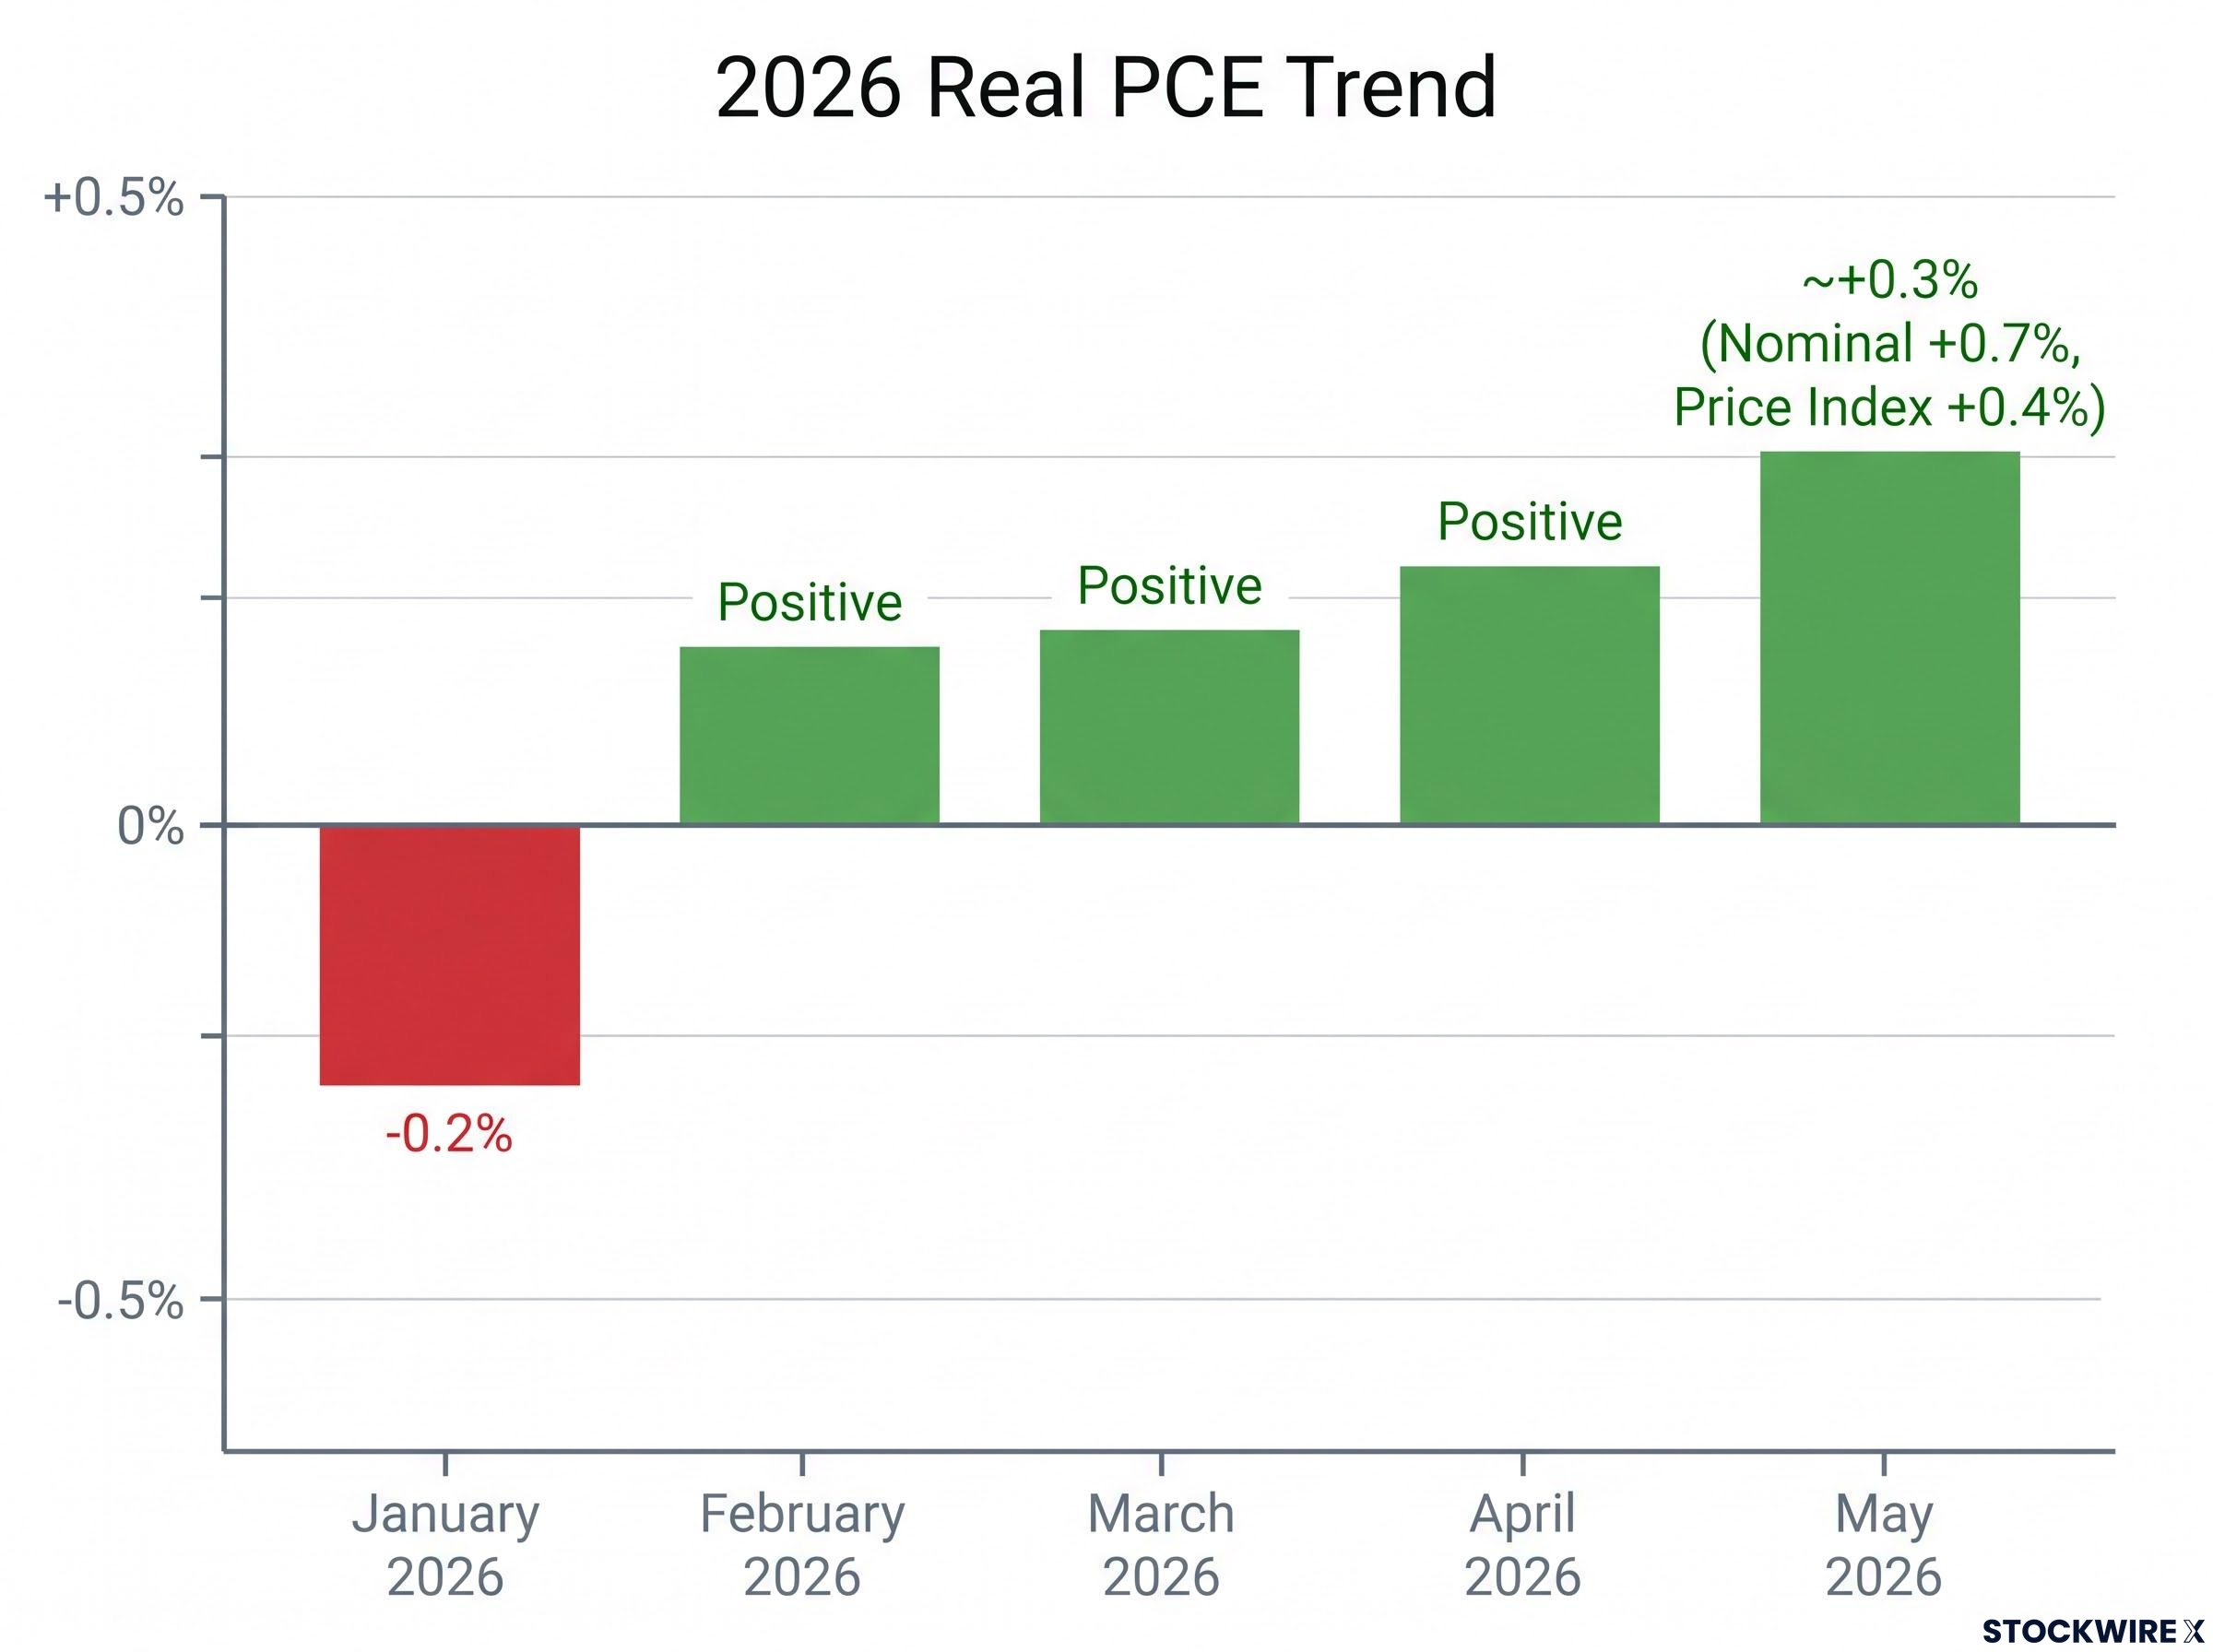
| Month (2026) | Nominal PCE Change | PCE Price Index Change | Implied Real PCE Change |
|---|---|---|---|
| January | — | — | -0.2% |
| February | — | — | Positive |
| March | — | — | Positive |
| April | — | — | Positive |
| May | +0.7% | +0.4% | ~+0.3% |
Across the February-to-May window, real PCE posted gains in every month without exception, with January’s 0.2% decline standing as the only negative reading in 2026. The May release, the latest available as of 24 July 2026, showed nominal PCE up 0.7% against a PCE price index increase of 0.4% (core prices up 0.3%), implying real consumption growth of roughly 0.3% in a single month.
The PCE price index rose 0.4% month-over-month in May 2026, with core prices up 0.3%, leaving the Federal Reserve 140 basis points above its 2% inflation target and with no basis to shift away from its restrictive stance, even as the real consumption figures beneath that inflation layer showed continued household spending strength.
Consumer spending represents over two-thirds of US GDP. A sustained string of monthly real PCE gains means the core engine of US economic growth is still running. Readers pricing recession risk or Fed pivot timing based on retail-sales headlines alone are working from an inferior data source. The June PCE release, scheduled for 30 July 2026, will be the next meaningful update.
How consumer sentiment got so far ahead of consumer behaviour
Start with the sentiment data and let the pessimism register.
- YouGov finds only 34% of US adults expect their finances to improve in 2026, while 28% expect deterioration
- McKinsey’s Q2 2026 report shows weakened sentiment and pull-back intentions across most discretionary categories, most pronounced at lower income levels
- The Federal Reserve’s July 2026 Beige Book indicates that consumers are still opening their wallets, though they are doing so more selectively, with mid- and lower-income households making more trade-offs and substitution choices than their higher-income counterparts
- Deloitte’s consumer-pulse data show erosion in financial confidence, though spending intentions have rebounded for three consecutive months into June
Those are not trivial findings. They describe a consumer who feels under pressure.
Now look at what that consumer actually did with their money. Bank of America card data show total credit and debit card spending rose 6.3% year-over-year in June, the strongest growth rate in over four years.
Bank of America characterised the June gains as “almost entirely a discretionary story.”
This is not a case of consumers grimly paying higher prices for essentials. Discretionary categories, the ones most sensitive to belt-tightening, drove the growth.
The psychological mechanism is straightforward. Sentiment surveys capture anxiety: how worried you feel, how uncertain the future looks. Card transactions capture revealed preference: what you actually did when the moment came to spend or not spend. These two instruments measure different psychological states. Using sentiment to predict aggregate spending behaviour consistently overstates the risk of a consumer-led slowdown.
Granger-causality research shows the consumer sentiment index reflects recent stock market movements rather than predicting them, meaning the survey readings that appear to signal a consumer-led slowdown are largely a lagging echo of equity market direction rather than an independent economic forecast.
That matters for positioning. Sentiment readings move asset prices in the short term. Knowing that they have historically been less reliable than card and PCE data as spending predictors helps you avoid being shaken out of positions by survey noise.
The income distribution story is more nuanced than headlines suggest
The K-shaped consumer narrative has staying power because it contains a genuine observation: roughly 40% of consumer spending is driven by the top 20% of income earners. Higher-income households are indeed carrying a disproportionate share of aggregate demand, and real consumer spending tracked approximately 2% growth in Q2, slightly below trend.
That much is accurate. What gets lost is the convergence happening underneath the headline.
Bank of America wage and card data show that lower-income after-tax wage growth rose above middle-income growth in June 2026. Spending “picked up steam across income groups,” with a meaningful share of growth coming from discretionary purchases by lower-income households. Lower gasoline prices played a direct role: because fuel expenditure consumes a larger share of lower-income budgets, price decreases free proportionally more spending capacity at the bottom of the income distribution than at the top.
Household credit card debt reaching a record $1.28 trillion in early 2026 complicates the income convergence story at the lower end of the distribution: wage growth rising above middle-income levels is a tailwind, but its net benefit depends on whether it is outpacing debt-service costs that have risen alongside it.
| Income Cohort | Spending Share Indicator | Mid-2026 Trend Direction |
|---|---|---|
| Top quintile | ~40% of total consumer spending | Sustained strength, wealth-effect supported |
| Middle cohorts | Moderate share | Stable; selective spending patterns |
| Lower-income households | Smaller but rising contribution | Wage growth accelerating; discretionary pickup |
What the convergence data actually signals
Lower gasoline prices have an asymmetric effect across income cohorts. A household spending 8-10% of its budget on fuel benefits proportionally more from a price drop than one spending 2-3%. That freed-up capacity is exactly what appeared in June’s card and retail data: lower-income discretionary spending running stronger than earlier sentiment surveys would have predicted.
TD Economics characterises the consumer environment as still K-shaped in structure, yet notes that aggregate spending has held up well and looks set to remain on solid footing through 2026, underpinned by more accommodative financial conditions, accumulated wealth gains, larger tax refunds, and an improving labour market backdrop.
The analytical distinction most often missed in coverage: evidence that high-income households spend more is not evidence that overall spending is falling. Both observations can be true simultaneously. If you have been avoiding consumer-facing equities because of K-shaped narratives, the convergence in wage and spending growth at the lower end represents a meaningful shift in the risk picture worth weighing.
A practical framework for reading consumer data the way analysts do
Four filters, applied consistently, will prevent most consumer-data misreads:
- Nominal versus real: Retail sales are nominal and goods-only. Real PCE is inflation-adjusted and economy-wide. Default to real PCE as your primary read. June’s retail sales headline of 0.2% versus the ex-gasoline figure of 0.7% and the control group’s 0.5% illustrates how distorted the nominal headline can be.
- Goods versus services: Retail sales capture a narrow slice of household expenditure. The majority flows through services categories (housing, healthcare, utilities) that are more inelastic and less visible in headline reporting. A retail-sales decline does not necessarily mean consumers are spending less overall.
- Anecdote versus aggregate: Individual stories of financial strain, such as skipping discretionary purchases to cover rising living costs or drawing down savings to meet everyday expenses, are real but not necessarily representative. Locate the anecdote in the aggregate data before treating it as a signal. Card spending up 6.3% year-over-year is the aggregate counterpoint.
- Distributional nuance versus direction: Data showing high-income households spend more is not proof that overall spending is falling. Always ask whether the distributional observation changes the direction of aggregate spending, not just its composition.
A reader who applies these four filters consistently will rarely be misled by a consumer-health headline, bearish or bullish, because they will know which questions to ask before accepting the conclusion. These filters are not unique to mid-2026; they apply to every consumer-spending news cycle.
What the mid-2026 data actually tell you about where this goes next
The base case is straightforward: aggregate US consumer spending through mid-2026 is resilient, with multiple data sources aligned in the same direction.
- Retail sales up five consecutive months, with the control group revised higher
- Real PCE positive in four of the last five months, with implied real gains of roughly 0.3% monthly in May
- Card spending at a four-year high, driven by discretionary categories
The Federal Reserve’s July 2026 Beige Book reported consumers continuing to spend, but with greater selectivity.
The genuine structural risks the data do not dismiss: the K-shaped divergence, while narrowing, is real. Lower- and middle-income households remain more exposed to any resurgence in inflation or deterioration in labour-market conditions. A renewed spike in energy prices would reverse the gasoline-driven budget relief that has supported spending convergence.
Savings depletion risk represents the most credible structural counter-argument to the resilience case: if aggregate spending is partly funded by drawing down household buffers rather than income growth, the sustainability of the current consumption trajectory is time-limited in ways that monthly flow data alone do not reveal.
TD Economics projects that total consumer spending will hold firm through the remainder of 2026, with supportive factors including more favourable financial conditions, household wealth accumulation, and a labour market that continues to stabilise. The next meaningful data checkpoint is the June PCE release on 30 July 2026.
The correct takeaway from the evidence available as of 24 July 2026 is resilience with concentration risk, not broad-based consumer breakdown. Readers positioned defensively based on consumer-weakness narratives should weigh whether the spending record actually supports that positioning, or whether they have been responding to sentiment rather than the data.
This article is for informational purposes only and should not be considered financial advice. Investors should conduct their own research and consult with financial professionals before making investment decisions. Past performance does not guarantee future results, and financial projections are subject to market conditions and various risk factors.