
Aristocrat’s Profit Is Surging, but Its Share Price Has Fallen 13%
33 mins ago


ANZ Banking Group’s net interest margin of 1.57% sits 21 basis points below the Big Four peer average. That gap is small in absolute terms, but in banking it separates the pack leader from the trailer on the metric that drives roughly 78% of the bank’s total income. With ANZ shares trading at approximately $35.12 as of late May 2026, retail investors comparing the Big Four face a familiar problem: four banks that superficially look identical, paying similar dividends, trading on similar multiples, regulated by the same APRA framework. The differentiation only emerges when the surface is stripped away and the numbers that govern long-run returns are compared directly.
What follows is a practical comparative framework built around four metrics: net interest margin (NIM), return on equity (ROE), Common Equity Tier 1 (CET1) capital adequacy, and workplace culture scores. Each metric reveals something specific about ANZ’s positioning, and together they form a composite picture of where the bank’s risk-reward profile sits relative to peers.
A bank’s core business is straightforward: borrow money cheaply, lend it out at a higher rate, and keep the spread. NIM measures how effectively that spread is captured. Three factors shape it:
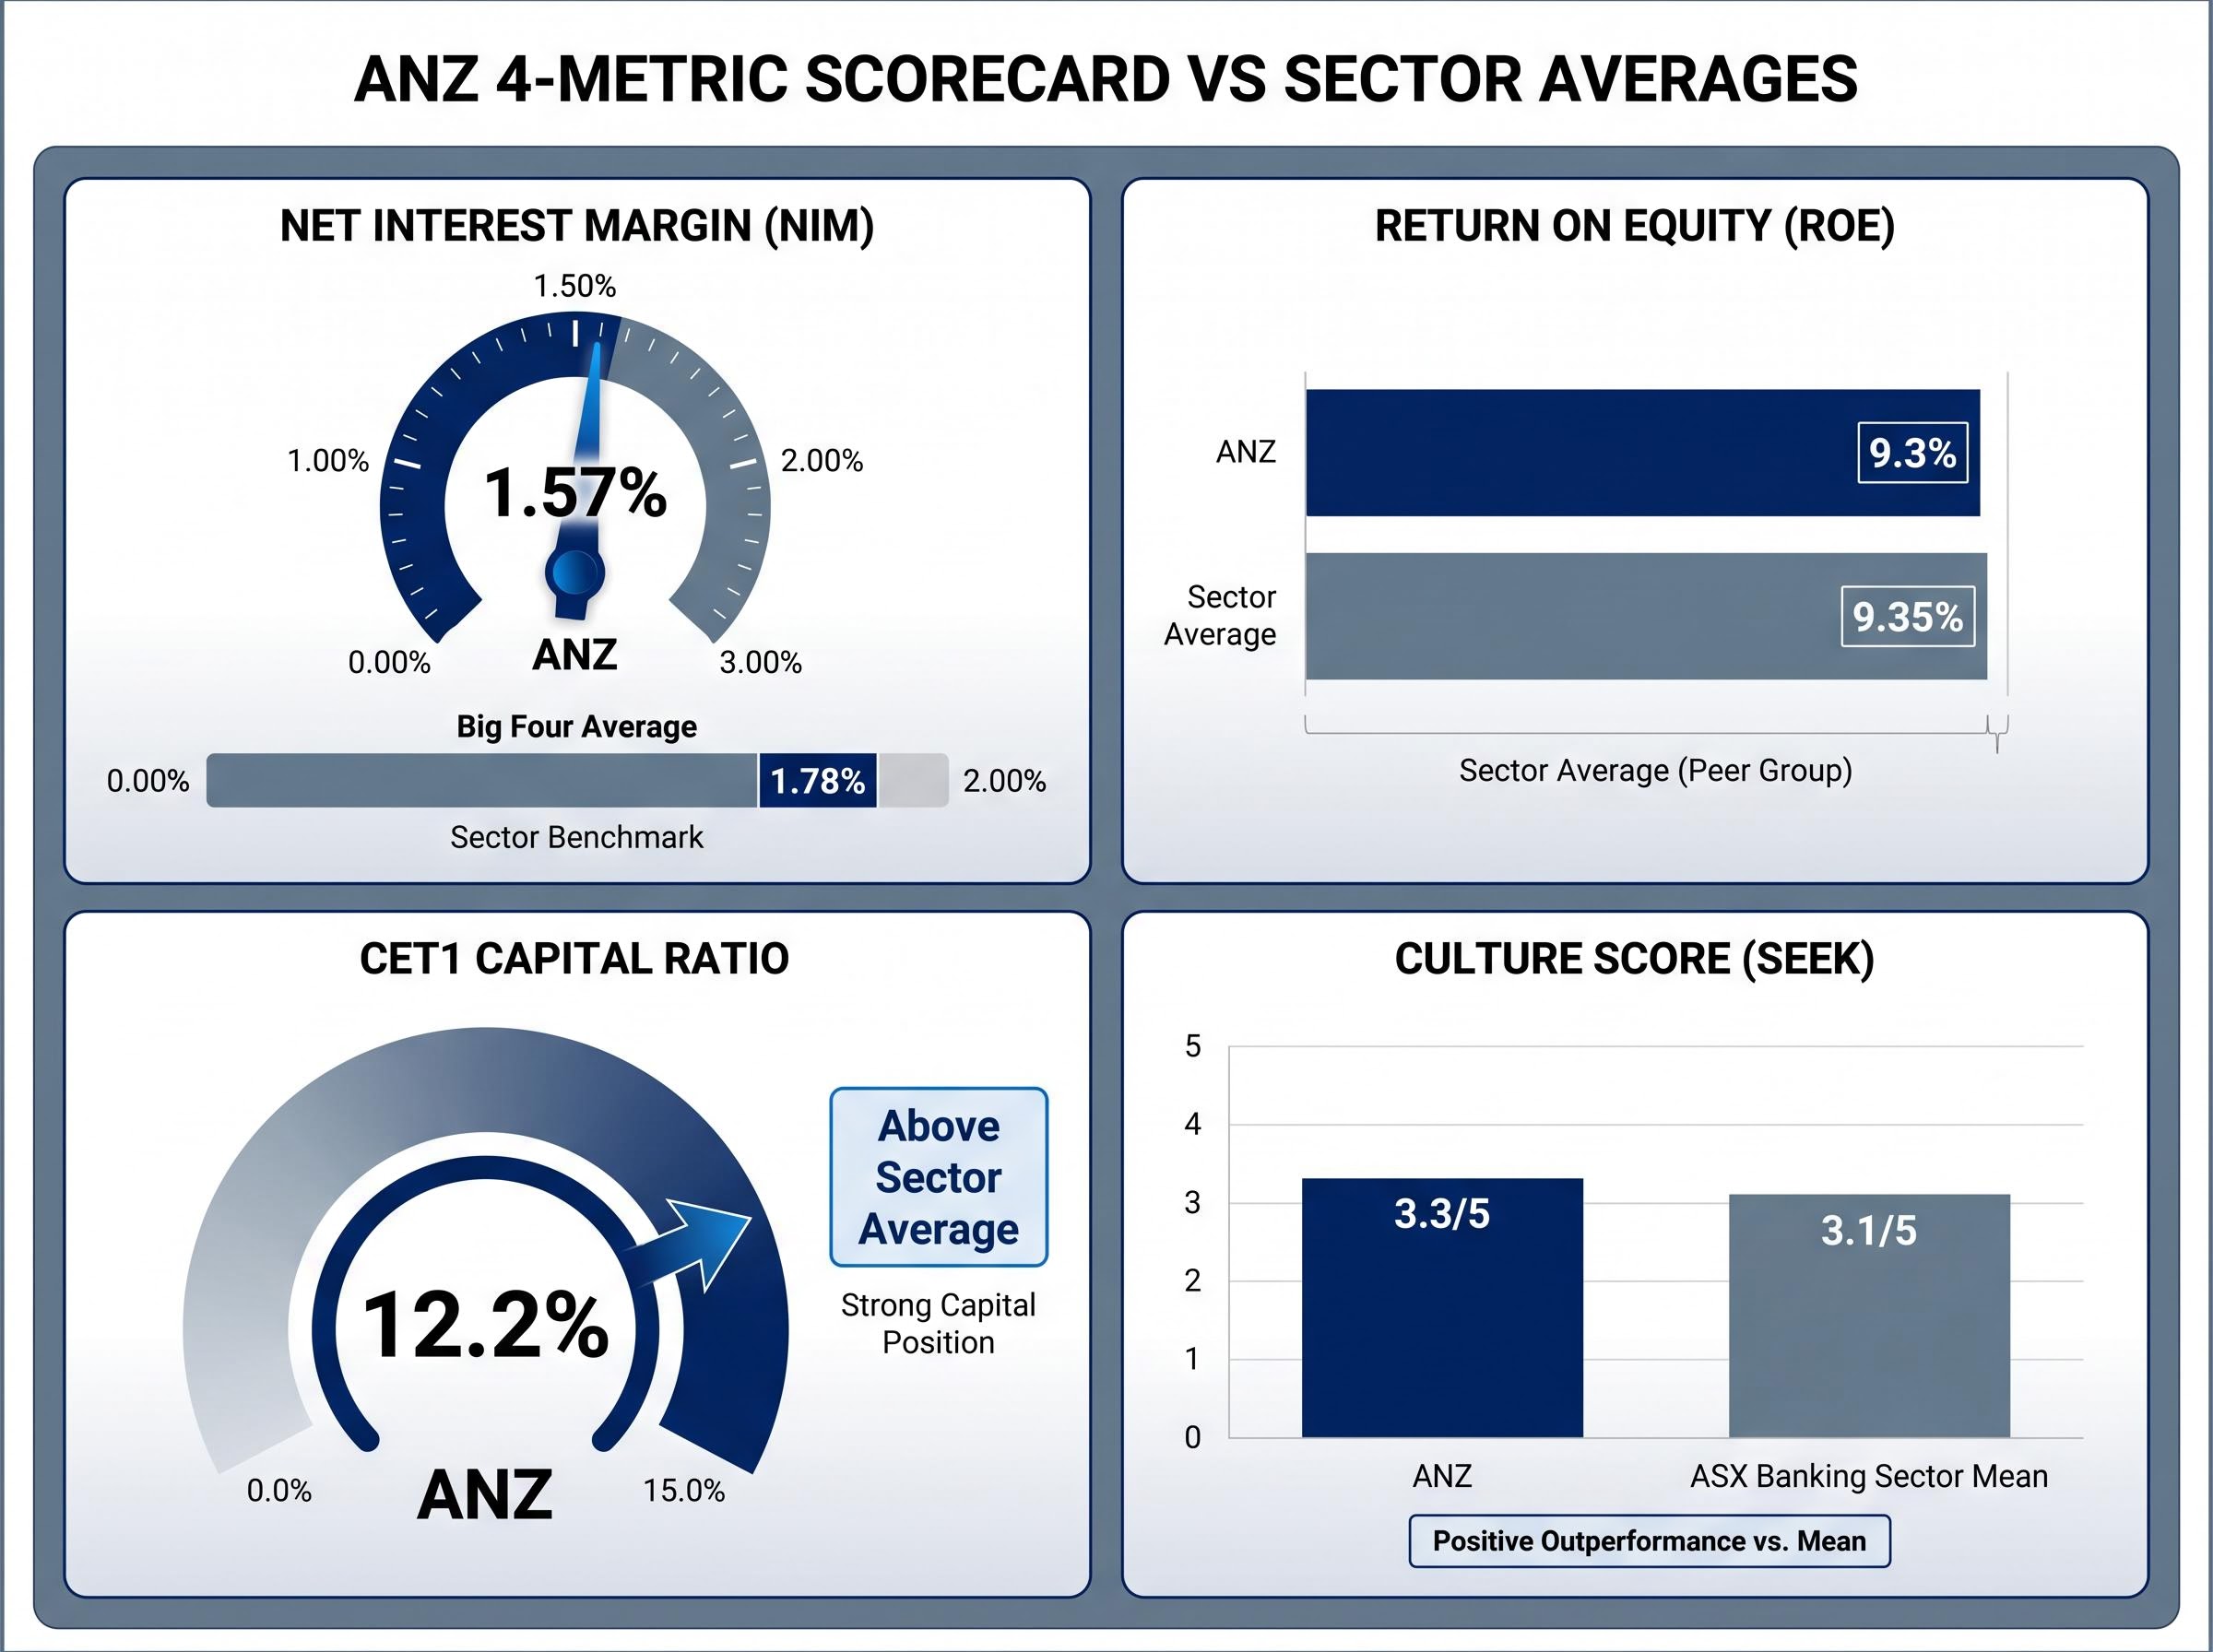
ANZ’s NIM of 1.57% falls 21 basis points short of the 1.78% Big Four peer average, according to Rask Invest calculations based on the most recently completed full financial year. That gap matters more than it might appear, because lending income accounts for approximately 78% of ANZ’s total revenue. A narrower spread on the activity that generates more than three-quarters of income compresses the entire earnings base.
NIM snapshot: ANZ at 1.57% versus the Big Four peer average of 1.78%, a 21 basis-point gap on the metric responsible for roughly 78% of ANZ’s revenue.
| Metric | ANZ | What it signals |
|---|---|---|
| Net interest margin | 1.57% | Below-average lending spread relative to peers |
| Big Four peer average NIM | 1.78% | Benchmark for competitive lending profitability |
This is not a one-quarter blip. A persistent NIM gap of this size means ANZ must compensate elsewhere, whether through fee income, cost discipline, or capital efficiency, to match peer returns.
NIM can be understood in three steps:
A bank with cheaper deposits or stronger pricing power on its loan book will carry a wider margin. A bank competing aggressively on mortgage rates, or relying more heavily on expensive wholesale funding, will see its NIM compress.
A 21 basis-point gap sounds modest until it is applied across the full scale of a major bank’s balance sheet. When lending income represents approximately 78% of total revenue, as it does for ANZ, every basis point of NIM feeds directly into the majority of the income statement.
At ANZ’s scale, even a single basis point of NIM improvement translates into millions of dollars of additional annual income before costs. The effect is amplified when the weakness persists across multiple reporting periods, because it compounds through retained earnings and constrains the capital available for dividends or reinvestment. Investors who understand this dynamic can assess whether ANZ’s NIM gap reflects structural factors (product mix, customer demographics, funding profile) or cyclical pressures that may ease over time.
NIM improvement and deposit outcomes are not always read as positive signals by markets, as NAB’s H1 2026 results illustrated when a 3 basis-point NIM expansion and a 6.4% underlying profit gain still produced a near-3% share price fall, a reminder that metrics move differently from market sentiment in short reporting windows.
Return on equity (ROE) measures annual profit as a percentage of shareholder equity, capturing how effectively a bank converts its capital base into earnings. CET1, or Common Equity Tier 1 ratio, measures the liquid capital buffer a bank holds against potential losses, expressed as a percentage of risk-weighted assets. APRA mandates minimum CET1 thresholds for all Australian authorised deposit-taking institutions.
APRA minimum CET1 thresholds set the regulatory floor that all Australian authorised deposit-taking institutions must maintain, and ANZ’s 12.2% ratio represents a meaningful buffer above those mandated minimums, a cushion that supports the bank’s capacity to absorb credit losses without triggering regulatory intervention.
These two metrics pull in opposite directions. Higher CET1 signals resilience in a stress scenario, but it also means more capital sitting in reserve rather than being deployed to generate returns. That trade-off is visible in ANZ’s numbers.
| Metric | ANZ | Peer average |
|---|---|---|
| Net interest margin | 1.57% | 1.78% |
| Return on equity | 9.3% | 9.35% |
| CET1 capital ratio | 12.2% | Below ANZ |
ANZ’s ROE of 9.3% lands within 5 basis points of the 9.35% sector average, according to Rask Invest calculations. Near-parity on ROE might suggest a bank performing in line with peers. But its CET1 of 12.2%, which sits above the sector average, complicates that reading.
A bank holding more capital in reserve will, all else being equal, generate a lower return on equity. ANZ’s above-average CET1 buffers shareholders against downside risk while constraining upside profitability.
For conservative, long-horizon investors, the elevated CET1 may represent a feature rather than a flaw. For those prioritising ROE-driven capital growth, it raises a question: is that capital buffer being deployed with sufficient discipline, or is it a drag on shareholder returns?
ANZ’s workplace culture score stands at 3.3 out of 5 on the Seek platform, based on the most recent available data as of May 2026. The ASX banking sector mean sits at 3.1 out of 5, according to Rask Invest calculations. A 0.2-point lead is modest, but culture scores deserve a place in a long-term bank assessment for reasons that extend beyond sentiment.
Three factors connect culture quality to financial outcomes:
Employee review platform data carries acknowledged limitations, including self-selection bias and the snapshot nature of aggregated scores. Culture scores are not a substitute for NIM, ROE, or CET1 analysis.
Their value lies in a different time horizon. For investors with holding periods of five years or more, culture is a leading indicator of the human capital quality that generates financial results. The effects are slow-moving and unlikely to influence a quarterly earnings print. Over multiple years, however, a bank that consistently attracts and retains higher-calibre staff compounds that advantage through better lending decisions, fewer risk events, and more durable client franchises.
The emphasis on qualitative factors in bank valuation reflects a broader shift in how analysts approach the sector: with the Big Four clustered in a narrow valuation band in May 2026, metrics like NIM trajectory, regulatory exposure, and management culture have become the primary differentiators of long-run relative returns rather than headline price-to-earnings ratios.
A dividend discount model (DDM) values a stock by discounting its expected future dividends back to a present value. For a stable, mature dividend payer like ANZ, the DDM offers a structured framework for assessing fair value, though its output is only as reliable as the assumptions feeding it.
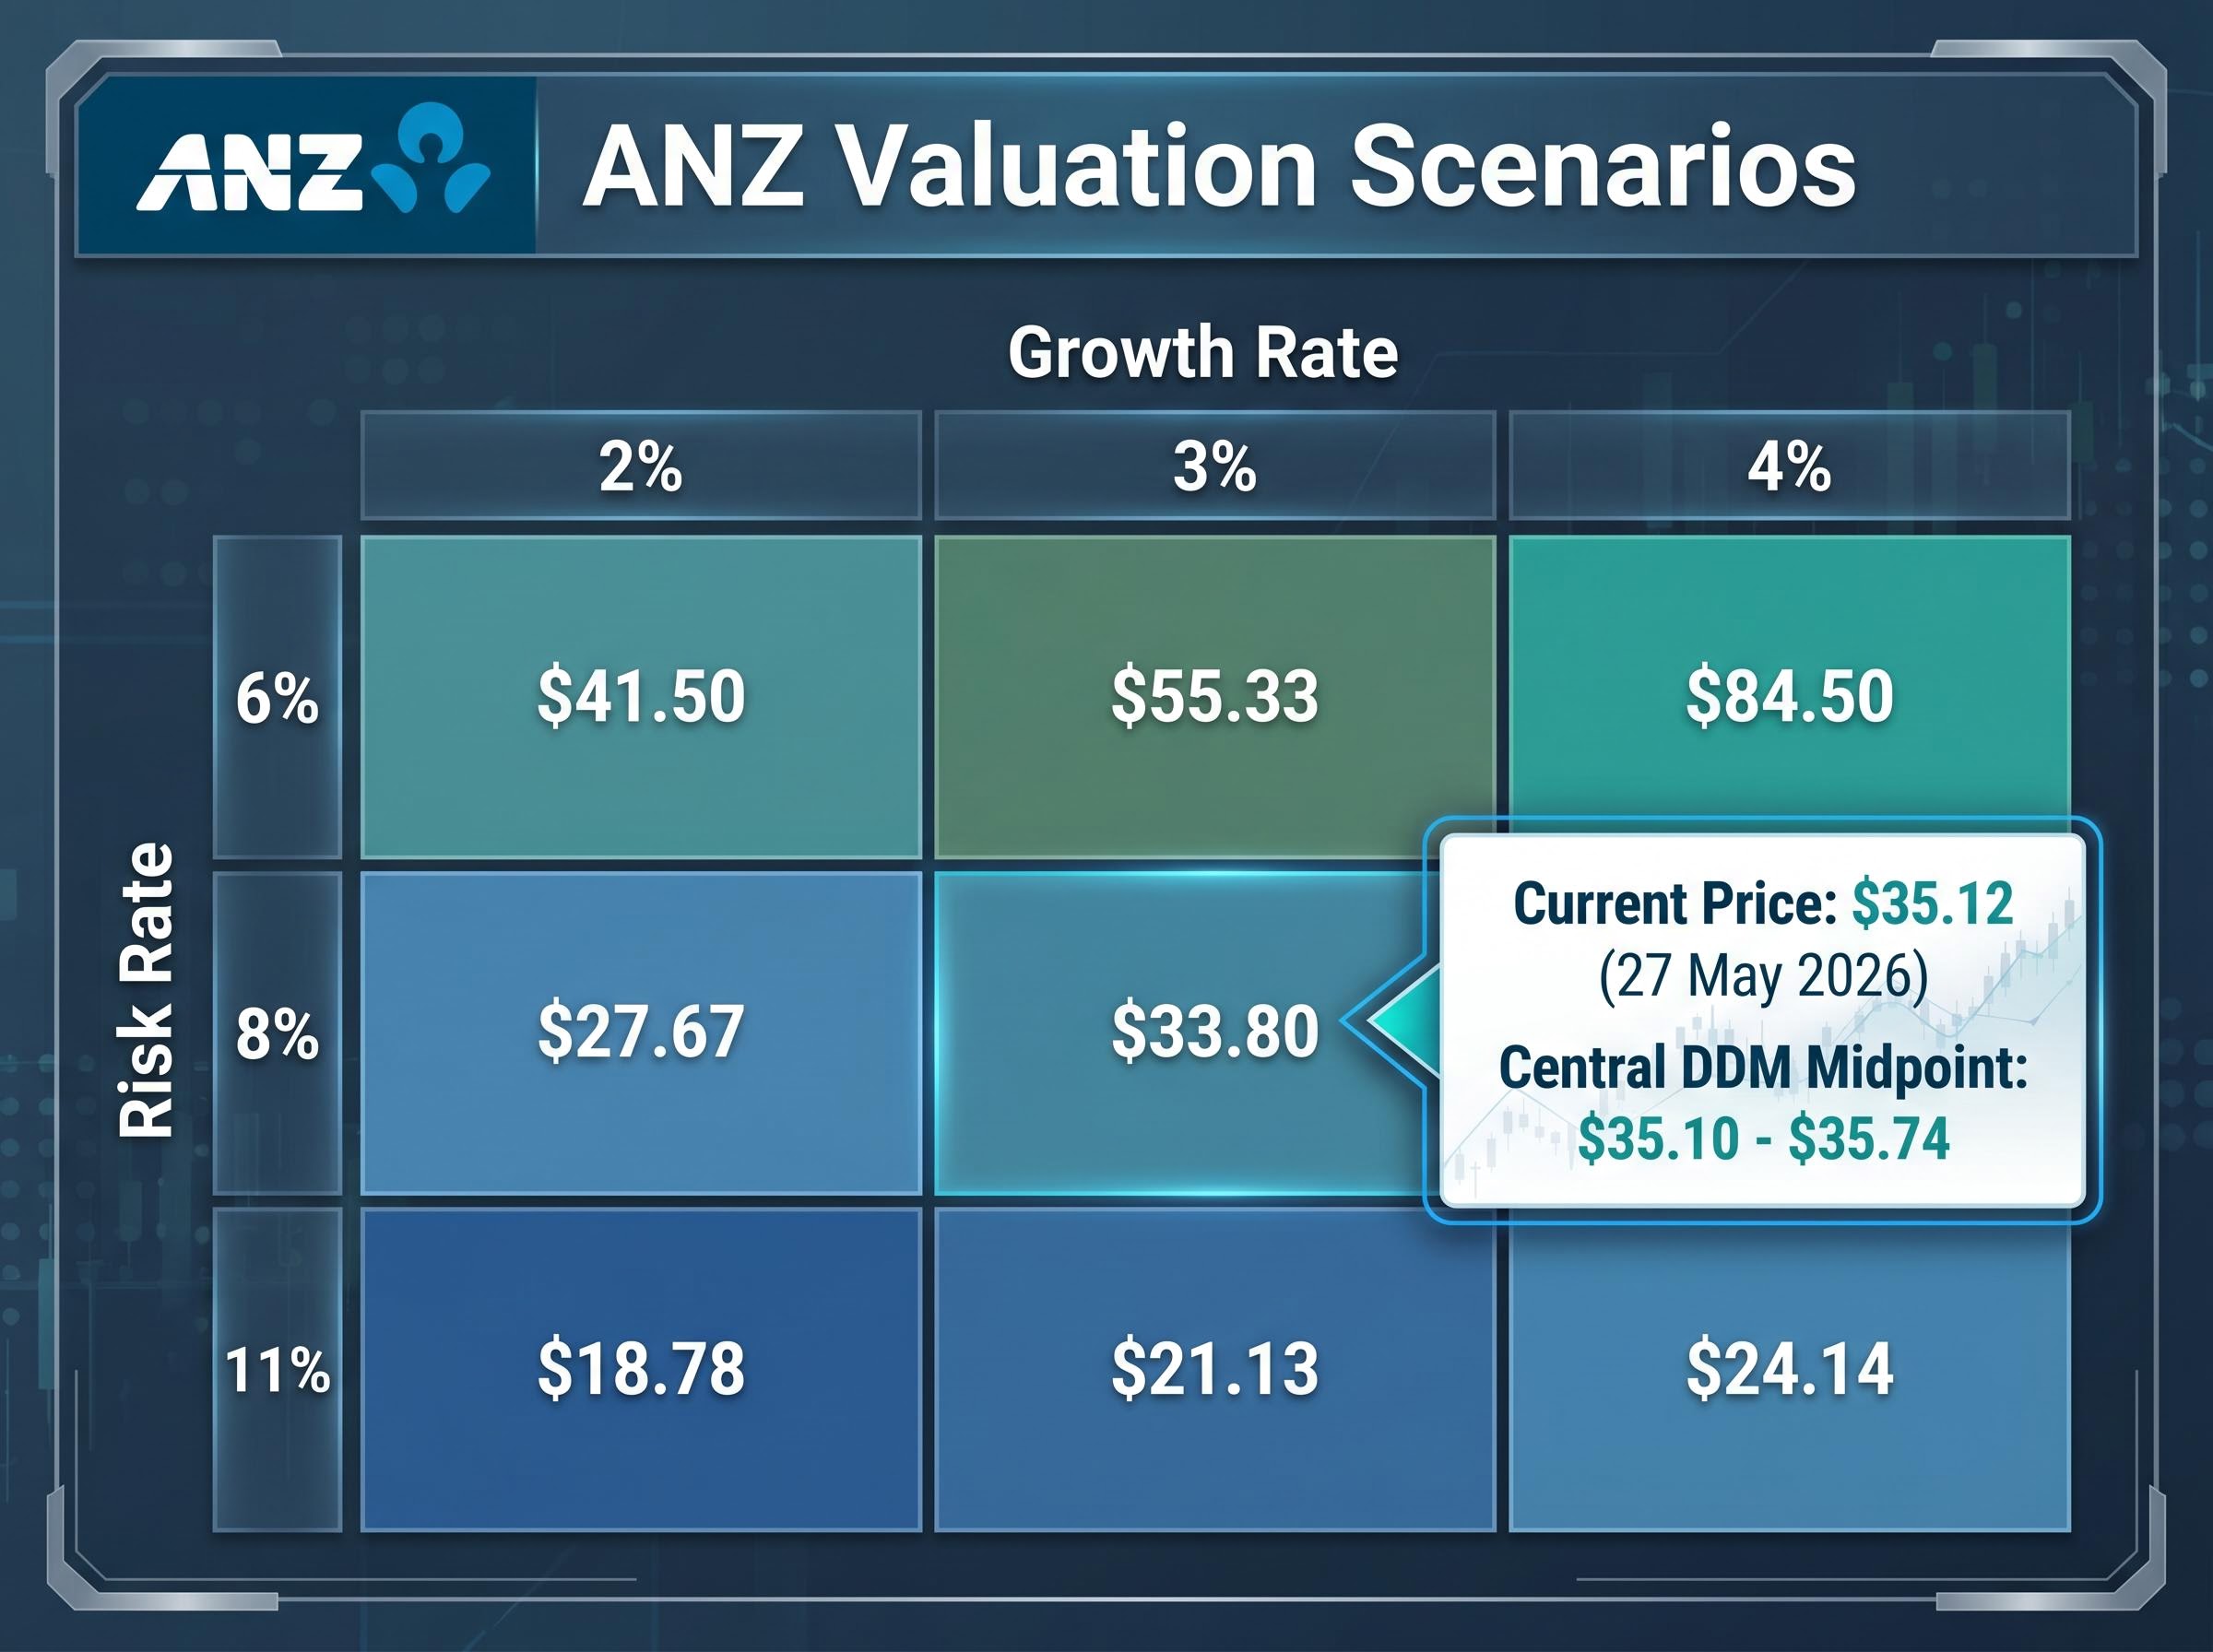
ANZ reported a full-year dividend of $1.66 per share in its most recently completed financial year, with an adjusted forecast dividend of $1.69 per share, according to Rask Invest. Applying dividend growth assumptions of 2% to 4% against risk-rate assumptions of 6% to 11% produces a wide scenario range.
| Risk rate | 2% growth | 3% growth | 4% growth |
|---|---|---|---|
| 6% | $41.50 | $55.33 | $84.50 |
| 8% | $27.67 | $33.80 | $42.25 |
| 11% | $18.78 | $21.13 | $24.14 |
The full range spans approximately $18.78 to $84.50 per share. That width is not a flaw in the model; it reflects the reality that small changes in long-run growth and discount rate assumptions produce dramatically different valuations.
The central DDM average narrows to approximately $35.10 (based on the reported dividend) and $35.74 (based on the forecast dividend). ANZ traded at $35.12 as at 27 May 2026, placing the current price almost exactly at the model’s midpoint.
At current levels, the DDM suggests ANZ is trading close to fair value under consensus-range assumptions. Meaningful upside would require either faster dividend growth than the 2%-4% range or a compression in the risk rate below 8%. Franking credits, which effectively boost after-tax dividend returns for eligible Australian shareholders, add a layer of value not fully captured in the base DDM output.
Past performance does not guarantee future results. Financial projections are subject to market conditions and various risk factors.
The four metrics assemble into a coherent profile. ANZ carries above-average capital strength and a culture edge over sector peers, but trails on the lending profitability metric that generates the bulk of its income.
ANZ strengths:
ANZ watchpoints:
With the DDM central estimate of approximately $35.10 to $35.74 and a share price of $35.12 as at 27 May 2026, the valuation offers limited near-term margin on either side.
This profile may suit long-horizon, income-focused, conservative investors who value capital resilience and are willing to accept a modest lending profitability discount. For investors prioritising above-average ROE or capital growth, the NIM gap remains the central unresolved question: whether it reflects structural characteristics of ANZ’s loan book and funding mix, or whether management action can narrow it over time.
An income comparison across the Big Four using grossed-up yields and franking adjustments produces a different ranking than raw dividend yields alone, with ANZ’s confirmed yield of 4.58% and lowest P/E among the three banks where data is available positioning it as the strongest contrarian income candidate in late April 2026, even as all four banks posted their steepest weekly declines of the year.
The four-metric framework applied to ANZ in this analysis is not ANZ-specific. The same structure applies with equal validity to Commonwealth Bank of Australia, Westpac Banking Corporation, or National Australia Bank. The steps are repeatable:
CET1 and culture scores across bank tiers diverge sharply when the comparison moves beyond the Big Four, with Bank of Queensland’s CET1 of 10.7% and Seek culture score of 2.6 sitting well below the major bank averages that ANZ’s numbers are benchmarked against in this analysis, illustrating how the same four-metric framework produces materially different risk profiles at the regional bank level.
Primary sources matter more than any single analysis. APRA’s monthly ADI statistics provide the most current sector-wide capital and NIM data. ANZ investor relations and ASX announcements remain the authoritative source for results data. All figures in this article are drawn from Rask Invest Research Team calculations based on the most recently completed full financial year prior to May 2026.
The DDM’s limitation deserves a final note: its output shifts materially with even small changes in dividend growth and risk-rate assumptions. Those assumptions deserve regular revisiting as the macro environment evolves. A framework held loosely, refreshed often, and grounded in primary data will serve investors better than any single valuation snapshot.
This article is for informational purposes only and should not be considered financial advice. Investors should conduct their own research and consult with financial professionals before making investment decisions.
Net interest margin (NIM) is the difference between the interest rate a bank earns on loans and the rate it pays on deposits and wholesale funding, expressed as a percentage of earning assets. ANZ's NIM of 1.57% sits 21 basis points below the Big Four peer average of 1.78%, which matters because lending income accounts for approximately 78% of ANZ's total revenue.
ANZ holds a CET1 (Common Equity Tier 1) ratio of 12.2%, which sits above the Big Four sector average, providing a buffer against credit losses and stress scenarios. The trade-off is that holding more capital in reserve constrains return on equity, with ANZ's ROE of 9.3% sitting fractionally below the sector average of 9.35%.
Applying dividend growth assumptions of 2%-4% and risk-rate assumptions of 6%-11% to ANZ's forecast dividend of $1.69 per share produces a central DDM estimate of approximately $35.10-$35.74, placing ANZ's share price of $35.12 as at 27 May 2026 almost exactly at the model's midpoint and suggesting fair value under consensus-range assumptions.
A four-metric framework covers net interest margin (lending profitability), return on equity (capital efficiency), CET1 ratio (regulatory buffer versus peers), and workplace culture score (long-run human capital quality). Applying the same four steps to Commonwealth Bank, Westpac, NAB, and ANZ allows a direct, like-for-like comparison across the metrics that drive long-run returns.
ANZ holds a workplace culture score of 3.3 out of 5 on the Seek platform, modestly above the ASX banking sector mean of 3.1. Analysts include culture scores in long-horizon bank assessments because staff retention and engagement are leading indicators of lending decision quality, compliance consistency, and client franchise durability over periods of five years or more.