
Why a BoJ Rate Hike Hasn’t Stopped the Yen Carry Trade
4 hrs ago

National Australia Bank shares dropped nearly 3% on 5 May 2026, the day after its half-year results landed. The headline profit number looked solid. So why did the market sell off? The answer sits inside three numbers that most investors scroll past: return on equity (ROE), net interest margin (NIM), and Common Equity Tier 1 (CET1) capital ratio.
NAB’s 1H26 results (half-year to 31 March 2026) delivered underlying profit growth of 6.4% and a fully franked 85 cent interim dividend. Yet the share price closed at $38.36, down from $39.51 the prior session. Understanding why requires knowing how analysts actually read a bank’s financial health, and which metrics carry the most weight in their assessment. This article uses NAB’s freshest publicly available numbers as a live case study to explain the three metrics every analyst reaches for first when evaluating an ASX bank. By the end, readers will be able to open any Big Four results release and know exactly what to look at, what the numbers mean, and how to benchmark one bank against another.
For a manufacturer or a technology company, analysts start with cash flow, EBIT, and revenue growth. For a bank, those metrics tell only part of the story. The difference is structural: a bank’s balance sheet is not merely a record of what it owns and owes. It is the business model itself.
Consider what separates the two:
NAB carries a market capitalisation of approximately $118 billion as of 9 May 2026. It holds $804.2 billion in gross lending assets. Lending income accounts for approximately 81% of total revenue. These proportions make the three metrics that follow not just useful, but necessary.
The Big Four rally in 2026 added further complexity to this picture: the ASX 200 Financials sector gained 8.87% year to date through late April, yet analyst price targets across three of the four banks implied material downside, creating a gap between price momentum and the underlying metrics that drive sustainable returns.
NAB’s primary revenue engine is the spread between what it pays depositors and what it charges borrowers. That spread, applied across $804.2 billion in gross lending assets, means even a 1 basis point movement in margin has material dollar consequences for profitability. This is why margin metrics dominate analyst attention, and why standard earnings ratios alone cannot capture the quality of a bank’s result.
ROE answers an intuitive question: how hard is shareholder money working? It measures the profit a bank generates per dollar of shareholders’ equity, expressed as a percentage. A bank with a 12% ROE is producing $12 in profit for every $100 of equity on its books.
NAB’s 1H26 results, however, reported two ROE figures. The cash ROE on continuing operations came in at 8.5%. The cash ROE excluding large notable items came in at 11.6%. The gap between those two numbers reflects the impact of one-off charges (large notable items) that distorted the headline figure but do not reflect the bank’s underlying earnings capacity.
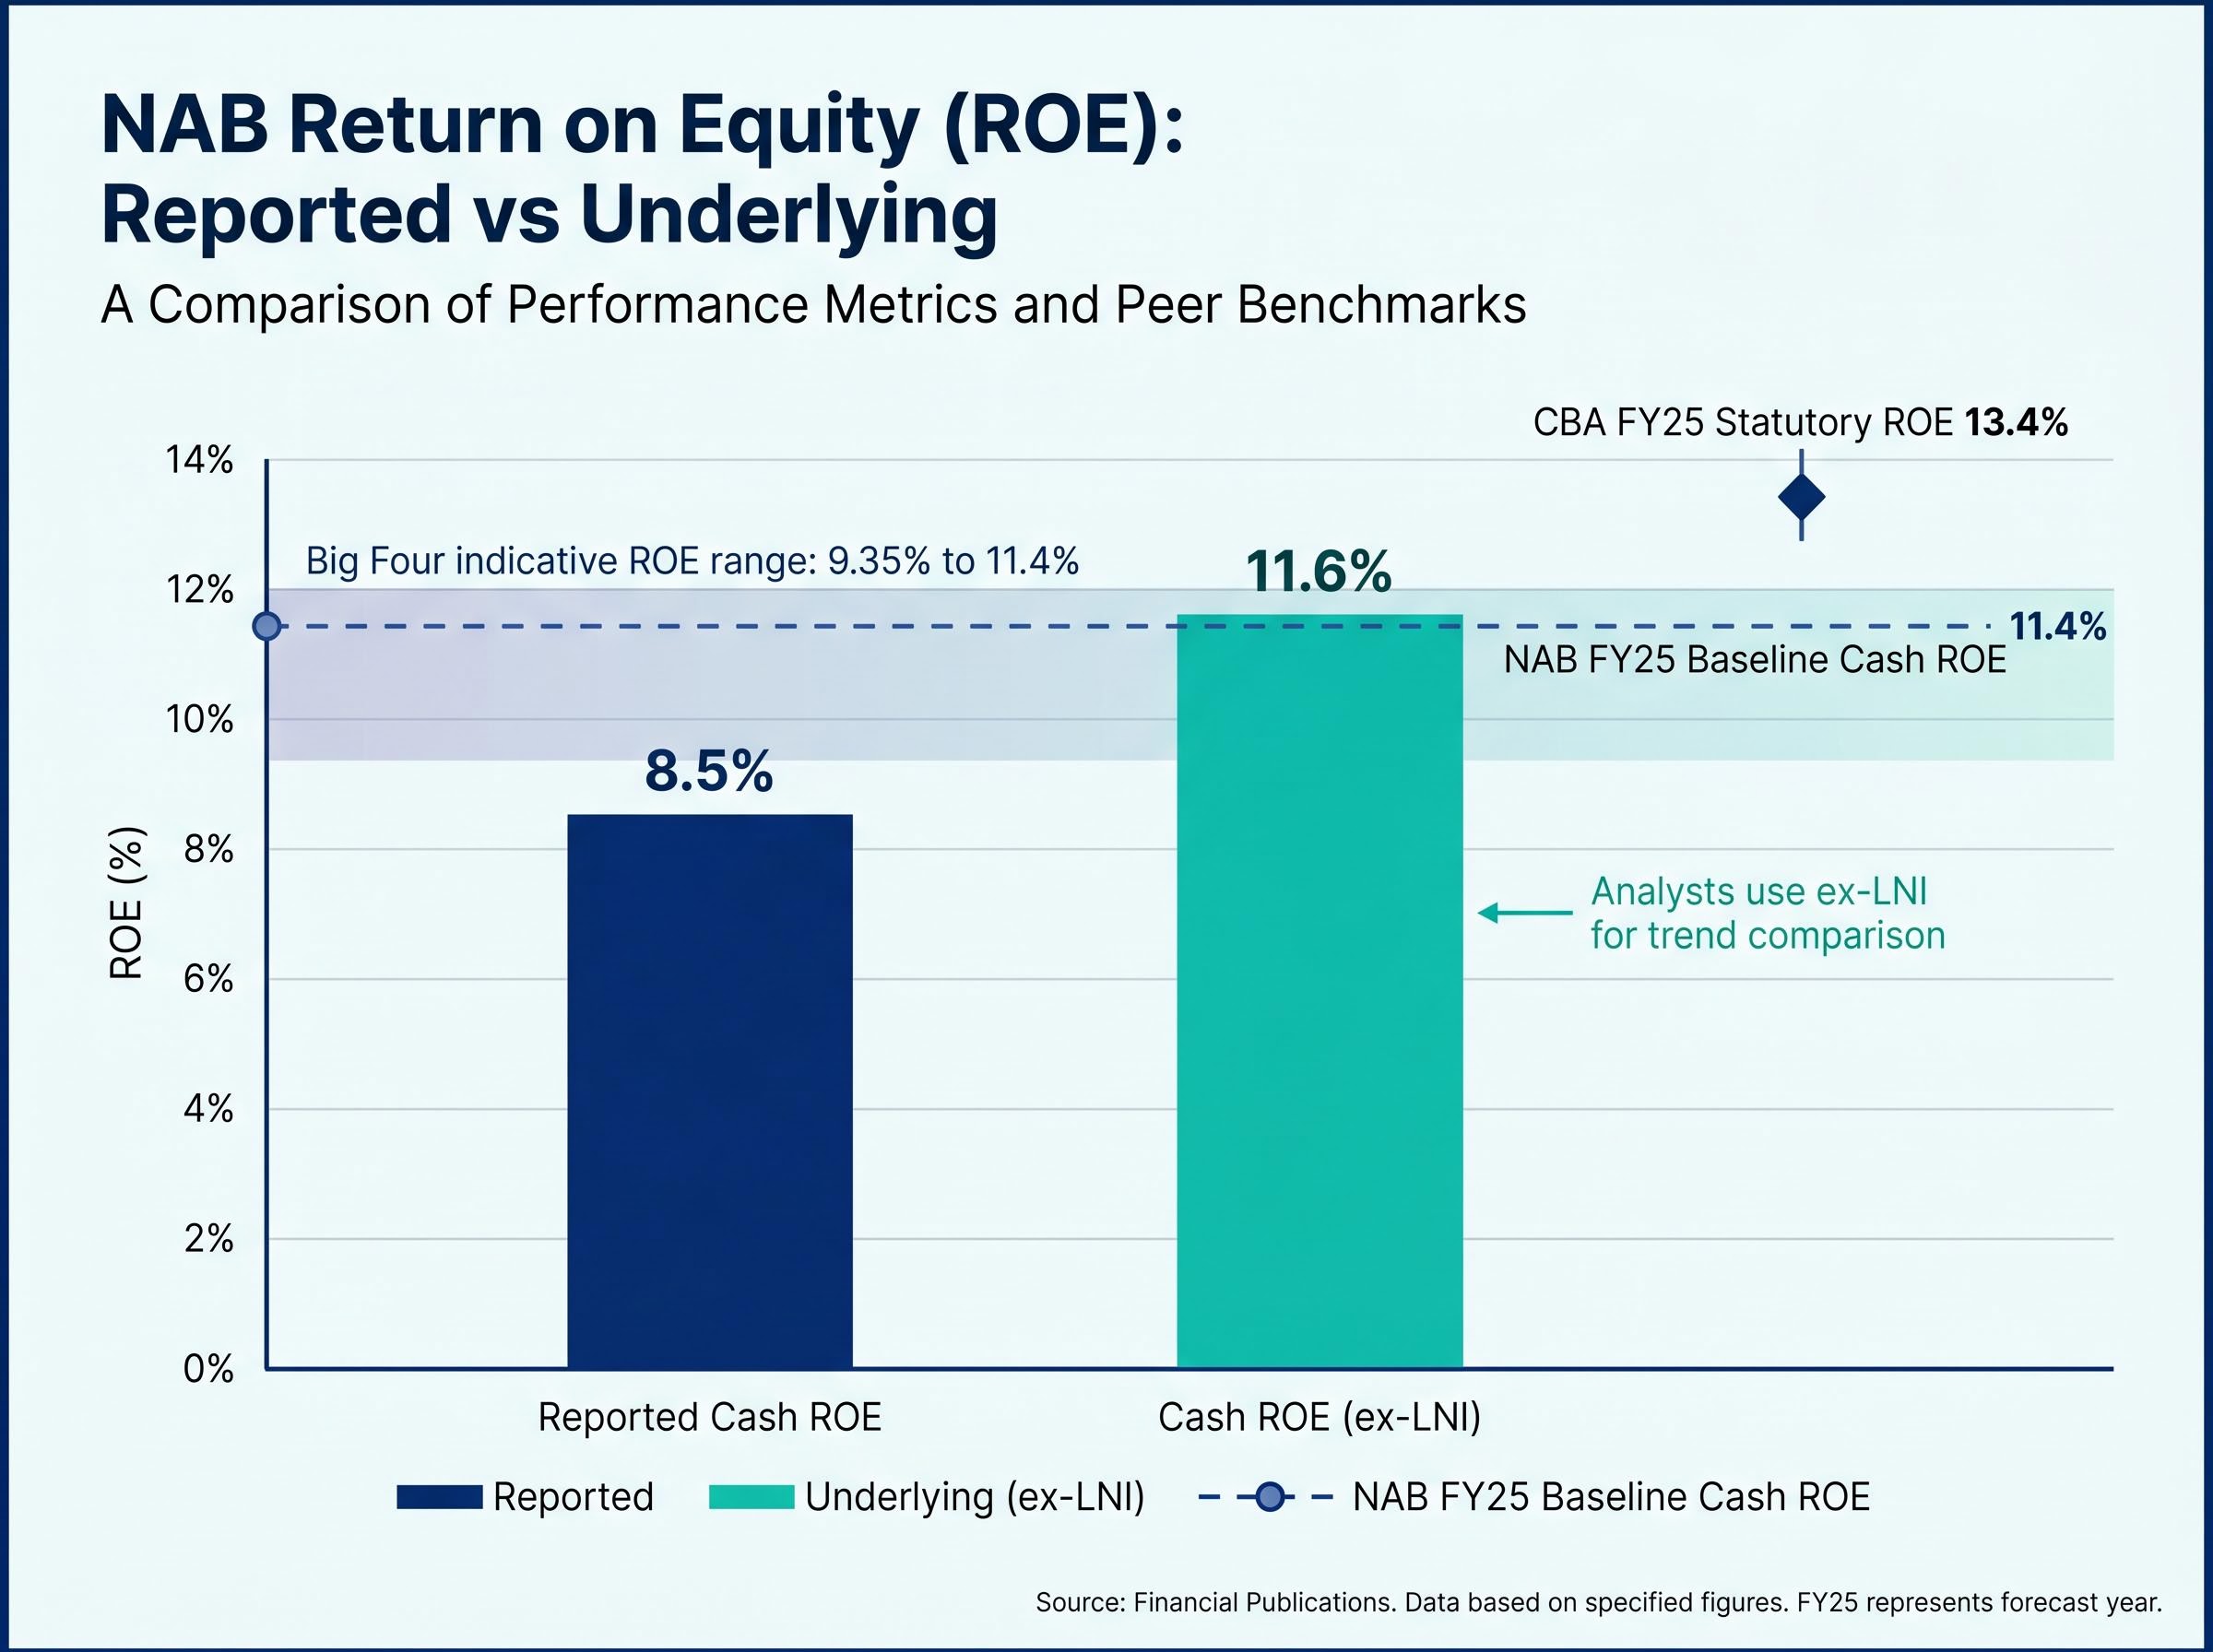
“For every $100 of equity, NAB’s underlying business generated $11.60 in profit in the first half of 2026, annualised on an ex-notable items basis.”
The 11.6% ex-LNI figure represents an improvement from NAB’s FY25 baseline cash ROE of 11.4%. For peer context, CBA reported a statutory ROE of 13.4% for FY25, while the broader Big Four ROE range sat between approximately 9.35% and 11.4% on an indicative basis. NAB’s underlying figure places it in the upper half of that range, though still trailing CBA’s premium returns.
Three components can cause ROE to move:
Knowing which NAB ROE figure to reference, and why, prevents investors from either overstating or understating the bank’s underlying earnings quality. The ex-LNI figure is the one most analysts use for trend comparison.
NIM measures the difference between the interest rate a bank earns on its loans and the rate it pays on its deposits, expressed as a percentage of earning assets. It is the single metric most directly tied to a bank’s ongoing revenue trajectory.
NAB reported a 1H26 NIM of 1.81%, up 3 basis points from the second half of FY25. The improvement was driven by what NAB described as improved deposit outcomes, with the margin stable when excluding markets and treasury operations and liquid assets.
For context, Westpac reported a FY25 NIM of 1.94%, a 13 basis point premium over NAB’s latest figure. The table below places NAB’s NIM alongside available peer data.
| Bank | NIM | Period | Notes |
|---|---|---|---|
| NAB | 1.81% | 1H26 (to 31 March 2026) | Verified; up 3bps vs 2H25 |
| Westpac | 1.94% | FY25 | Verified |
| CBA | Not confirmed | FY25 | Previously cited as 2.00%; treat with caution |
| ANZ | Not confirmed | FY25 | Previously cited as 1.65%; treat with caution |
With lending income accounting for approximately 81% of NAB’s revenue, the NIM figure carries disproportionate weight. A bank with a structurally lower NIM must compensate through volume growth or cost control, and NAB’s strong credit growth (gross lending assets rising from $781 billion to $804.2 billion) reflects exactly that trade-off.
A high cash rate cuts both ways. The RBA’s 4.35% cash rate heading into 2026 lifted asset yields on variable-rate loans, supporting the revenue side of the margin equation. At the same time, it intensified deposit competition as customers shifted savings into higher-rate products, compressing the cost side.
NAB’s reference to “improved deposit outcomes” in its 1H26 commentary indicates the bank managed this deposit competition more effectively than in prior periods, which drove the 3 basis point NIM expansion. The direction of NIM movement matters as much as the absolute level; a bank whose NIM is rising, even modestly, signals improving revenue quality.
The RBA monetary policy board decision announced on 5 May 2026 confirmed a cash rate of 4.35%, providing the rate environment context within which NAB’s deposit competition and margin dynamics played out during the first half of 2026.
CET1 measures a bank’s core equity capital as a percentage of its risk-weighted assets (the total value of assets adjusted for how risky they are). A higher CET1 means a larger buffer against unexpected loan losses, and it is the metric that determines whether a bank can continue paying dividends, absorb losses during a downturn, or undertake capital management activities.
APRA’s Prudential Standard APS 110 establishes the minimum CET1 ratio of 4.5% plus a capital conservation buffer of 2.5%, forming the regulatory floor that underpins the 10.50% total requirement referenced in NAB’s operating framework, with APRA retaining discretion to impose higher individual capital requirements on specific institutions.
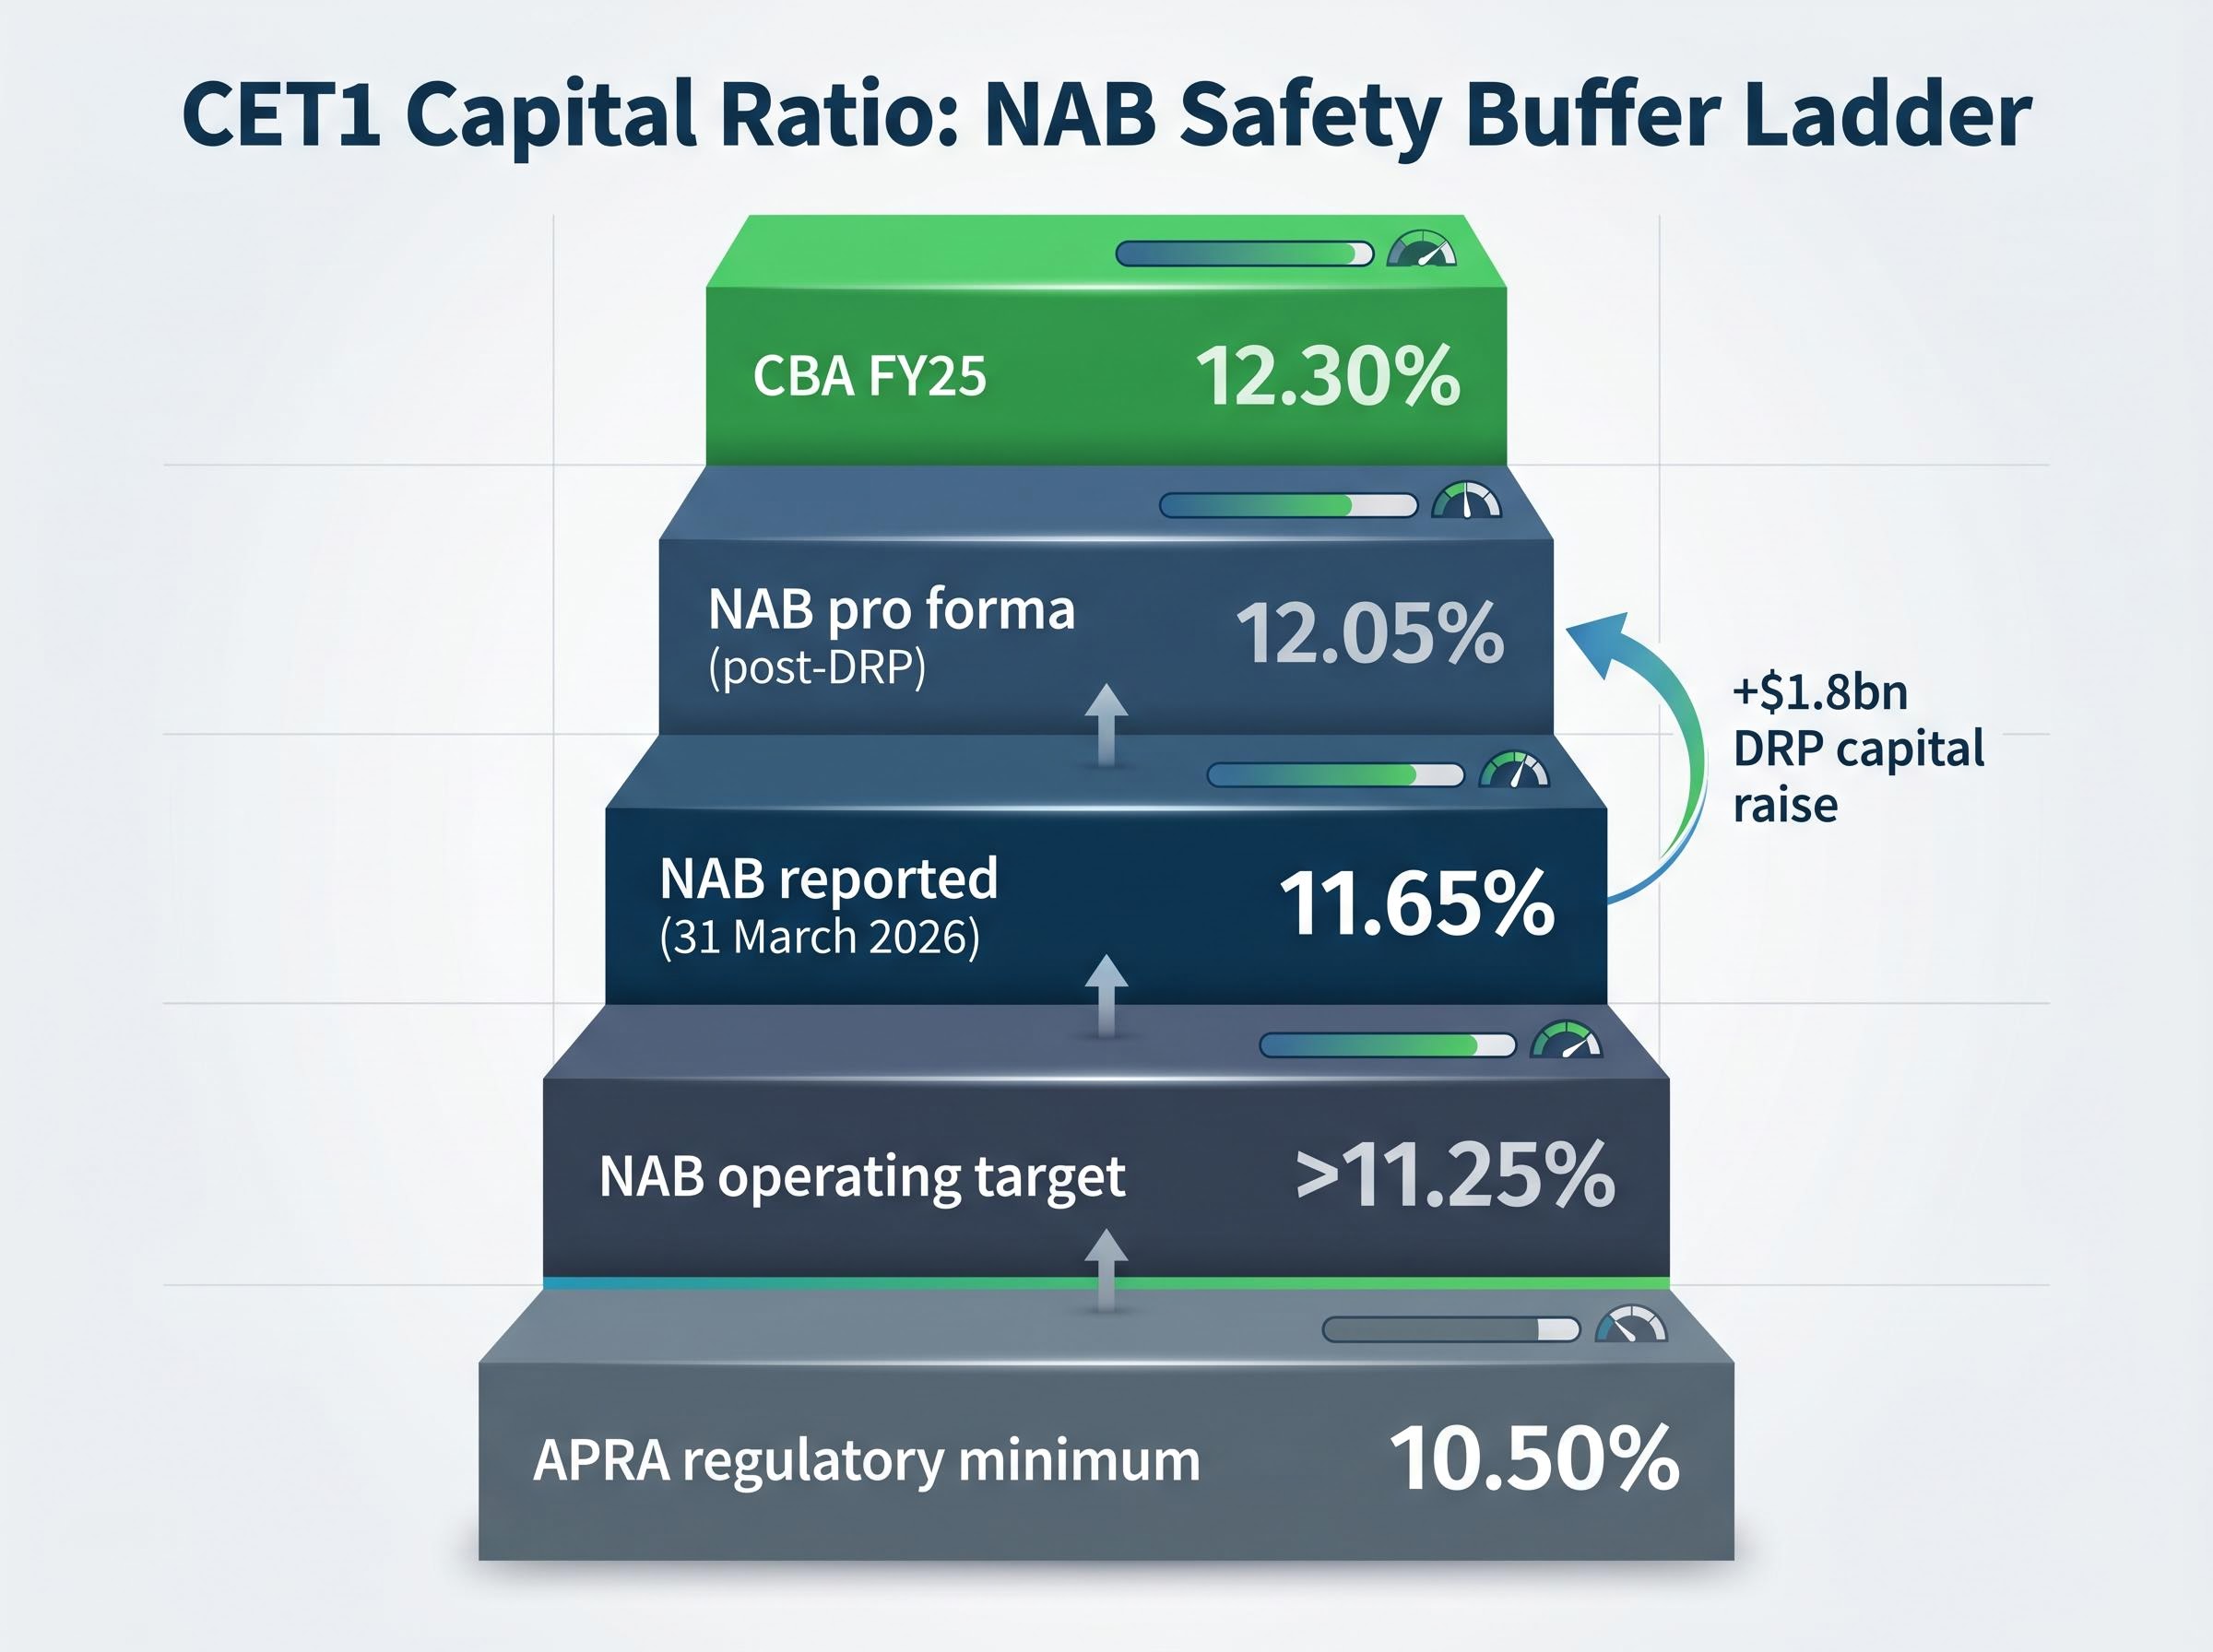
NAB’s 1H26 results placed the reported CET1 at 11.65% as at 31 March 2026, down 5 basis points from 11.70% at September 2025 (end of FY25). On a pro forma basis, incorporating the $1.8 billion Dividend Reinvestment Plan raise, CET1 rose to 12.05%.
The threshold ladder below shows where NAB sits relative to regulatory and self-imposed benchmarks, alongside CBA’s position.
| Label | CET1 Ratio | Significance |
|---|---|---|
| APRA regulatory minimum | 10.50% | Floor below which a bank faces regulatory intervention |
| NAB operating target | >11.25% | Self-imposed buffer above regulatory minimum |
| NAB reported (31 March 2026) | 11.65% | 40bps above operating target |
| NAB pro forma (post-DRP) | 12.05% | Includes $1.8bn DRP capital raise |
| CBA FY25 | 12.30% | Peer benchmark; stronger reported position |
The 5 basis point decline from September 2025 occurred despite profit generation and a capital raise. The mechanism works in three steps:
This illustrates why CET1 can fall even when a bank is profitable. The ratio reflects not just how much capital a bank holds, but how much risk it is carrying relative to that capital.
CET1 ratios across the Big Four all comfortably exceed APRA’s 10.5% minimum, a point that underscores an important analytical distinction: capital adequacy is not what drives sell ratings on three of the four banks, stretched valuations relative to earnings growth expectations are, which means the CET1 framework tells investors about balance sheet resilience but not about whether a share is priced correctly.
No single metric tells the full story of a bank’s quality. Analysts form their investment view by running all three metrics simultaneously across the Big Four, looking for relative strengths and weaknesses. The table below consolidates NAB’s position alongside available peer data.
| Bank | ROE | NIM | CET1 | Period / Confidence |
|---|---|---|---|---|
| NAB | 11.6% (ex-LNI) | 1.81% | 11.65% / 12.05% (pro forma) | 1H26; verified |
| CBA | 13.4% (statutory) | Not confirmed | 12.30% | FY25; ROE and CET1 verified |
| Westpac | Indicative only | 1.94% | Indicative only | FY25; NIM verified |
| ANZ | Pending | Pending | Pending | 1H26 results released; consolidation pending |
The combined picture shows NAB trailing CBA on both ROE and capital strength, while also carrying a lower NIM than Westpac. Where NAB compensates is volume: underlying profit grew 6.4%, and gross lending assets expanded from $781 billion to $804.2 billion, reflecting strong broad-based credit growth.
The average 12-month analyst price target for NAB sits at $38.913, with a high target of $48.50. Against a current price of $38.36, the consensus implies the market is pricing NAB close to fair value on present metrics, with upside dependent on margin and capital trajectory.
NAB’s 1H26 interim dividend of 85 cents per share, fully franked, implies an annualised yield of approximately 4.4% at the current price. For yield-focused investors, the dividend sustainability question connects directly back to the CET1 buffer: at 12.05% pro forma, NAB holds comfortable headroom above its operating target.
For yield-focused investors who want to extend the NAB dividend analysis across all four banks, our dedicated guide to Big Four bank income after franking compares the grossed-up yields, franking rates, and projected dividend trajectories for ANZ, Westpac, and CBA alongside NAB, including how the steepest weekly declines of 2026 changed the entry yield calculus for each bank.
The NAB case study illustrates a repeatable three-step process that applies to any Big Four results release:
Several caveats apply when using this framework across banks:
NAB trades at a price-to-book ratio of approximately 1.4x, which indicates the market is paying a premium above the book value of equity. This ratio is itself a function of the three metrics discussed: a bank with a higher ROE, stable NIM, and strong CET1 will typically command a higher P/B multiple.
Price-to-earnings multiples add a fourth dimension to the three-metric framework: CBA’s approximately 27x P/E ratio sits well above its historical average of approximately 18x and global peers trading near 12x, illustrating why strong ROE, stable NIM, and adequate CET1 can coexist with analyst sell ratings when the market has already priced in the earnings quality at a significant premium.
For independent verification, APRA’s monthly banking statistics publication provides free public access to capital and lending data across all authorised deposit-taking institutions.
The 5 May 2026 sell-off illustrated precisely why surface-level price watching is insufficient for bank investors. The share price fell nearly 3% on a revenue miss. The underlying metrics told a more nuanced story.
NAB reported a CET1 ratio comfortably above its operating target, a NIM that expanded by 3 basis points, and an ex-LNI ROE of 11.6% that improved on FY25. This is not a bank in distress. It is a bank where the market re-priced expectations on revenue trajectory while the balance sheet and earnings quality remained intact.
As the rate cycle evolves, each of these three metrics will shift. A falling RBA cash rate would compress asset yields but may ease deposit competition. CET1 will move with credit growth and any further APRA framework revisions. ROE will reflect the net effect of margin pressure and volume gains. The framework does not change; the inputs do.
Readers who revisit these three metrics at each new results season, for NAB and its peers, will read bank earnings with the same lens that professional analysts use.
This article is for informational purposes only and should not be considered financial advice. Investors should conduct their own research and consult with financial professionals before making investment decisions. Past performance does not guarantee future results. Financial projections are subject to market conditions and various risk factors.
Return on equity (ROE) measures how much profit a bank generates for every dollar of shareholders' equity, expressed as a percentage. For ASX bank investors, it is the primary efficiency test, with NAB reporting an ex-notable items cash ROE of 11.6% for 1H26, compared to CBA's statutory ROE of 13.4% for FY25.
Net interest margin (NIM) is the difference between the interest rate a bank earns on loans and the rate it pays on deposits, expressed as a percentage of earning assets. NAB reported a 1H26 NIM of 1.81%, up 3 basis points from the prior half, driven by improved deposit outcomes, and because lending income accounts for roughly 81% of NAB's revenue, even small NIM movements have a material impact on profitability.
Despite underlying profit growth of 6.4% and a fully franked 85 cent interim dividend, the NAB share price dropped nearly 3% on 5 May 2026 because the market re-priced expectations around revenue trajectory, particularly the NIM and volume outlook, even though balance sheet quality and underlying earnings remained intact.
The CET1 ratio measures a bank's core equity capital as a percentage of its risk-weighted assets, with APRA setting a regulatory floor of 10.5% and NAB self-imposing an operating target above 11.25%. NAB reported a CET1 of 11.65% as at 31 March 2026, rising to 12.05% on a pro forma basis after incorporating its $1.8 billion Dividend Reinvestment Plan raise.
Analysts benchmark NAB against CBA, Westpac, and ANZ by running ROE, NIM, and CET1 side by side across reporting periods. Based on available data, CBA leads on ROE at 13.4% and CET1 at 12.30%, Westpac leads on NIM at 1.94%, and NAB compensates with volume growth, expanding gross lending assets from $781 billion to $804.2 billion in 1H26.